R E S E A R C H A R T I C L E
Open Access
Validation of the Intermountain patient perception
of quality (PPQ) survey among survivors of an
intensive care unit admission: a retrospective
validation study
Samuel M Brown
1,2,3,13*, Glen McBride
4, Dave S Collingridge
5, Jorie M Butler
3,6,7, Kathryn G Kuttler
1,3,8,
Eliotte L Hirshberg
1,2,3,9, Jason P Jones
10, Ramona O Hopkins
1,3,11, Daniel Talmor
12, James Orme
1,2,3for the Center for Humanizing Critical Care
Abstract
Background:Patients’perceptions of the quality of their hospitalization have become important to the American healthcare system. Standard surveys of perceived quality of healthcare do not focus on the Intensive Care Unit (ICU) portion of the stay. Our objective was to evaluate the construct validity and internal consistency of the
Intermountain Patient Perception of Quality (PPQ) survey among patients discharged from the ICU.
Methods:We analyzed prospectively collected results from the ICU PPQ survey of all inpatients at Intermountain Medical Center whose hospitalization included an ICU stay. We employed principal components analysis to determine the constructs present in the PPQ survey, and Cronbach’s alpha to evaluate the internal consistency (reliability) of the items representing each construct.
Results:We identified 5,680 patients who had completed the PPQ survey. There were three basic domains measured: nursing care, physician care, and overall perception of quality. Most of the variability was explained with the first two principal components. Constructs did not vary by type of respondent.
Conclusions:The Intermountain ICU PPQ survey demonstrated excellent construct validity across three distinct constructs. This, in addition to its previously established content validity, suggests the utility of the PPQ survey as an assay of the perceived quality of the ICU experience.
Keywords:Intensive care, Patient satisfaction, Healthcare quality, Patient experience
Background
Both the technical quality and consumer perception of the quality of healthcare have become pressing issues in the contemporary American medical system. The Hospital Consumer Assessment of Healthcare Providers and Systems (HCAHPS) survey [1-3] is the best-known survey that is used to measure and improve patient-relevant quality outcomes. However, the HCAHPS
is not specific to the ICU portion of a hospitalization, which may limit its applicability to improving the quality of care within the ICU. Intermountain Healthcare, a large, non-profit network of hospitals and clinics in the Intermountain West, has been measuring quality and patient-perceived quality for two decades. As part of this effort, in the 1990s Intermountain developed the Patient Perception of Quality (PPQ) survey through an iterative process intended to develop a “taxonomy of inpatient experiences.” Using long- and short-form structured interviews with hospital personnel (primarily physicians and nurses), hospital administrators, and re-cently discharged patients (300 randomly selected pa-tients recently discharged from any of 10 Intermountain
* Correspondence:samuel.brown@imail.org
1
Pulmonary and Critical Care Medicine, Intermountain Medical Center, 5121 S Cottonwood St, Murray, UT, USA
2
Pulmonary and Critical Care Medicine, University of Utah School of Medicine, 26 North 1900 East, Salt Lake City, UT, USA
Full list of author information is available at the end of the article
hospitals), constructs contained within the resulting PPQ survey were inductively defined from qualitative analysis. Themes within these structured interviews included at-tention to processes of care and identified multiple healthcare workers whose influence may have been im-portant to patient experience. Survey items were devel-oped from constructs identified in the initial phase and were then pilot tested in another 300 patients who had received inpatient care within the following departments of Intermountain hospitals: labor and delivery, ortho-pedics, neurology, medical-surgical, rehabilitation, car-diothoracic surgery, and ICU [4-6]. Intermountain subsequently administered the resulting PPQ to pa-tients admitted to an ICU, asking them (or a family member) to comment specifically on their experience with the ICU as distinct from their experience with the hospital admission overall.
In order to better understand the characteristics of the PPQ ICU survey, we undertook a principal components analysis of the PPQ responses completed by patients, or their surrogates, admitted to an ICU during an index hospitalization over a five-year period.
Methods
The PPQ is a 26-item, approximately 635-word survey that queries the “caring and concern” demonstrated by multiple types of healthcare workers as well as how well the healthcare workers“listened and seriously considered” what the patient communicated. Other topics include priv-acy, respect, clinical skill, ability to explain information, and shared decision making. The entire survey instrument is included in Additional file 1.
We analyzed results of the PPQ ICU survey adminis-tered to inpatients or their surrogates discharged from Intermountain Medical Center (IMC) from 2008–2012, inclusive. IMC is a 454-bed academic tertiary referral hospital in Salt Lake City, Utah with 84 ICU beds dis-tributed across five adult ICUs. The Intermountain ICU PPQ survey was administered entirely independently of and subsequent to the HCAHPS survey and asked re-spondents to answer with regard to their ICU experience rather than in regards to their overall hospitalization. The PPQ ICU survey (see Table 1 and the Additional file 1) was administered exclusively by telephone. During the scripted survey encounter, a single respondent was identified from among patient, spouse, parent, other family member, or friend. Respondents other than the patient were interviewed only when the patient poorly remembered the ICU stay or was not able to respond to the survey at the time of telephone contact. Up to five telephone attempts were made for each survey, after which the potential respondent was classified as unreachable. While monthly reports of survey disposition (e.g., unable to contact, refused participation, etc.) were
reported, survey-level disposition data is not maintained on the PPQ ICU survey, and, owing to a change in tele-phone survey vendors, the disposition reports are no lon-ger available.
[image:2.595.304.539.108.497.2]For validation we performed a principal components analysis (PCA) of the PPQ ICU survey results and then calculated item-total correlations and Cronbach’s Alpha for identified factors. PCA is a mathematical technique for simplifying a large number of variables by identifying patterns of covariance among them. These covariance patterns can be expressed as a few new variables that are weighted combinations of the many original variables (the weights are often called “loadings” by convention). These new variables are called the “principal compo-nents” of the data and represent important underlying structure in the data. PCA thereby allows empirical de-termination of what constructs (components) the PPQ
Table 1 PPQ Items clustered by posited group, with distribution
Variable Item Percent with
top score
Mean (SD)
Physician
PHCC Physician caring and concern 61 4.42 (0.88)
PHSK Physician skill 69 4.57 (0.75)
PHEX Did the physician explain? 59 4.35 (0.97)
Nurse
NUCC Nurse caring and concern 67 4.53 (0.79)
NUSK Nurse skill 63 4.50 (0.76)
NUFL Did the nurse followup? 56 4.34 (0.91)
NUEX Did the nurse explain? 56 4.35 (0.91)
NUCO Nurse listening/consideration of your insights
58 4.37 (0.91)
Pain Control
CLPN How well was your pain controlled?
56 4.31 (0.94)
Housekeeping
HKRM Was your room clean? 60 4.44 (0.81)
Teamwork and Privacy
STPV Did staff respect your privacy? 63 4.49 (0.78)
STTM Did the teamwork together to coordinate care?
57 4.38 (0.85)
TRIN Did the team prepare you to leave the ICU?
51 4.21 (1.01)
STDE Team incorporated your concerns into decision making
51 4.21 (1.01)
General quality
OVCS Overall quality of care provided 61 4.45 (0.82)
CLBE Confidence the ICU provided best care possible
72 4.62 (0.74)
measures, an additional level of validation important to establishing the validity of the PPQ. PCA is also import-ant because it identifies which questions can be aggre-gated so that component themes can be compared with tests of statistical significance in future research. In addition, we evaluated the reliability of the questions loading onto each component with Cronbach’s Alpha test of internal consistency. Items most closely associ-ated with a given component are likely to reflect the same underlying construct; the Cronbach’s Alpha mea-sures the correlation among items belonging to the same construct.
We excluded patients who were on the Intermountain
“do not call” list and patients admitted to an ICU under
“observation” status, such as for brief monitoring after an invasive procedure. We included only respondents who could complete the survey in English; no non-English survey materials were available.
The Intermountain Healthcare Institutional Review Board exempted this quality improvement project from the requirement for informed consent. The Inter-mountain Privacy board approved publication of these results.
Statistical methods
We report central tendencies as mean (normally distrib-uted data) or median (non-normally distribdistrib-uted data). We compared between or among group central ten-dencies with Fisher’s exact, Student’s t-test, multiple ANOVA, Wilcoxon rank-sum, or Kruskal-Wallis statis-tic as dictated by type of comparison and normality of the data.
For factor/construct analysis we employed principal components analysis with oblique rotation to allow for correlation among the factors. Specifically we compared the factors identified on these analyses to the constructs proposed during the development of the ICU PPQ (“physician quality”, “nurse quality”, “pain control”,
“housekeeping”,“teamwork and privacy”,“general quality”). After the factors were extracted and identified, we evalu-ated the internal consistency of each with Cronbach’s Alpha test of reliability. We performed a sensitivity analysis that evaluated the stability of the construct/factor analysis for different respondents. Our primary approach to miss-ing data was to restrict our analysis to complete cases (listwise deletion). In a sensitivity analysis, we imputed the mean value of the item for missing items.
We performed all analyses in SPSS and the R Statistical Package, version 3.01 [7].
Results and Discussion
[image:3.595.305.539.88.305.2]From 2008–2012, inclusive, 26,366 unique inpatients were admitted to an IMC ICU, of whom 2,440 died be-fore a survey could be completed. Figure 1 summarizes
Figure 1Flow-chart representing patient selection process by which survey respondents were identified.
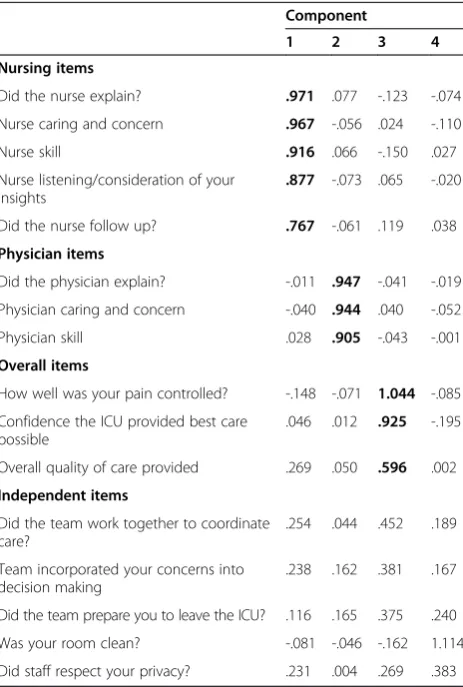
Table 2 Pattern matrix of principal components analysis
Component
1 2 3 4
Nursing items
Did the nurse explain? .971 .077 -.123 -.074
Nurse caring and concern .967 -.056 .024 -.110
Nurse skill .916 .066 -.150 .027
Nurse listening/consideration of your insights
.877 -.073 .065 -.020
Did the nurse follow up? .767 -.061 .119 .038
Physician items
Did the physician explain? -.011 .947 -.041 -.019
Physician caring and concern -.040 .944 .040 -.052
Physician skill .028 .905 -.043 -.001
Overall items
How well was your pain controlled? -.148 -.071 1.044 -.085
Confidence the ICU provided best care possible
.046 .012 .925 -.195
Overall quality of care provided .269 .050 .596 .002
Independent items
Did the team work together to coordinate care?
.254 .044 .452 .189
Team incorporated your concerns into decision making
.238 .162 .381 .167
Did the team prepare you to leave the ICU? .116 .165 .375 .240
Was your room clean? -.081 -.046 -.162 1.114
Did staff respect your privacy? .231 .004 .269 .383
[image:3.595.306.538.364.708.2]the strategy that identified 5,680 inpatient admissions as-sociated with a completed PPQ ICU survey. Twenty-four percent of eligible respondents completed a survey. Missing data occurred in 0-8% of individual items on the survey: 4,087 (72%) surveys represented complete sur-veys for the 16 items of interest. Respondents included primarily spouses (N = 2,208; 39%), parents (N = 1,642; 29%), and patients (N = 1,411; 25%), with the rest classi-fied as“other.” Table 1 displays the PPQ items, grouped by posited underlying construct, as well as the mean and standard deviation for those items. All items were nega-tively skewed, with median of 5 (inter-quartile range of 4–5) out of 5 possible points. The proportion of respon-dents giving the“top score”(“Excellent” or “Always”) in each category ranged from 51% to 72%, as displayed in Table 1.
In principal components analysis (results depicted in Table 2), the first component (58.50% of variance) re-ferred to nursing elements with loadings of 0.77-0.97 in the pattern matrix for all five nurse-related items. The second component (7.73% of variance) clearly distin-guished three physician-related items from all other items with loadings of 0.91-0.95. The third component (4.57% of variance) was represented by six items related to overall quality of care in the hospital with loadings of
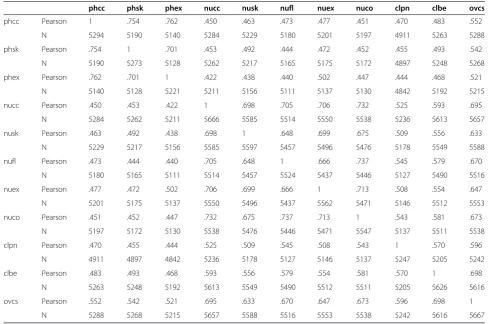
0.60-1.0. The items on cleanliness and privacy loaded onto none of the three components. Taken together, the three components that we identified accounted for 71% of the total variance. Figure 2 displays a component plot of the first three components, visu-ally demonstrating the dimension reduction effected by PCA. Diagnostics for the PCA suggested adequate decomposition: (A) Determinant value of 0.0000065 was less than 0.00001 indicating that dimension reduction is indicated, (B) Overall Kaiser–Meyer–Olkin (KMO) value of 0.964 was superb indicating that correlation patterns were compact enough to elicit reliable and distinct fac-tors, and (C) Bartlett’s Test of Sphericity was significant (p < 0.001) indicating that the population correlation matrix for our items was significantly different from the identity matrix. Cronbach’s Alpha for the items within nursing, physician, and overall care components were 0.92, 0.89, and 0.90 respectively, suggesting excellent inter-item correlation within each component. The over-all Cronbach’s Alpha for all items was 0.95, although the correlation matrix (Table 3) suggested no evidence of redundancy within the correlation matrix.
On sensitivity analysis of the relationship between the PCA constructs and the identity (e.g. patient, spouse, parent, other family member, or friend) of
[image:4.595.57.539.406.706.2]the respondent, there was very little difference among the respondents beyond the “other” category, which had too few respondents (N = 46) to support a robust PCA. On the sensitivity analysis in which we imputed missing items, there was no substantial difference within the PCA. While differences in the overall hos-pital rating by respondent achieved statistical signifi-cance (p < 0.001 by Kruskal Wallis) the difference was relatively minor, with means varying from 4.33 (“other” respondent) on the low end to 4.54 (patient respondent) on the high end (median for all types of respondents was 5). The respondents did not differ in their overall physician rating (p = 0.64), while their assessment of nursing skill was significant (p = 0.002), with minor difference in the mean responses (“other” respondents’ responses were slightly lower, and pa-tients’ responses were slightly higher than other types of respondents).
Notably, the overall hospital rating varied both by the specific ICU (p < 0.001 by Kruskal-Wallis) and by year of assessment (p < 0.001 by Kruskal-Wallis). Whereas the mean for overall hospital rating was 4.37 for 2008, it was 4.55 for 2012.
Conclusions
In a large sample from all ICUs at a referral center in the Intermountain West, we found that the Intermountain ICU PPQ survey administered to ICU survivors and/or a member of their family primarily identified three con-structs of perceived quality: overall quality of care, quality of nurses, and quality of physicians. The structure of the survey was similar across different classes of re-spondents. These data suggest that analyses of results from the ICU PPQ survey could be fruitfully summa-rized as composite scores on each of the three compo-nents and that the survey could be made more frugal through exclusion of items outside the three compo-nents. Overall, respondents were reasonably well satis-fied with the quality of care they received. Our sample size (5680) compares favorably with the majority of studied instruments to measure perceived quality of care among hospitalized patients [8]. The ICU PPQ Survey is somewhat more frugal than HCAHPS overall, and the constructs apparent on our PCA are fewer than the 6 constructs apparent in the HCAHPS survey [9].
[image:5.595.53.542.99.423.2]The ICU PPQ survey could serve as a useful comple-ment to mandatory HCAHPS survey activity for the
Table 3 Correlation Matrix for 11 Questions loading onto at least one component
phcc phsk phex nucc nusk nufl nuex nuco clpn clbe ovcs
phcc Pearson 1 .754 .762 .450 .463 .473 .477 .451 .470 .483 .552
N 5294 5190 5140 5284 5229 5180 5201 5197 4911 5263 5288
phsk Pearson .754 1 .701 .453 .492 .444 .472 .452 .455 .493 .542
N 5190 5273 5128 5262 5217 5165 5175 5172 4897 5248 5268
phex Pearson .762 .701 1 .422 .438 .440 .502 .447 .444 .468 .521
N 5140 5128 5221 5211 5156 5111 5137 5130 4842 5192 5215
nucc Pearson .450 .453 .422 1 .698 .705 .706 .732 .525 .593 .695
N 5284 5262 5211 5666 5585 5514 5550 5538 5236 5613 5657
nusk Pearson .463 .492 .438 .698 1 .648 .699 .675 .509 .556 .633
N 5229 5217 5156 5585 5597 5457 5496 5476 5178 5549 5588
nufl Pearson .473 .444 .440 .705 .648 1 .666 .737 .545 .579 .670
N 5180 5165 5111 5514 5457 5524 5437 5446 5127 5490 5516
nuex Pearson .477 .472 .502 .706 .699 .666 1 .713 .508 .554 .647
N 5201 5175 5137 5550 5496 5437 5562 5471 5146 5512 5553
nuco Pearson .451 .452 .447 .732 .675 .737 .713 1 .543 .581 .673
N 5197 5172 5130 5538 5476 5446 5471 5547 5137 5511 5538
clpn Pearson .470 .455 .444 .525 .509 .545 .508 .543 1 .570 .596
N 4911 4897 4842 5236 5178 5127 5146 5137 5247 5205 5242
clbe Pearson .483 .493 .468 .593 .556 .579 .554 .581 .570 1 .698
N 5263 5248 5192 5613 5549 5490 5512 5511 5205 5626 5616
ovcs Pearson .552 .542 .521 .695 .633 .670 .647 .673 .596 .698 1
N 5288 5268 5215 5657 5588 5516 5553 5538 5242 5616 5667
purposes of ICU quality improvement because the ICU PPQ survey is specific to the ICU experience and allows for non-patient respondents. Results of HCAHPS sur-veys will be affected by the hospital units (or emergency department) in which patients stayed before and after the ICU stay, making it more difficult to infer ICU qual-ity performance from typical HCAHPS survey results. Other measures of ICU satisfaction have been studied, including the Family Satisfaction with ICU (FS-ICU) sur-vey [10]. While specific to the ICU, the FS-ICU is restricted to family members only and is less frugal than the ICU PPQ Survey. Unfortunately, we were unable to make a direct comparison between the FS-ICU and the ICU PPQ survey in this study.
Overall, patients answered less frequently than spouses or parents and exhibited higher satisfaction than all other respondents. Whether the difference in perceived quality is because patients able to respond to the survey were healthier than patients unable to respond to the survey or because patients tend to rate healthcare expe-riences more favorably than their family members cannot be determined from the current study. We ac-knowledge that in other work, e.g., on quality of life, proxy and patient responses have correlated relatively poorly [11,12]. Unfortunately, we were unable to make a direct comparison of patient and proxy responses in the present study. The PPQ questionnaire appears to iden-tify both temporal and inter-ICU differences, suggesting potential utility, although there remains a risk of bias re-lated to patient populations (e.g., postoperative routine surgery versus major trauma) that may affect inter-ICU differences in scores.
We acknowledge that telephone surveys are consist-ently more positive than mail questionnaires in the HCAHPS survey [13]. The telephone mode may have contributed to overall higher scores on the PPQ, but this does not affect the construct validity presented in this study. Unfortunately, we do not have data on specific reasons for or distribution of non-response to this PPQ survey.
Per HCAHPS policy, we did not interview families of patients who died during or shortly after their hospital admission. We are therefore unable to comment on whether the PPQ survey could accurately capture satis-faction with ICU care during a hospitalization after which the patient did not survive.
In conclusion the Intermountain ICU PPQ survey demonstrated excellent construct validity across three distinct constructs: perceived quality of nurses, perceived quality of physicians, and overall perceived quality of the ICU. The construct validity of the ICU PPQ survey, in addition to its established content validity, suggests the utility of the ICU PPQ survey as an assay of the per-ceived quality of the ICU experience.
Additional file
Additional file 1:The Intermountain PPQ Survey.
Abbreviations
FS-ICU:Family satisfaction in intensive care unit survey; HCAHPS: Hospital consumer assessment of healthcare providers and systems survey; ICU: Intensive care unit; IMC: Intermountain medical center; PCA: Principal components analysis; PPQ: Patient perception of quality survey.
Competing interests
The authors declare that they have no competing interests.
Authors’contributions
GM developed the PPQ instrument. SB, GM, JB, KK, EH, RH, DT, JO conceived the study. SB drafted the manuscript. SB, GM, and KK obtained the data. SB, DC, JJ reviewed and performed QA on the data. DC performed factor analysis. JJ, JB, EH, RH provided statistical and/or psychometric expertise and methodological insights. All authors reviewed and revised the manuscript for important intellectual content. All authors read and approved the final manuscript.
Acknowledgments
This study was funded by the National Institute of General Medical Sciences (K23GM094465 to SMB). The funding agencies had no role in the design and conduct of the study; collection, management, analysis, and interpretation of the data; and preparation, review, or approval of the manuscript. Dr. Brown had full access to all of the data in the study and takes responsibility for the integrity of the data and the accuracy of the data analysis.
The views expressed in this article are those of the authors and do not necessarily reflect the position or policy of the Department of Veterans Affairs or the United States government.
Author details
1
Pulmonary and Critical Care Medicine, Intermountain Medical Center, 5121 S Cottonwood St, Murray, UT, USA.2Pulmonary and Critical Care Medicine,
University of Utah School of Medicine, 26 North 1900 East, Salt Lake City, UT, USA.3Center for Humanizing Critical Care, Intermountain Healthcare, 5121 S
Cottonwood St, Murray, UT, USA.4Strategic Planning and Research, Intermountain Healthcare, 36 S. State St., Salt Lake City, UT, USA.5Office of
Research, Intermountain Healthcare, 5121 S Cottonwood St, Murray, UT, USA.
6Geriatrics Research Education and Clinical Center (GRECC), Veterans Affairs
Medical Center, Salt Lake City, UT, USA.7Department of Internal Medicine, Geriatrics Division, University of Utah School of Medicine, 30 N 1900 E, Salt Lake City, UT, USA.8Homer Warner Center for Informatics Research, Intermountain Healthcare, 5171 South Cottonwood Street, Suite 220, Murray, UT, USA.9Pediatric Critical Care, University of Utah, 26 North 1900 East, Salt Lake City, UT, USA.10Kaiser-Permanente Southern California, 100 S Los Robles
Ave, Pasadena, CA, USA.11Psychology Department and Neuroscience Center, Brigham Young University, 1022 SWKT, Provo, UT, USA.12Anesthesia, Critical
Care and Pain Medicine, Beth Israel Deaconess Medical Center and Harvard Medical School, 1 Deaconess Rd, Boston, MA, USA.13Shock Trauma ICU,
Intermountain Medical Center, 5121 S. Cottonwood Street, Murray, UT 84107, USA.
Received: 17 November 2014 Accepted: 30 March 2015
References
1. Darby C, Hays RD, Kletke P. Development and evaluation of the CAHPS hospital survey. Health Serv Res. 2005;40:1973–6.
2. HCAHPS Hospital Survey. [http://www.hcahpsonline.org]
3. Goldstein E, Farquhar M, Crofton C, Darby C, Garfinkel S. Measuring hospital care from the patients' perspective: an overview of the CAHPS Hospital Survey development process. Health Serv Res. 2005;40:1977–95.
5. Harris PB, McBride G, Ross C, Curtis L. A place to heal: environmental sources of satisfaction among hospital Patients1. J Appl Soc Psychol. 2002;32:1276–99.
6. Harris PB, McBride G, Curtis L. Analyses of IHC Inpatient PPQ survey results. Salt Lake City, UT: Intermountain Healthcare; 1996.
7. R Development Core Team. A Language and Environment for Statistical Computing. Vienna, Austria: R Foundation for Statistical Computing; 2009. 8. Castle NG, Brown J, Hepner KA, Hays RD. Review of the literature on survey
instruments used to collect data on hospital patients' perceptions of care. Health Serv Res. 2005;40:1996–2017.
9. O'Malley AJ, Zaslavsky AM, Hays RD, Hepner KA, Keller S, Cleary PD. Exploratory factor analyses of the CAHPS Hospital Pilot Survey responses across and within medical, surgical, and obstetric services. Health Serv Res. 2005;40:2078–95.
10. Wall RJ, Engelberg RA, Downey L, Heyland DK, Curtis JR. Refinement, scoring, and validation of the Family Satisfaction in the Intensive Care Unit (FS-ICU) survey. Crit Care Med. 2007;35:271–9.
11. Dinglas VD, Gifford JM, Husain N, Colantuoni E, Needham DM. Quality of life before intensive care using EQ-5D: patient versus proxy responses. Crit Care Med. 2013;41:9–14.
12. Gifford JM, Husain N, Dinglas VD, Colantuoni E, Needham DM. Baseline quality of life before intensive care: a comparison of patient versus proxy responses. Crit Care Med. 2010;38:855–60.
13. de Vries H, Elliott MN, Hepner KA, Keller SD, Hays RD. Equivalence of mail and telephone responses to the CAHPS Hospital Survey. Health Serv Res. 2005;40:2120–39.
Submit your next manuscript to BioMed Central and take full advantage of:
• Convenient online submission • Thorough peer review
• No space constraints or color figure charges • Immediate publication on acceptance
• Inclusion in PubMed, CAS, Scopus and Google Scholar
• Research which is freely available for redistribution