RESEARCH
Malaria prevalence metrics in low-
and middle-income countries: an assessment
of precision in nationally-representative surveys
Victor A. Alegana
1,2*, Jim Wright
1, Claudio Bosco
1,2, Emelda A. Okiro
5, Peter M. Atkinson
1,3,4, Robert W. Snow
5,6,
Andrew J. Tatem
1,2and Abdisalan M. Noor
5,6,7Abstract
Background: One pillar to monitoring progress towards the Sustainable Development Goals is the investment in high quality data to strengthen the scientific basis for decision-making. At present, nationally-representative surveys are the main source of data for establishing a scientific evidence base, monitoring, and evaluation of health metrics. However, little is known about the optimal precisions of various population-level health and development indicators that remains unquantified in nationally-representative household surveys. Here, a retrospective analysis of the preci-sion of prevalence from these surveys was conducted.
Methods: Using malaria indicators, data were assembled in nine sub-Saharan African countries with at least two nationally-representative surveys. A Bayesian statistical model was used to estimate between- and within-cluster variability for fever and malaria prevalence, and insecticide-treated bed nets (ITNs) use in children under the age of 5 years. The intra-class correlation coefficient was estimated along with the optimal sample size for each indicator with associated uncertainty.
Findings: Results suggest that the estimated sample sizes for the current nationally-representative surveys increases with declining malaria prevalence. Comparison between the actual sample size and the modelled estimate showed a requirement to increase the sample size for parasite prevalence by up to 77.7% (95% Bayesian credible intervals 74.7– 79.4) for the 2015 Kenya MIS (estimated sample size of children 0–4 years 7218 [7099–7288]), and 54.1% [50.1–56.5] for the 2014–2015 Rwanda DHS (12,220 [11,950–12,410]).
Conclusion: This study highlights the importance of defining indicator-relevant sample sizes to achieve the required precision in the current national surveys. While expanding the current surveys would need additional investment, the study highlights the need for improved approaches to cost effective sampling.
Keywords: Indicators, Intra-class correlation, Malaria, Precision
© The Author(s) 2017. This article is distributed under the terms of the Creative Commons Attribution 4.0 International License (http://creativecommons.org/licenses/by/4.0/), which permits unrestricted use, distribution, and reproduction in any medium, provided you give appropriate credit to the original author(s) and the source, provide a link to the Creative Commons license, and indicate if changes were made. The Creative Commons Public Domain Dedication waiver (http://creativecommons.org/ publicdomain/zero/1.0/) applies to the data made available in this article, unless otherwise stated.
Background
There is an increasing demand for high quality data and statistics to support decision-making and track progress towards the Sustainable Development Goals in low- and
middle-income countries [1, 2]. This is not only
impor-tant for scientific understanding of infectious disease
epidemiology and health advocacy [3, 4], but is also
use-ful for evaluating the impact of health investments [5, 6].
Since the mid-2000s there has been a renaissance in the use of nationally-representative cross-sectional
house-hold surveys [7], such as the Malaria Indicator Surveys
(MIS) developed by the Roll Back Malaria Partnership
[8], the Multiple Indicator Cluster Surveys [9], and the
Demographic and Health Surveys (DHS) [10], as a source
of public health intelligence data to track progress on
uptake of some health interventions [11].
Open Access
*Correspondence: V.A.Alegana@soton.ac.uk; aleganav@gmail.com
1 Geography and Environment, University of Southampton,
Southampton, UK
The above surveys are nationally-representative, and provide data on many indicators. For example, the DHS surveys include variables on population demograph-ics, fertility in women, family planning, maternal and child health, and infectious diseases. The precision of these cross-sectional surveys is related to the sample size, budget, reference sampling indicator, the effect of indicator clustering, and the overall data quality affected
by non-sampling errors [12–14]. In practice a reference
indicator, usually an indicator for women of reproductive age (15–49 years) or indicator for pregnant women in the Kenya 2010 MIS, is used to determine sample size at design stage. Sample design is usually based on two-stage sampling design where primary sampling units (PSU) are first selected based on a complete list of census enu-meration areas (EAs), followed by a random selection of
households within the PSU [10]. While it is advantageous
to collect data on many variables in a single cross-sec-tional survey, the overall optimal sample size require-ments for all indicators are not always met and remain poorly defined due to difference between the reference sampling indicator and other indicators. Quantifying the precision in these indicators is important, not only in interpreting findings from the surveys, but also in design-ing future surveys.
Indicator precision can be quantified based on the effect of clustering as estimated via the intra-class
cor-relation coefficient (ICC) [15, 16]. The ICC, in general,
estimates the similarity of individual characteristics at a
primary sampling unit [15]. It has previously been used in
the design and analysis of cluster-randomized trials [17,
18]. Thus, a large estimate of ICC indicates greater
homo-geneity within the cluster and this requires only a small sample of households per cluster at the design stage. Conversely, a small intra-class correlation requires a large sample of households at cluster level, but fewer clusters
nationally. ICC is related to the survey design effect due to
clustering (loss of effectiveness) [19] commonly included
in current national survey reports. Bayesian estimation of
ICC has been examined in the design of clinical trials [20,
21]. The added value of the Bayesian approach includes:
(i) such a framework is tractable for complex statistical models and various sources of uncertainty can be incor-porated into the assessment of precision to aid
compara-bility between indicators and surveys [22] and (ii) prior
beliefs can be imposed on the cluster precision param-eters which are updated upon observing the data. Such methods are used here for assessing survey effectiveness in sub-Saharan Africa.
In this research, measures of cluster-sample survey efficiency in recent cross-sectional surveys in nine coun-tries in sub-Saharan Africa, were estimated. Although these surveys may differ in terms of implementation,
the objective here was to assess the precision of three malaria-related indicators independently of the survey or the base sampling indicator. A retrospective analysis was conducted based on variability in malaria parasitaemia, and two other indicators, namely fever and the use of insecticide-treated nets (ITNs) for children under 5 years (0–4 years). For example, the effective sample sizes was estimated, retrospectively, for parasite prevalence inde-pendent of survey costs, and compared with the original survey estimates that were based on prospective analysis. Such estimates of clustering can be useful in interpreta-tion of current survey data, and in designing and evalu-ating future surveys related to health and development. Moreover, costing modules can be implemented readily with these estimates to assess future financial needs.
Methods
Child morbidity indicators data
The main source of data was from nationally-represent-ative population-based household surveys undertaken for estimating population health outcomes and risk fac-tors. These included the demographic and health sur-veys (DHS), and the related disease-specific sursur-veys, the Tanzania HIV/AIDS and malaria indicator survey and the standalone malaria indicator surveys (MIS). Data were assembled for the three indicators namely; preva-lence of reported fever in the preceding 2 weeks, malaria test results from a rapid diagnostic test (RDT) based on a finger (or heel) prick blood sample, and use of ITNs. The three data variables were extracted only for children under the age of 5 years, along with survey dates, and geographical coordinates for each cluster-sample. Coun-tries were selected if more than two nationally-represent-ative household survey datasets were accessible, and data for the three indicators, including parasitaemia testing were available along with geographic coordinates at clus-ter level. Therefore, although data on the use of ITNs and prevalence of fever were available from earlier DHS and MIS surveys (i.e. since 2000), the incorporation of
parasi-taemia testing started in 2006 [23]. This resulted in nine
countries that met the criteria where data were available and the coverage period of surveys ranged from 2007 to
2016 (n = 20 surveys, 5839 clusters). These were in east
(i.e., if a child was not listed in the household or due to a child death). Missing data were imputed as NAs if a child was listed in the household with the response marked as “don’t know”, or missing the result of parasitaemia.
Random spatial sampling of DHS clusters
Simple random spatial sampling at the cluster level, rep-resenting 30% of clusters, was drawn without replace-ment (i.e. using an unweighted simple random sample). Consequently, no survey cluster appeared twice in the respective samples. Sampling was performed in ARCGIS 10 using the spatial random sampling design tool based on a sampling seed. For Kenya and Rwanda, a further test sample was drawn randomly without replacement
representing 20% (n greater than 30 clusters) and 40%
of clusters stratified by Administrative level 1 (ADMIN 1). The 30% subset sample (and 20, 40% samples) was used to estimate prevalence under simple random sam-pling (SRS) for the three indicators of fever, ITN use, and malaria parasitaemia testing. Of the total 5839 clusters in
the nine countries, only a few (n = 34; 0.6%) did not have
geographic coordinates and, therefore, these were not used in spatial random sampling selection. An estimate of bias was, therefore, based on the difference between the Bayesian simulated posterior mean and the expected value under SRS. The remaining 70% sample was used for simulation via the Bayesian Markov chain Monte Carlo
(MCMC) [24, 25] approach to generate posterior
distri-butions for various measures of survey effectiveness. The objective of the MCMC algorithm was to obtain a sta-tionary distribution with Monte Carlo integration used to approximate posterior expectations of the parameters of interest. The posterior samples were then used for infer-ence. These included summary statistics of the posterior distribution of the indicator, between- and within-cluster posterior variance, the intra-class correlation coefficient
(ICC), the survey design effect (deff), and posterior
esti-mate of the effective sample size (ESS).
Modelling household survey effectiveness parameters
Data were analysed by survey and by country, rather than pooling, such that there was no method induced corre-lation between surveys. The Bayesian hierarchical model was implemented via the MCMC approach in JAGS
ver-sion 4.2.0 [26] and the R2jags package in R version 3.3.1
[27]. The proportion of total variability between- and
within-clusters was estimated using the ICC(ρ). ICC was
estimated assuming a binomial distribution for number of individuals examined at a cluster based on RDT result, prevalence of fever or use of ITN, adjusting for person age, and survey domain stratification by urban or rural setting. The survey design effect was then modelled in the same framework based on estimates of ICC and used
to derive the optimal sample size based on the same number of clusters used in the original survey. For exam-ple, 200 clusters with an average cluster size of 36 house-holds were used to simulate the effective sample size in the 2007 Kenya MIS. The model parameter convergence rate was evaluated using a combination of the
Gelman-Rubin [28] and Raftery-Lewis methods [29]. For the
for-mer, a reduction factor of < 1.05 was used (the proposed threshold for detecting stationarity of a target posterior distribution in MCMC implementation). The latter pro-vided estimates of burn-in and thinning factors given an accuracy of 0.005 and coverage probability of 0.95 (prob-ability of the true values contained within predicted cred-ible interval). Extended descriptions of the methods are
provided in Additional file 1.
Results
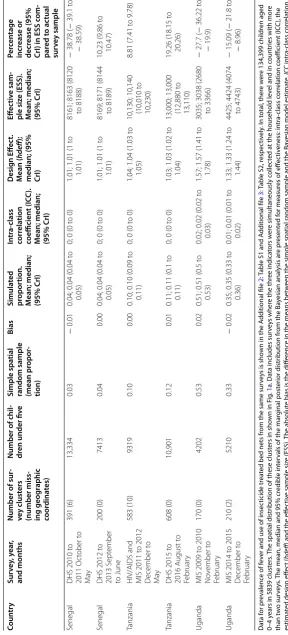
Table 1 shows the results for the 5839 clusters (134,399
children 0–4 years) split into the multiple data sources across nine countries, including estimated household survey effectiveness parameters for malaria prevalence only. For reasons of space, tables for the reported 14-day fever prevalence and the use of ITNs are included as
Additional file 2: Table S1, Additional file 3: Table S2,
respectively). Figure 1a shows the spatial distribution of
these clusters in the nine countries. The Bayesian mean, median and 95% credible intervals (Crl) are presented
along with estimates of ICC, deff and the ESS.
There was little difference in absolute bias, across the three indicators, between prevalence estimated from a simple spatial random sampling scheme and prevalence estimated from the Bayesian parameter model adjusted for age. This was also the case when simple random spatial sampling represented only 20 or 40% of the
clus-ters (Additional file 4: Table S3). The test for
conver-gence (Gelman–Rubin test) was less than 1.05 for all the parameters monitored in the MCMC implementation. The Raftery–Lewis method showed that a minimum of 3746 iterations were required to achieve an accuracy of 0.005 at coverage probability of 0.95 for most indicators and a minimum of 10,510 iterations to achieve an accu-racy of 0.0025 at coverage probability of 0.99. However, all the Bayesian model-based results are based on 55,000 iterations on two chains with a burn-in of 5,000 iterations and retaining every 50th iteration to produce a weakly
dependent sample of size n = 1000. An example of
con-vergence and mixing diagnostics for the 2010 Senegal
DHS is shown in the Additional file 5: Figure S1.
Figure 1b shows a scatterplot of modelled ICC estimate
against the mean model-based prevalence for the three
indicators in the 20 surveys. Figure 1c shows a scatterplot
Table 1 S ta tistics r ela ting t o the pr ev alenc e of malaria par asitaemia fr om the na tionally r epr esen ta tiv
e household sur
ve
ys (the demogr
aphic health sur
ve
y
(DHS), the malaria indic
at
or sur
ve
y (MIS) and
the HIV/AIDS and
malaria indic at or sur ve y) C oun tr y Sur vey , y ear , and mon ths Number of sur -vey clust ers (number miss -ing geog raphic coor dina tes) Number of chil -dr en under fiv e Simple spa tial
random sample (mean pr
opor -tion) Bias Simula ted pr opor tion. M ean; median; (95% CrI) In tr a-class corr ela tion coefficien t (IC C ). M ean; median; (95% CrI) Desig n Eff ec t. M ean ( hdeff );
median; (95% CrI)
Eff ec tiv e sam -ple siz e (ESS). M ean; median; (95% CrI) Per cen tage incr ease or decr ease (95% CrI) in ESS c om -par ed t o ac tual sur vey sample Ken ya
MIS 2007 June to July
200 (1)
3423
0.07
−
0.01
0.09; 0.09 (0.08 to 0.1)
0; 0 (0 t
o 0)
1.06; 1.06 (1.03 to 1.1) 6805; 6814 (6575 to 6983)
99.07 (92.08 t
o
104)
Ken
ya
MIS 2010 July t
o A ugust 240 (8) 5104 0.14 0.00
0.14; 0.14 (0.13 t
o
0.14)
0; 0 (0 t
o 0)
1.06; 1.06 (1.04 t
o
1.09)
6788; 6797 (6584 to 6953)
33.17 (29 t
o 36.23)
Ken
ya
MIS 2015 July t
o A ugust 246 (0) 4063 0.09 − 0.01
0.10; 0.10 (0.09 t
o
0.11)
0; 0 (0 t
o 0)
1.02; 1.02 (1.01 t
o
1.04)
7211; 7218 (7099 to 7288)
77.65 (74.72 t
o
79.37)
Liber
ia
MIS 2008 t
o 2009 D ecember t o M ar ch 150 (0) 4611 0.36 0.00
0.36; 0.36 (0.34 t
o
0.38)
0.02; 0.02 (0.01 t
o
0.03)
1.54; 1.54 (1.38 t
o
1.73)
2930; 2930 (2597 to 3254)
− 36.46 ( − 43.68 to − 29.43) Liber ia
MIS 2011 Sept
ember t o D ecember 150 (0) 3692 0.52 0.03
0.49; 0.49 (0.47 t
o
0.51)
0.03; 0.03 (0.02 t
o
0.04)
1.83; 1.82 (1.58 t
o
2.12)
2477; 2476 (2123 to 2843)
− 32.94 ( − 42.5 t o − 23) M adagascar
MIS 2011 M
ar ch to M ay 268 (1) 7138 0.06 0.00
0.06; 0.06 (0.05 t
o
0.07)
0; 0 (0 t
o 0)
1.03; 1.03 (1.02 t
o
1.04)
8349; 8354 (8234 to 8437)
17.04 (15.35 t
o
18.2)
M
adagascar
MIS 2013 M
ay t o June 274 (0) 6288 0.07 − 0.01
0.08; 0.08 (0.07 t
o
0.09)
0; 0 (0 t
o 0)
1.03; 1.03 (1.02 t
o
1.04)
8538; 8544 (8414 to 8630)
35.88 (33.81 t
o
37.25)
M
ala
wi
MIS 2012 M
ar ch to Apr il 140 (0) 2436 0.39 0.01
0.39; 0.39 (0.37 to 0.4)
0.01; 0.01 (0.01 t
o
0.02)
1.35; 1.34 (1.23 t
o
1.49)
2604; 2609 (2352 to 2857)
7.1 ( − 3.45 t o 17.28) M ala wi
MIS 2014 M
ay t o June 140 (0) 2249 0.32 0.03
0.29; 0.29 (0.27 t
o
0.31)
0.01; 0.01 (0.01 t
o
0.01)
1.24; 1.24 (1.15 t
o
1.35)
2827; 2831 (2592 to 3042)
25.88 (15.25 t
o
35.26)
N
iger
ia
MIS 2010 O
ct ober t o D ecember 239 (0) 4950 0.47 0.00
0.47; 0.47 (0.46 t
o
0.49)
0.03;0.03 (0.02 t
o
0.03)
1.64; 1.64 (1.49 t
o
1.82)
3793; 3797 (3411 to 4182)
− 23.29 ( − 31.09 to − 15.52) N iger ia
MIS 2015 O
ct ober t o No vember 326 (4) 7016 0.44 − 0.03
0.47; 0.47 (0.46 t
o
0.49)
0.03; 0.03 (0.02 t
o
0.03)
1.62; 1.61 (1.47 t
o
1.79)
5059; 5063 (4541 to 5549)
− 27.84 ( − 35.28 to − 20.91) Rwanda
DHS 2010 t
o 2011 S ept ember to M ar ch 492 (0) 8963 0.02 0.00
0.02; 0.02 (0.02 t
o
0.03)
0; 0 (0 t
o 0)
1.01; 1.01 (1 t
o
1.01)
12720; 12730 (12,660 t
o
12,760)
42.03 (41.25 t
o
42.36)
Rwanda
DHS 2014 t
o 2015 No vember to Apr il 492 (0) 7931 0.08 − 0.01
0.08; 0.08 (0.07 t
o
0.09)
0; 0 (0 t
o 0)
1.05; 1.05 (1.03 t
o
1.07)
12,210; 12,220 (11,950 t
o
12,410)
54.08 (50.67 t
o
56.47)
Senegal
MIS 2008 t
o 2009 No vember t o Februar y 320 (2) 16,156 0.12 − 0.02
0.14; 0.14 (0.13 t
o
0.15)
0; 0 (0 t
o 0.01)
1.12; 1.12 (1.08 t
o
1.17)
8590; 8599 (8231 to 8895)
[image:4.595.64.506.97.728.2]Table 1 c on tinued C oun tr y Sur vey , y ear , and mon ths Number of sur -vey clust ers (number miss -ing geog raphic coor dina tes) Number of chil -dr en under fiv e Simple spa tial
random sample (mean pr
opor -tion) Bias Simula ted pr opor tion. M ean; median; (95% CrI) In tr a-class corr ela tion coefficien t (IC C ). M ean; median; (95% CrI) Desig n Eff ec t. M ean ( hdeff );
median; (95% CrI)
Eff ec tiv e sam -ple siz e (ESS). M ean; median; (95% CrI) Per cen tage incr ease or decr ease (95% CrI) in ESS c om -par ed t o ac tual sur vey sample Senegal
DHS 2010 t
o 2011 O ct ober t o M ay 391 (6) 13,334 0.03 − 0.01
0.04; 0.04 (0.04 t
o
0.05)
0; 0 (0 t
o 0)
1.01; 1.01 (1 t
o
1.01)
8161; 8163 (8120 to 8188)
− 38.78 ( − 39.1 t o − 38.59) Senegal
DHS 2012 t
o 2013 S ept ember to June 200 (0) 7413 0.04 0.00
0.04; 0.04 (0.04 t
o
0.05)
0; 0 (0 t
o 0)
1.01; 1.01 (1 t
o
1.01)
8169; 8171 (8144 to 8189)
10.23 (9.86 t
o
10.47)
Tanzania
HIV/AIDS and MIS 2011 t
o 2012 D ecember t o M ay 583 (10) 9319 0.10 0.00
0.10; 0.10 (0.09 t
o
0.11)
0; 0 (0 t
o 0)
1.04; 1.04 (1.03 t
o
1.05)
10,130; 10,140 (10,010 t
o
10,230)
8.81 (7.41 t
o 9.78)
Tanzania
DHS 2015 t
o 2016 A ugust t o Februar y 608 (0) 10,901 0.12 0.01
0.11; 0.11 (0.1 t
o
0.11)
0; 0 (0 t
o 0)
1.03; 1.03 (1.02 t
o
1.04)
13,000; 13,000 (12,880 t
o
13,110)
19.26 (18.15 t
o
20.26)
Uganda
MIS 2009 t
o 2010 No vember t o Februar y 170 (0) 4202 0.53 0.02
0.51; 0.51 (0.5 t
o
0.53)
0.02; 0.02 (0.02 t
o
0.03)
1.57; 1.57 (1.41 t
o
1.78)
3035; 3038 (2680 to 3366)
− 27.7 ( − 36.22 t o − 19.9) Uganda
MIS 2014 t
o 2015 D ecember t o Februar y 210 (2) 5210 0.33 − 0.02
0.35; 0.35 (0.33 t
o
0.36)
0.01; 0.01 (0.01 t
o
0.02)
1.33; 1.33 (1.24 t
o
1.44)
4425; 4424 (4074 to 4743)
− 15.09 ( − 21.8 t o − 8.96) Da ta f or pr ev alenc
e of f
ev
er and use of insec
ticide tr
ea
ted bed nets fr
om the same sur
vey
s is sho
wn in the A
dditional file
2
: T
able S1 and A
dditional file
3
: T
able S2, r
espec tiv ely . I n t otal , ther e w er
e 134,399 childr
en aged
0–4
y
ears in 5839 clust
ers
. T
he spa
tial distr
ibution of these clust
ers in sho
wn in F
ig
.
1
a. Da
ta includes sur
vey
s wher
e the thr
ee indica
tors w
er
e simultaneously c
ollec
ted a
t the household lev
el and in c
oun
tr
ies with mor
e than t w o sur vey s.
The mean, median and 95% cr
edible in
ter
vals of the mar
ginal post
er
ior distr
ibution fr
om the Ba
yesian analy sis ar e pr esen ted f or measur
es of eff
ec tiv eness: in tr a-class c or rela tion c oefficien t (IC C ), the estima ted desig n eff ec t ( hdeff
) and the eff
ec
tiv
e sample siz
e (ESS).
The absolut
e bias is the diff
er
enc
e in the means bet
w
een the simple spa
tial r
andom sample and the Ba
yesian model estima
te . ICC in tr a-class c or rela tion coefficien t, ESS eff ec tiv
e sample siz
e; CrI Ba
yesian cr
edible in
ter
[image:5.595.153.442.92.729.2]of ICC was between 0 and 0.05 for the three indicators, and was consistent with the expected value for
popula-tion studies [30, 31]. Zero ICC indicated no correlation
of responses between and within the cluster. This was the case, for example, for malaria prevalence in
Tanza-nia, Senegal, and Rwanda (median ρ 0 (95% CrI [0–0])).
The values of ICC for the indicator, ρ = 0.01 or ρ = 0.02,
suggest that the within-cluster variance was greater than the between-cluster variance. The larger ICC values
(ρ > 0.02) were associated with a larger prevalence. The
effect of ICC was also reflected in the survey design effect
which was close to 1.0 (median deff 1.01 [1.0–1.01] when
ρ = 0), for example, for malaria prevalence in the 2010– 2011 Rwanda DHS, and in the 2010–2011 and 2012– 2013 Senegal DHS surveys. A design effect close to one
suggests similarity to simple random sampling. The deff
was also larger for the larger estimates of ICC (ρ > 0.04
and deff > 2.0), for example, for fever prevalence in the
2011 Liberia MIS (deff 2.52 [2.12–3.02]), or, ITN use in
the 2010 Kenya MIS (deff 2.40 [2.07–2.77]).
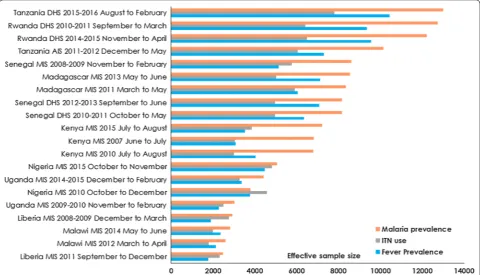
Figure 2 shows the ranking for each survey
indepen-dently by indicator and by prevalence for the modelled
ESS. Note that these surveys and countries are assessed independently rather than a direct comparison. The
com-bination of the deff and the ICC resulted in mixed results
in terms of the modelled estimated effective sample sizes for prevalence of fever, malaria and for ITN use by sur-vey. For some indicators, the ESS was higher while in
other indicators lower deff (less sampling complexity)
and ESS were estimated (mostly for fever and ITN use)
(Additional file 6: Figure S2). There was a change in ESS
across all the surveys by indicator. For example, in the 2014–2015 Rwanda DHS the estimated ESS for malaria prevalence increased by 54.08% [50.67–56.47] (median ESS of children 0–4 years 12,220 [11,950–12,410]) while in the Tanzania 2015–2016 DHS the ESS increased by 19.26% [18.15–20.26] (ESS 13,000 [12,880–13,110]). The largest percentage increase in the sample size require-ment for malaria prevalence based on surveys conducted in the last 5 years was for the 2015 Kenya MIS (by 77.65% [74.72–79.37]; ESS 7129 [7077–7164]). In three countries (Nigeria, Liberia, and Uganda) the ESS was lower than that of the survey sample for children of 0–4 years for all three indicators.
[image:6.595.56.540.88.365.2]Discussion
Using malaria indicators as an example, this study showed that variability at cluster level has an impact on the desired sample size for the indicator. On the one hand, the requirement for large sample size to support intervention monitoring reduces with the increasing use of interventions, but on the other hand the sample size increases with declining prevalence (of the indicator). At very low prevalence, variability within clusters was smaller, and the results suggest that large sample sizes are required at this low prevalence especially for blood tests compared to intervention use (ITN use). This sug-gests defining sample sizes for malaria indicator surveys to increase the precision of detecting prevalence. Com-parison between the actual sampled numbers of children aged 0–4 years in the most recent surveys and the esti-mated effective sample sizes for RDTs showed a deficit in the actual sample size of up to 77.65% [74.72–79.37] for the 2015 Kenya MIS, 25.88% [15.25–35.26] for the 2014 Malawi MIS, 53.3% [54.08–56.47] for the 2014–2015 Rwanda DHS, and by 19.26% [18.15–20.26] for the 2015-to-2016 Tanzania DHS. Smaller required sample sizes (when compared to the actual national sample) were estimated across the three indicators in only Senegal, Liberia, Nigeria, and Uganda suggesting a sub-national relevance of estimates for surveys in these countries.
This study quantified sample size requirements for three malaria-related indicators in recent household sur-veys. Although such an assessment could be extended to other indicators, it is important to establish the rel-evance and basis of such an undertaking. Findings here suggest that it may be advantageous to optimize malaria surveys using biomarkers as reference variables. Such an approach could improve precision requirements for other indicators included in these surveys, for example fever prevalence and use of ITNs in children aged 0–4 years, as estimated in these nine study countries with varying transmission. This may also have an added value in sur-veys where the initial reference sampling indicators were based on prevalence of interventions (for example, the
2007 Kenya MIS [32]), thereby contributing to reduced
precision for biomarkers. Biomarkers were introduced in these nationally representative surveys in 2006 and this study highlighted the requirement for larger sample sizes for malaria blood testing in recent surveys. Such bio-markers have the advantage of being an objective
meas-ure of health compared to self-reported conditions [33].
[image:7.595.58.539.89.364.2]in the recent 2015 Kenya MIS, the estimates of intra-class correlation and the design effect suggest that much larger sample sizes may be required for the parasitaemia indica-tor compared to past survey designs predating the intro-duction of this RDT-based biomarker. Under conditions of pre-elimination (i.e., parasite prevalence < 1%), the use of surveillance through combined active and passive case
detection is already encouraged by the current policy [34,
35]. Thus, there is a need to design cost-effective ways of
focussed cross-sectional surveys in sub-national areas experiencing stable malaria transmission with routine surveillance in regions with low-unstable transmission to meet future monitoring and evaluation needs.
While variation between the clusters was observed, the individual responses were correlated within clusters due to similarities in geographic and contextual charac-teristics. Estimates of intra-class correlation are invariant to scale and, therefore, subsequent estimates of sample sizes require estimates of associated uncertainty as con-ducted in this study. In general, these estimates have an important utility in interpreting the findings from recent surveys, thus, increasing our understanding of current
policy as seen in other health studies [19]. For example,
ICC has direct relevance to the disbursement of health interventions. Universal coverage for the entire at-risk
population [36] should be emphasized when there is a
relatively low degree of clustering [37, 38]. When the ICC
is large, a combination of universal and population-based targeting (e.g. households in the low income category or
high risk groups) in these settings may be beneficial [39].
In addition, ICC is useful in the planning of future sur-veys. While the size of survey (i.e., number of clusters) is constrained by funding, estimates of ICC may also inform decisions around which indicators are prioritized.
ICC decreases with increasing sample size (Fig. 1c) and
larger estimates of ICC amplify the design effect. The design effect is less comparable across countries because it is highly dependent on survey complexity. The design effect is also directly proportional to the average house-hold size and the sampling error, being larger in countries such as Uganda where household size in rural areas was 5.1 compared to 4.1 in urban areas and Nigeria (5.1 and 4.6 for urban and rural areas, respectively).
Estimates for fever were not restricted to children aged 0–4 years with a positive RDT test. Although the propor-tion (or prevalence) of malaria-related fever decreases
with declining transmission [40, 41], some fever cases are
still treated presumptively in many settings due to several logistical and operational challenges including the avail-ability of diagnostics, and patient or clinician behaviour
[42–44]. Consequently, without the use of
parasitologi-cal testing, fever cases are undistinguishable from other childhood infections such as respiratory tract infections
[45, 46]. In addition, limitations around individual
per-ception of fever, the possibility of multiple episodes of fever within the 14-day window, and recall bias remain
[47]. Thus, the current national cluster-sample surveys
may underestimate fever prevalence if multiple episodes with varying duration occur within the 14 days preced-ing the survey. In addition, there are possible limitations of not mimicking the practical realities of these surveys in the Bayesian modelling framework (including cost, and the quality of data collection during fieldwork or
non-sampling errors) [48, 49]. While budget plays a role
at sample selection stage in addition to other factors such as implementing agency, the aim was to investigate the optimal sample sizes independent of costs in vary-ing transmission intensity settvary-ings. The DHS survey, for example, requires a longer fieldwork period (> 6 months) due to the expansive nature of the questionnaire, which presents additional seasonal challenges compared to the MIS (maximum 4 months). Lastly, it is important to note that the objective of the study was not to examine sub-national or fine-scale spatial variation (spatial and tempo-ral heterogeneities) in clustering and prevalence of these indicators, nor to quantify the determinants or drivers of prevalence in the current survey data. Such analysis
is carried out as part of mapping studies [50–52], and in
studies on the role of environmental drivers in
quantify-ing risk [53–55]. Sub-national precision estimation could,
however, be explored by future surveys aiming for more localized survey designs. However, it will be beneficial to first evaluate the costs and benefits of such an adaptation.
Conclusion
Surveys are often used to provide timely information at a national level. In practice, however, there is usually a trade-off between providing high precision and resource availability at a national level. Firstly, this study highlights the importance of defining indicator-relevant sample sizes, and using biomarkers as reference sampling indi-cators to achieve the required precision in the current nationally representative surveys. Secondly, the study highlighted that obtaining valid and reliable high qual-ity data for monitoring biomarkers will require expand-ing current surveys especially in the context of declinexpand-ing
prevalence [56]. A major impediment to achieving this,
Authors’ contributions
VAA, AJT, RWS and AMN conceived and designed the study. VAA, JW, CB were responsible for data management and analysis. VAA produced the first draft of manuscript. All authors read and approved the final manuscript.
Author details
1 Geography and Environment, University of Southampton, Southampton,
UK. 2 Flowminder Foundation, Stockholm, Sweden. 3 Faculty of Science
and Technology, Lancaster University, Lancaster, UK. 4 School of Geography,
Archaeology and Palaeoecology, Queen’s University Belfast, Belfast BT7 1NN,
Northern Ireland, UK. 5 Population Health Theme, Kenya Medical Research
Institute-Wellcome Trust Research Programme, Nairobi, Kenya. 6 Centre
for Tropical Medicine and Global Health, Nuffield Department of Clinical
Medicine, University of Oxford, Oxford OX3 7LJ, UK. 7 World Health
Organiza-tion, Geneva, Switzerland. Acknowledgements
The authors thank Carla Pezzulo of Worldpop; Clara Burgert-Brucker, Ruilin Ren, and Mahmoud Elkasabi all of the Demographic and health surveys (DHS) Additional files
Additional file 1. An extended description of methodology on Bayesian
modelling.
Additional file 2: Table S1. Data on prevalence of fever indicator from
nationally representative household surveys (the demographic health sur-vey (DHS), the malaria indicator sursur-vey (MIS) and the HIV/AIDS and malaria indicator survey). Data represents 403,197 children aged 0-4 years in 5,839 clusters and includes surveys where all the three indicators were simulta-neously collected at the household level and in countries with more than two surveys. The mean, median and 95% credible intervals of the marginal posterior distribution from the Bayesian analysis is presented for measures of effectiveness: intra-class correlation coefficient (ICC), the estimated design effect (hdeff) and the effective sample size (ESS). The absolute bias is the difference in the means between the simple spatial random sample
and the Bayesian model estimate. ICC = Intra-class Correlation Coefficient,
ESS = Effective sample size; CrI Bayesian Credible Interval.
Additional file 3: Table S2. Data on the use of insecticide treated
bed nets (ITNs) from nationally representative household surveys (the demographic health survey (DHS), the malaria indicator survey (MIS) and the HIV/AIDS and malaria indicator survey). Data represents 403,197 children aged 0-4 years in 5,839 clusters and includes surveys where all the three indicators were simultaneously collected at the household level and in countries with more than two surveys. The mean, median and 95% credible intervals of the marginal posterior distribution from the Bayesian analysis is presented for measures of effectiveness: intra-class correlation coefficient (ICC), the estimated design effect (hdeff) and the effective sam-ple size (ESS). The absolute bias is the difference in the means between the simple spatial random sample and the Bayesian model estimate.
ICC = Intra-class Correlation Coefficient, ESS = Effective sample size; CrI
Bayesian Credible Interval.
Additional file 4: Table S3. Comparison of absolute bias data for Kenya
and Rwanda where the spatial random sample represented 20% (Sample 1), 30% (Sample 2) and 40% (Sample 3) hold out set of the clusters. Absolute bias is the difference between the mean from simple random sampling and that generated after MCMC 50,000 iteration in the different cluster-sample.
Additional file 5: Figure S1. Convergence diagnostic: Example of trace
plots extracted for malaria prevalence survey parameters in the 2010 Sen-egal DHS for the monitored parameters over the duration of model run.
Additional file 6: Figure S2. Country-level comparison between the
actual sample size and the estimated effective sample size (ESS) based on
the median form Bayesian modelling for a) malaria prevalence, b) fever
prevalence, and c) use of ITNs in children under the age of five years.
program, ICF, for their useful comments on the earlier draft version of the manuscript.
Competing interests
The authors declare that they have no competing interests. Availability of data and materials
Data used in the study are available in public domain from Measure DHS
Website http://dhsprogram.com/data/available-datasets.cfm.
Consent for publication Not applicable.
Ethics approval and consent to participate
For household surveys in the DHS or MIS, written informed consent is usually obtained from the head of the household. Additional consent was obtained from Ethics and Research Governance for secondary data analysis from the University of Southampton (Submission Number #25069).
Funding
Andrew J Tatem is supported by a Wellcome Trust Sustaining Health Grant (#106866/Z/15/Z) and Bill and Melinda Gates Foundation (#OPP1106427, 1032350, OPP1134076). Robert W Snow is supported by the Wellcome Trust as Principal Research Fellow (#103602). The funders had no role in study design, data collection and analysis, decision to publish, or preparation of the manuscript.
Publisher’s Note
Springer Nature remains neutral with regard to jurisdictional claims in pub-lished maps and institutional affiliations.
Received: 19 September 2017 Accepted: 16 November 2017
References
1. Boerma JT, Stansfield SK. Health statistics now: are we making the right investments? Lancet. 2007;369:779–86.
2. Murray CJL, Frenk J. Health metrics and evaluation: strengthening the science. Lancet. 2008;371:1191–9.
3. Hay SI, Battle KE, Pigott DM, Smith DL, Moyes CL, Bhatt S, et al. Global mapping of infectious disease. Philos Trans R Soc Lond B Biol Sci. 2013;368:20120250.
4. Lim SS, Allen K, Bhutta ZA, Dandona L, Forouzanfar MH, Fullman N, et al. Measuring the health-related Sustainable Development Goals in 188 countries: a baseline analysis from the Global Burden of Disease Study. Lancet. 2016;388:1813–50.
5. Chan M, Kazatchkine M, Lob-Levyt J, Obaid T, Schweizer J, Sidibe M, et al. Meeting the demand for results and accountability: a call for action on health data from eight global health agencies. PLoS Med. 2010;7:e1000223.
6. Tatem AJ, Smith DL, Gething PW, Kabaria CW, Snow RW, Hay SI. Ranking of elimination feasibility between malaria-endemic countries. Lancet. 2010;376:1579–91.
7. Corsi DJ, Neuman M, Finlay JE, Subramanian SV. Demographic and health surveys: a profile. Int J Epidemiol. 2012;41:1602–13.
8. Roll Back Malaria Monitoring and Evaluation Reference Group, WHO, United Nations Children’s Fund, MEASURE DHS, MEASURE Evaluation, and U.S. Centers for Disease Control and Prevention. Malaria Indicator Survey: Basic documentation for survey design and implementation. Calverton,
Maryland: MEASURE evaluation; 2005.
http://www.who.int/malaria/publi-cations/atoz/9241593571/en/. Accessed 15 Jun 2016.
9. United Nations Children Fund (UNICEF): Monitoring the situation of women and children: Multiple Indicator Cluster Survey manual 2005.
New York: UNICEF. 2006. http://mics.unicef.org/files?job=
10. MEASURE Evaluation, MEASURE DHS, President’s Malaria Initiative, Roll Back Malaria Partnership, UNICEF, WHO: Household survey indicators for
malaria control. Calverton, Marland: MEASURE Evaluation; 2013. http://
www.rollbackmalaria.org/files/files/resources/tool_HouseholdSurveyIndi-catorsForMalariaControl.pdf. Accessed 10 Jan 2017.
11. Tusting LS, Bottomley C, Gibson H, Kleinschmidt I, Tatem AJ, Lindsay SW, et al. Housing improvements and malaria risk in sub-Saharan Africa: a multi-country analysis of survey data. PLOS Med. 2017;14:e1002234. 12. Aliaga A, Ren R. Optimal sample sizes for two-stage cluster sampling in
demographic and health surveys. In DHS Working Papers No 30.
Calver-ton, Maryland, USA: ORC Macro. 2006. http://dhsprogram.com/pubs/pdf/
WP30/WP30.pdf. Accessed 15 Dec 2016.
13. Johnson JL, Kreidler SM, Catellier DJ, Murray DM, Muller KE, Glueck DH. Recommendations for choosing an analysis method which controls Type I error for unbalanced cluster sample designs with Gaussian outcomes. Stat Med. 2015;34:3531–45.
14. ICF International. Demographic and Health Survey Sampling and House-hold Listing Manual. Calverton, Maryland, U.S.A: ICF International. 2012. https://dhsprogram.com/pubs/pdf/DHSM4/DHS6_Sampling_Manual_ Sept2012_DHSM4.pdf. Accessed 29 Jan 2017.
15. Killip S, Mahfoud Z, Pearce K. What is an intracluster correlation coef-ficient? crucial concepts for primary care researchers. Ann Fam Med. 2004;2:204–8.
16. Resnicow K, Zhang N, Vaughan RD, Reddy SP, James S, Murray DM. When intraclass correlation coefficients go awry: a case study from a school-based smoking prevention study in South Africa. Am J Public Health. 2010;100:1714–8.
17. Murray DM, Katz ML, Post DM, Pennell ML, Young GS, Tatum CM, et al. Enhancing cancer screening in primary care: rationale, design, analysis plan, and recruitment results. Contemp Clin Trials. 2013;34:356–63. 18. Hade EM, Murray DM, Pennell ML, Rhoda D, Paskett ED, Champion VL,
et al. Intraclass correlation estimates for cancer screening outcomes: estimates and applications in the design of group-randomized cancer screening studies. J Natl Cancer Inst Monogr. 2010;2010:97–103. 19. Masood M, Reidpath DD. Intraclass correlation and design effect in BMI,
physical activity and diet: a cross-sectional study of 56 countries. BMJ Open. 2016;6:e008173.
20. Spiegelhalter DJ, Abrams KR, Myles JP. Cost-effectiveness, policy-making and regulation. In: Senn S, Hoboken BV editors. Bayesian approaches to clinical trials and health-care evaluation. John Wiley & Sons, Ltd; 2004. p. 305–47.
21. Spiegelhalter DJ, Abrams KR, Myles JP. Randomised controlled trials. In: Senn S, Hoboken BV editors. Bayesian approaches to clinical trials and health-care evaluation. Hoboken: John Wiley & Sons, Ltd; 2004. p. 181–249.
22. Spiegelhalter DJ, Abrams KR, Myles JP. An overview of the Bayesian approach. In: Senn S, Hoboken BV editors. Bayesian approaches to clinical trials and health-care evaluation. Hoboken: John Wiley & Sons, Ltd. 2004; p. 49–120.
23. Florey L. Measures of malaria parasitemia prevalence in national surveys: Agreement between rapid diagnostic tests and microscopy. In DHS Analytical Studies No 43. Rockville, Maryland, USA: ICF International. 2014. https://www.dhsprogram.com/pubs/pdf/AS43/AS43.pdf. Accessed 20 Mar 2017.
24. Gelfand AE, Adrian FMS. Sampling-based approaches to calculating marginal densities. J Am Stat Assoc. 1990;85:398–409.
25. Robert C, Casella G. A Short history of Markov Chain Monte Carlo: subjec-tive recollections from incomplete data. Stat Sci. 2011;1:102–15. 26. Plummer M. JAGS: A program for analysis of {Bayesian} graphical models
using {Gibbs} sampling. In: Proceedings of the 3rd international Work-shop on distributed statistical computing; Vienna, Austria. 2003. 27. R Core Team. R: a language and environment for statistical computing.
R Foundation for Statistical Computing. Vienna, Austria. 2014. https://
www.R-project.org/. Accessed 15 Feb 2017.
28. Gelman A, Rubin DB. Inference from iterative simulation using multiple sequences. Stat Sci. 1992;7:457–72.
29. Raftery AE, Lewis SM. Implementing MCMC. In: Gilks WR, Spiegelhalter DJ, Richardson S, editors. Markov Chain Monte Carlo in practice. London: Chapman and Hall; 1996. p. 115–30.
30. Murray DM, Stevens J, Hannan PJ, Catellier DJ, Schmitz KH, Dowda M, et al. School-level intraclass correlation for physical activity in sixth grade girls. Med Sci Sports Exerc. 2006;38:926–36.
31. Baldwin SA, Murray DM, Shadish WR, Pals SL, Holland JM, Abramowitz JS, et al. Intraclass correlation associated with therapists: estimates and applications in planning psychotherapy research. Cogn Behav Ther. 2011;40:15–33.
32. Division of Malaria Control, Kenya National Bureau of Statistics, National Coordinating Agency for Population Development. Kenya malaria indica-tor survey. Nairobi: Division of Malaria Control; 2007. p. 2009.
33. Boerma JT, Holt E, Black R. Measurement of biomarkers in surveys in develop-ing countries: opportunities and problems. Popul Dev Rev. 2001;27:303–14. 34. WHO. Policy recommendation on malaria diagnostics in low
transmis-sion settings. Geneva: World Health Organization; 2014. http://www.
who.int/malaria/publications/atoz/who-recommendation-diagnostics-low-transmission-settings-mar2014.pdf?ua=1. Accessed 15 Mar 2015. 35. WHO. From malaria control to malaria elimination: A manual for
elimina-tion scenario planning. Geneva: World Health Organizaelimina-tion; 2014. http://
apps.who.int/iris/bitstream/10665/112485/1/9789241507028_eng.pdf. Accessed 15 Mar 2015.
36. Willey BA, Paintain LS, Mangham L, Car J, Schellenberg JA. Strategies for delivering insecticide-treated nets at scale for malaria control: a system-atic review. Bull World Health Organ. 2012;90:672–84.
37. WHO. Global technical strategy for malaria 2016-2030. Geneva: World
Health Organization; 2015. http://www.who.int/malaria/areas/global_
technical_strategy/en/. Accessed 10 Aug 2016.
38. WHO. Achieving universal coverage with long-lasting insecticidal nets in
malaria control. Geneva: World Health Organization; 2014. http://www.
who.int/malaria/publications/atoz/who_recommendations_univer-sal_coverage_llins.pdf. Accessed 15 Jan 2016.
39. Noor AM, Alegana VA, Patil AP, Snow RW. Predicting the unmet need for biologically targeted coverage of insecticide-treated nets in Kenya. Am J Trop Med Hyg. 2010;83:854–60.
40. Trape J-F, Tall A, Sokhna C, Ly AB, Diagne N, Ndiath O, et al. The rise and fall of malaria in a West African rural community, Dielmo, Senegal, from 1990 to 2012: a 22-year longitudinal study. Lancet Infect Dis. 2014;14:476–88.
41. Malik EM, Eltahir HG, Ahmed ES. Clinical and laboratory aspects of malaria among children with fever in a low transmission area of Sudan. East Mediterr Health J. 2005;11:753–61.
42. Johansson EW, Gething PW, Hildenwall H, Mappin B, Petzold M, Peterson SS, et al. Diagnostic testing of pediatric fevers: meta-analysis of 13 national surveys assessing influences of malaria endemicity and source of care on test uptake for febrile children under five years. PLoS ONE. 2014;9:e95483.
43. Johansson EW, Gething PW, Hildenwall H, Mappin B, Petzold M, Peterson SS, et al. Effect of diagnostic testing on medicines used by febrile children less than five years in 12 malaria-endemic African countries: a mixed-methods study. Malar J. 2015;14:194.
44. Wasunna B, Okiro EA, Webster J, Todd J, Snow RW, Jones C. the impact of a community awareness strategy on caregiver treatment seeking behaviour and use of artemether-lumefantrine for febrile children in rural Kenya. PLoS ONE. 2015;10:e0130305.
45. Snow R. Sixty years trying to define the malaria burden in Africa: have we made any progress? BMC Med. 2014;12:227.
46. Asante KP, Owusu-Agyei S, Cairns M, Boamah E, Manu G, Twumasi M, et al. Non-malaria fevers in a high malaria endemic area of Ghana. BMC Infect Dis. 2016;16:327.
47. Feikin DR, Audi A, Olack B, Bigogo GM, Polyak C, Burke H, et al. Evalua-tion of the optimal recall period for disease symptoms in home-based morbidity surveillance in rural and urban Kenya. Int J Epidemiol. 2010;39:450–8.
48. Bostoen K, Bilukha OO, Fenn B, Morgan OW, Tam CC, ter Veen A, et al. Methods for health surveys in difficult settings: charting progress, mov-ing forward. Emerg Themes Epidemiol. 2007;4:13.
49. Carr-Hill R. Missing Millions and Measuring Development Progress. World Dev. 2013;46:30–44.
• We accept pre-submission inquiries
• Our selector tool helps you to find the most relevant journal • We provide round the clock customer support
• Convenient online submission • Thorough peer review
• Inclusion in PubMed and all major indexing services • Maximum visibility for your research
Submit your manuscript at www.biomedcentral.com/submit
Submit your next manuscript to BioMed Central
and we will help you at every step:
51. Giardina F, Kasasa S, Sié A, Utzinger J, Tanner M, Vounatsou P. Effects of vector-control interventions on changes in risk of malaria parasitaemia in sub-Saharan Africa: a spatial and temporal analysis. Lancet Glob Health. 2014;2:e601–15.
52. Kraemer MUG, Hay SI, Pigott DM, Smith DL, Wint GRW, Golding N. Pro-gress and challenges in infectious disease cartography. Trends Parasitol. 2015;32:19–29.
53. Clements ACA, Reid HL, Kelly GC, Hay SI. Further shrinking the malaria map: how can geospatial science help to achieve malaria elimination? Lancet Infect Dis. 2013;13:709–18.
54. Clements A, Barnett A, Cheng Z, Snow R, Zhou H. Space-time variation of malaria incidence in Yunnan province, China. Malar J. 2009;8:180. 55. Manh BH, Clements ACA, Thieu NQ, Hung NM, Hung LX, Hay SI, et al.
Social and environmental determinants of malaria in space and time in Viet Nam. Int J Parasitol. 2011;41:109–16.