R E S E A R C H
Open Access
MicroRNA-503 inhibits the G1/S transition by
downregulating cyclin D3 and E2F3 in
hepatocellular carcinoma
Fenqiang Xiao
1†, Wu zhang
2†, Liming Chen
2, Fei Chen
3, Haiyang Xie
1, Chunyang Xing
1, Xiaobo Yu
1,
Songming Ding
1, Kangjie Chen
2, Haijun Guo
1, Jun Cheng
2, Shusen Zheng
1,2and Lin Zhou
1,2*Abstract
Background:Increasing evidence indicates that deregulation of microRNAs (miRNAs) is involved in tumorigenesis. Downregulation of microRNA-503 has been observed in various types of diseases, including cancer. However, the biological function of miR-503 in hepatocellular carcinoma (HCC) is still largely unknown. In this study we aimed to elucidate the prognostic implications of miR-503 in HCC and its pathophysiologic role.
Methods:Quantitative reverse transcriptase polymerase chain reaction was used to evaluate miR-503 expression in HCC tissues and cell lines. Western blotting was performed to evaluate the expression of the miR-503 target genes. In vivo and in vitroassays were performed to evaluate the function of miR-503 in HCC. Luciferase reporter assay was employed to validate the miR-503 target genes.
Results:miR-503 was frequently downregulated in HCC cell lines and tissues. Low expression levels of miR-503 were associated with enhanced malignant potential such as portal vein tumor thrombi, histologic grade, TNM stage, AFP level and poor prognosis. Multivariate analysis indicated that miR-503 downregulation was significantly associated with worse overall survival of HCC patients. Functional studies showed miR-503 suppressed the proliferation of HCC cells by induction of G1 phase arrest through Rb-E2F signaling pathways, and thus may function as a tumor suppressor. Further investigation characterized two cell cycle-related molecules, cyclin D3 and E2F3, as the direct miR-503 targets.
Conclusion:Our data highlight an important role for miR-503 in cell cycle regulation and in the molecular etiology of HCC, and implicate the potential application of miR-503 in prognosis prediction and miRNA-based HCC therapy.
Keywords:Hepatocellular carcinoma, microRNA-503, Cyclin D3, E2F3, Overall survival, G1/S transition
Background
Hepatocellular carcinoma (HCC) is one of the most com-mon human malignancies and the leading cause of cancer-related death worldwide [1-3]. The development and progression of HCC is a multistage process involving the deregulation of genes that are crucial to cellular pro-cesses, such as cell cycle control, cell growth, apoptosis
and cell migration. Aberration of protein-coding genes has been demonstrated to play a critical role in the develop-ment of human cancers. Recently, an increasing number of reports have suggested that deregulation of non-coding genes, particularly microRNAs (miRNAs), is also closely associated with tumorigenesis [4,5].
miRNAs are a class of short, endogenous, non-coding RNAs known to negatively regulate the expression
of protein-coding genes through binding to the 3′
untranslated regions (3′ UTRs) of target genes [6,7].
One-third of protein-coding genes in humans are re-portedly regulated by miRNAs [8]. miRNAs are involved in the regulation of various biological processes, such as development [9], cell proliferation, apoptosis [10], and
* Correspondence:zhoulin99@zju.edu.cn †Equal contributors
1Key Laboratory of Combined Multi-organ Transplantation, Ministry of Public
Health; Key Laboratory of Organ Transplantation, Zhejiang Province, Hangzhou, Zhejiang, P.R. China
2
Division of Hepatobiliary and Pancreatic Surgery, First Affiliated Hospital, School of Medicine, Zhejiang University, Hangzhou, P.R. China Full list of author information is available at the end of the article
differentiation [11]. Additionally, deregulation of miRNAs has been observed in various types of human cancer [4,12-16]. Growing evidence indicates that miRNAs may function as oncogenes or tumor suppressor genes during tumor development and progression [5].
Study on miR-503 itself, a member of the miR-16 family, was seldom reported, especially in HCC, although there were some reports about the findings for the same miRNA family members. Liuet al. reported that the miR-16 family induces cell cycle arrest by downregulating the expression of CCND3, CCNE1 and CDK6 [17]. miR-195, another member of the miR-16 family ,suppressed G1/S transition of human HCC cells by targeting cyclin D1, CDK6, and E2F3 [18]. Lu et al. reported that miR-503 was significantly down-regulated in oral cancer cell lines compared with normal oral keratinocytes [19]. Zhou et al. reported that miR-503 induced a G1 arrest and inhibited proliferation in MHCCLM3 cells [20]. However, the specific signaling pathways regulated by miR-503 and the detailed mecha-nisms in tumorigenesis are still unknown.
Our study determined that downregulation of miR-503 occurred frequently in HCC tissues and cell lines. miR-503 downregulation was correlated with more aggressive disease as well as shorter overall survival, and was an inde-pendent prognostic factor. Additionally, ectopic expres-sion of miR-503 dramatically suppressed cell proliferation
and clonogenicity in vitro in HCC cells. Furthermore,
gain- and loss-of-function studies revealed that miR-503 could block the G1/S transition. Two cell cycle-related molecules, cyclin D3 and E2F3, were further characterized as the direct functional targets of miR-503. Collectively, these findings suggest miR-503 inhibits cell proliferation by cell cycle regulation through Rb-E2F signaling path-ways in HCC, providing a potential target for cancer therapy.
Materials and methods Cell lines and tissue specimens
Human embryonic kidney cells (HEK293T),immortal-ized liver cells (L02) and human HCC cell lines includ-ing HepG2, MHCCLM3, MHCC97H, MHCC97L, PLC, HuH7 and Bel-7402 were cultured in Dulbecco’s modi-fied Eagle’s medium with 10% fetal bovine serum at 37°C in a humidified atmosphere containing 5% CO2. Paired HCC and adjacent non-tumor liver tissues were col-lected from patients undergoing liver transplantation (LT) or partial hepatectomy at The First Affiliated Hospital, School of Medicine, Zhejiang University (Hangzhou, P.R. China). Written informed consent was obtained from each patient. A total of 125 patients had a clear histologic diagnosis of HCC with complete clini-copathological data, and all patients were closely followed up for survival analysis. None of the patients received radiotherapy or chemotherapy before surgery.
All patients received the same anti-cancer treatment after operation. All sample data were obtained from the clinical and pathologic records and are summarized in Additional file 1: Table S1.
Oligoribonucleotides
miR-503 mimic, miR-503 inhibitor and the respective control RNA (referred to as NC) were used for the tran-sient gain- and loss-of-function study. The small inter-fering RNA (siRNA) targeting human cyclin D3 (GenBank Access. No. NM_001136017) and E2F3 (NM_001949) transcripts were designated siCCND3 and siE2F3 respectively. The NC for miR-503 mimic, miR-503 inhibitor and siRNA was non-homologous to any human genome sequence. For the in vivo and in vitro tumorigenicity assay, all nucleotides with 2′-O-methyl modification were used. All the RNA oli-goribonucleotides (Additional file 2: Table S2) were purchased from Genepharma (Shanghai, China). All oligoribonucleotides used in this study are shown in Additional file 2: Table S2.
RNA extraction and quantitative reverse transcriptase polymerase chain reaction (qRT-PCR)
Total RNA from cell lines and clinical samples was iso-lated using the mirVana miRNA isolation kit (Ambion). Quantitative reverse transcriptase polymerase chain (qRT-PCR) was performed to evaluate the expression level of miR-503 in various cell lines and clinical samples and the expression of cyclin D3 and E2F3 in transfected cells. RNA was reverse transcribed using One Step PrimeScript miRNA cDNA Synthesis Kit (TaKaRa, Japan). The cDNA was then quantified by real-time RT-PCR using SYBR Premix Ex Taq (TaKaRa, Japan). All PCR reactions were performed using the ABI7500 sys-tem (Applied Biosyssys-tems, CA, USA). RNU6B or glyceral-dehyde 3-phosphate dehydrogenase (GAPDH) was used as an internal control, and miR-503 expression values were normalized to RNU6B. All primers used are listed in Additional file 2: Table S2.
Western blotting
Western blotting was used to detect the expression of tar-get genes at the protein level. Protein was extracted from transfected MHCCLM3 cells using modified RIPA buffer in the presence of proteinase inhibitor cocktail. Equivalent
quantities (30–50 μg) of protein were separated in 10%
antibody at 1:2000 dilution for 1 h. Bound secondary anti-body was detected using an enhanced chemiluminescence (ECL) system (Pierce Biotechnology Inc., Rockford, IL, USA). Primary antibodies were as follows: anti-E2F3 (Abcam), anti-cyclinD3, anti-Rb, anti-phospho-Ser780-Rb, anti-CDK4, anti-CDK6, anti-cyclin A, anti-cdc2, anti-p15,
anti-p16 (Cell Signaling Technology),
anti-phospho-Ser811-Rb, and anti-β-actin (Epitomics).
Cell transfection
The transfections were performed using Lipofectamine 2000 (Invitrogen) according to the manufacturer’s in-structions. In brief, MHCCLM3, HepG2, Bel-7402 or HEK293T cells were transfected with DNA, miRNA mimic, miRNA inhibitor, siRNA or respective NC. All RNA transfections were performed at a final concentra-tion of 50 nM. Cells were collected for assay 48 h after transfection. The transfection efficiency of the miR-503 mimic and inhibitor was confirmed by detection of miR-503 expression using qRT-PCR.
Cell proliferation assay
MHCCLM3, HepG2 and Bel-7402 cells seeded at a density of 4,000 per well into 96-well plates were transfected with miR-503 mimic, miR-503 inhibitor or respective NC. After incubating the cells for the speci-fied time (1, 2, 3 or 4 days), a cell proliferation assay was performed using Cell Counting Kit-8 (CCK-8) (Dojindo) according to the manufacturer’s instructions. The solu-tion absorbance was measured spectrophotometrically at 450 nm with MRX II absorbance reader (Dynex Tech-nologies, Chantilly, VA, USA). The experiments were performed in triplicate.
Analysis of clonogenicity in vitro and tumorigenicity in nude mice
Aliquots of viable MHCCLM3, HepG2 and Bel-7402 cells (1,000 per well) transfected with miR-503 mimic, miR-503 inhibitor or respective NC were placed in six-well plates 24 h after transfection and maintained in complete medium for 2 weeks. Colony formation was evaluated by staining the cells with 0.1% crystal violet. The rate of colony formation was calculated using the
following equation: colony formation rate =
(num-ber of colonies/num(num-ber of seeded cells) × 100%. The ex-periments were performed in triplicate.
Animal study was performed according to institutional ethical guidelines. Male BALB/c-nude mice aged 4 weeks were used for human tumor xenograft model (supplied by the Shanghai Experimental Animal Center, Chinese Academy of Sciences, Shanghai, China). Viable
miR-503-or NC-transfected MHCCLM3 cells (5×10⁶) were
suspended in 100 μl PBS and then injected
subcutane-ously into the posterior flank of nude mice, respectively.
Tumor growth was examined every week for 5 weeks. Tumor volume (V) was monitored by measuring the length (L) and width (W) with calipers and calculated with the formula (L × W2) × 0.5.
Cell cycle analysis by flow cytometry
Forty-eight hours after transfection, 1×10⁵MHCCLM3,
HepG2 and Bel-7402 cells transfected with miR-503 mimic, miR-503 inhibitor or respective NC were harvested, washed with PBS and fixed in 70% ethanol at 4°C overnight. Staining for DNA content was performed using a DNA Prep Stain (Beckman Coulter, Fullerton, CA, USA). Populations in G0/G1, S and G2/M phases were measured by BD LSRII Flow Cytometry System with FACSDiva software (BD Bioscience, Franklin Lakes, USA). Data were analyzed using the ModFit LT Soft-ware. The experiments were performed in triplicate.
Prediction of miR-503 targets
To predict the target genes and the 3′UTR binding sites bound by the seed region of miR-503, the TargetScan [8] (http://www.targetscan.org/), MiRanda [21] (http://www. microrna.org/microrna/home.do) and PicTar [22] (http:// pictar.mdc-berlin.de/) databases were used. Two cell cycle-related molecules, cyclin D3 and E2F3, were chosen as the direct miR-503 target candidates according to the three da-tabases and the role of miR-503 in cell cycle control.
Vector construction and luciferase reporter assay
The 3′UTR of cyclin D3 or E2F3 was amplified by PCR.
The amplified product was subcloned and ligated into the pmirGLO Dual-Luciferase miRNA Target Expression Vector (Promega). The recombinant reporter vector was identified by sequencing and termed the wild-type (Wt). To create the miR-503 binding site mutants, the binding
region of the seed sequence (5′ GCTGCT 3′) was
mu-tated to the sequence 5′ CGACGA 3′(mutated
nucleo-tides are in bold and underlined), using the QuikChange Lightning Site-Directed Mutagenesis Kit (Stratagene) according to the manufacturer’s protocol. The recombin-ant vector was confirmed by sequencing and termed the mutant type (Mut). 293T cells plated in a 24-well plate were co-transfected with 50 nM of either miR-503 mimic or NC and 100 ng of pmirGLO vector
compris-ing Wt or Mut 3′ UTR of cyclin D3 and E2F3 by
Lipofectamine 2000. Forty-eight hours after transfection, the relative luciferase activity was measured by Dual-Luciferase Reporter Assay System (Promega) according to the manufacturer’s instructions. All transfection ex-periments were performed in triplicate.
Statistical analysis
analyzed using Student’st-test, theχ2test and the log-rank test when two groups were compared. Overall survival rates were calculated actuarially according to the Kaplan–Meier method. Variables with a value of p < 0.05 in univariate analysis were used in a subsequent multivariate analysis based on the Cox proportional hazards model. All tests performed were two-sided. A value ofp< 0.05 was consid-ered to indicate statistical significance.
Results
The expression profile of miR-503 in HCC cell lines and tissues and the clinicopathologic significance of miR-503 expression in HCC
To investigate the expression pattern of miR-503 in HCC, we detected the expression of miR-503 in 125 paired HCC and adjacent noncancerous liver tissues by real-time qRT-PCR. Compared with their adjacent non-tumor tissues, significant downregulation of miR-503 was observed in HCC tissues (Figure 1A). Furthermore, the expression of miR-503 was noticeably reduced in five of seven (71.4%) HCC cell lines examined compared with normal liver cell line L02 (Figure 1B). These results suggest that reduced miR-503 expression is a frequent event in human HCC and may be involved in tumorigenesis.
We further evaluated the clinicopathologic significance of miR-503 expression in HCC. In this study, patients with expression values less than the average level of miR-503 in HCC tissues (1.75, normalized to RNU6B) were assigned to the low expression group (n=74) whereas patients with values above the average were assigned to the high expres-sion group (n=51). Patients in the low miR-503 expresexpres-sion group had a shorter overall survival than patients in the high miR-503 expression group (p= 0.001; Figure 2). Cor-relation analysis between clinicopathologic factors and miR-503 expression showed that the low miR-503 expres-sion group had later TNM stage (p= 0.012), greater AFP
levels (p = 0.015) and PVTT (p = 0.029) than the high
miR-503 expression group (Additional file 1: Table S1). In addition, histologic grade in the low miR-503 expression group was poorer than in the high miR-503 expression
group (p = 0.019). However, no significant differences
were observed according to age, sex, HBV, cirrhosis, tumor size and tumor number (Additional file 1: Table S1). The results of univariate and multivariate Cox propor-tional hazards regression analyses for overall survival are shown in Table 1. Multivariate analysis further confirmed that a high miR-503 expression level was an independent and significant prognostic factor for survival (HR, 2.461; CI, 1.106-4.623;p= 0.005; Table 1).
The effect of miR-503 on cell proliferation, clonogenicity and cell cycle
[image:4.595.306.539.89.392.2]The frequent downregulation of miR-503 in HCC cell lines and tissues suggests that miR-503 may serve as a
Figure 1Expression pattern of miR-503 in HCC cell lines and tissues. (A)lower expression level of miR-503 was detected in tumors than in adjacent nontumorous tissues in 125 HCC patients.
(B)relative expression levels of miR-503 in the indicated HCC cell lines (*P<0.05, **P<0.01, ***P<0.001).
[image:4.595.305.539.462.684.2]tumor suppressor gene (TSG) in HCC. To test the poten-tial tumor suppressor role of miR-503 in HCC, the effect of ectopic miR-503 on cell growth was evaluated in MHCCLM3, HepG2 and Bel-7402 cells transfected with miR-503 mimic, miR-503 inhibitor or respective NC using the CCK-8 cell viability assay. Transfection efficiency of ectopic miR-503 mimic and inhibitor was confirmed by qRT-PCR. The expression of miR-503 was increased 50-folds (MHCCLM3) and 45-50-folds (HepG2) in cells transfected with 50 nM miR-503 mimic but deceased 40-fold (Bel-7402) in cells transfected with 50 nM miR-503 inhibitor (Figure 3A). At day 1, the OD values of miR-503 mimic, miR-503 inhibitor and respective NC control cells were not significantly different in MHCCLM3, HepG2 or Bel-7402 cells. However, from day 3 onwards, the OD values of MHCCLM3 and HepG2 cells transfected with miR-503 mimic were significantly lower than control cells, but the OD values of Bel-7402 cells transfected with miR-503 inhibitor were significantly higher than control cells (Figure 3B). These data indicate that miR-503 inhibited cell proliferationin vitro.
To further investigate the potential role of miR-503 in tumorigenesis, the colony formation assay was performed in MHCCLM3, HepG2 and Bel-7402 cells. Cells were
transfected with miR-503 mimic, miR-503 inhibitor or re-spective NC, and then allowed to grow to a very low dens-ity. MHCCLM3 and HepG2 cells transfected with 50 nM miR-503 mimic displayed much fewer and smaller col-onies compared with NC duplex transfected cells, but Bel-7402 cells transfected with 50 nM miR-503 inhibitor displayed much more and larger colonies (Figure 3C). These data suggest a growth-inhibitory role of miR-503.
To further confirm the above findings, an in vivo mouse model was used. For the duration of the treat-ment with miR-503 mimic for 5 weeks, tumor volume curves revealed a significant decrease in growth rates at the third, fourth and fifth week after treatment with miR-503 mimic (Figure 4A). Taken together, these re-sults showed that miR-503 inhibits HCC cell growth in vivo and in vitro.
To explore the mechanisms underlying miR-503-suppressed tumor growth, the effect of miR-503 on cell cycle progres-sion was investigated by flow cytometry. The assay showed that the percentages of miR-503 mimic transfected MHCCLM3 and HepG2 cells in the G0–G1 phase were significantly higher than that of NC duplex transfected cells, which paralleled with a significant decrease in the S phase (Figure 4B). Additionally, in miR-503 inhibitor transfected Bel-7402 cells, the percentages of cells in the G0–G1 phase were remarkably lower than that of NC transfected cells, which paralleled with a significant in-crease in the S phase (Figure 4B). These results indicate miR-503 could inhibit HCC cell proliferation by induction of cell cycle arrest at G1/S phase.
Cyclin D3 and E2F3 are direct functional targets of miR-503
To further elucidate the molecular mechanism by which miR-503 inhibits the G1/S transition, miRNA target pre-diction databases, such as TargetScan, miRanda, and PicTar, were employed to predict miR-503 targets. We searched for positive regulators of the G1/S transition among the predicted targets of miR-503. Two cell cycle-related genes, cyclin D3 and E2F3, which are crucial com-ponents that initiate the inactivation of the Rb pathway and in turn the G1/S transition, were considered as candi-dates. A single putative miR-503-binding site was mapped
in each 3′ UTR of cyclin-D3 and E2F3 (Figure 5A). To
validate whether these genes were direct targets of miR-503, a dual-luciferase reporter system was first employed. PmirGLO Dual-Luciferase miRNA Target Expression
Vec-tor containing wild-type or mutant 3′UTR of the target
[image:5.595.57.290.111.376.2]genes was co-transfected with either NC or miR-503 mimic. Ectopic expression of miR-503 inhibited firefly lu-ciferase activity of the reporter gene with the Wt 3′UTR but not the Mut reporter gene (Figure 5B), suggesting that miR-503 represses gene expression through its binding se-quences at the 3′UTR of cyclin D3 and E2F3.
Table 1 Univariate and multivariate analysis for overall survival
Clinical variables HR (95% CI) P-value
Univariate analysis
Age 1.021(0.823-1.346) 0.886
Sex 0.953(0.545-1.875) 0.754
HBV 1.067(0.513-2.184) 0.864
Cirrhosis 1.652(0.738-3.678) 0.237 Tumor size 1.542(1.136-2.246) 0.087 Tumor number 2.421(1.546-4.439) 0.246 TNM stage 2.876(1.873-4.786) 0.002 Histology grade 1.724(1.120-2.863) 0.027
PVTT 3.539(2.238-7.731) 0.017
AFP 2.535(1.347-5.042) 0.027
miR-503 expression 2.942(1.857-4.974) 0.001 Multivariate analysis
TNM stage 2.054(1.573-4.853) 0.015 Histology grade 1.431(0.690-2.968) 0.336
PVTT 0.549(0.242-1.246) 0.152
AFP 1.147(0.575-2.288) 0.697
miR-503 expression 2.461(1.106-4.623) 0.005
In addition, the effect of miR-503 on endogenous ex-pressions of cyclin D3 and E2F3 was assessed by Western blotting. Transfection of miR-503 induced downregulation of cyclin D3 and E2F3 at the protein level in MHCCLM3
[image:6.595.56.540.87.606.2]cells (Figure 5D) and miR-503 inhibitor significantly up-regulated the expression of cyclin D3 and E2F3 at the pro-tein level in Bel-7402 cells (Figure 5E). However, miR-503 overexpression did not significantly reduce cyclin D3 or
E2F3 mRNA levels (Figure 5C), which indicated that miR-503 inhibits the expression of cyclin D3 and E2F3 through translational repression.
Collectively, these data indicate that miR-503 may negatively regulate the expression of cyclin D3 and E2F3 by directly targeting their 3′UTRs.
miR-503 was involved in cell cycle regulation through Rb-E2F signaling
To explore the role of cyclin D3 and E2F3 in miR-503-regulated G1/S transition, we investigated whether knock-down of these genes may phenocopy the effect of miR-503 overexpression. MHCCLM3 cells were transfected with siRNA duplex targeting either cyclin D3 or E2F3, which resulted in a significant reduction of the respective genes’ protein levels (Figure 5F). The silencing of either target gene led to G1-phase arrest (Figure 5G), phenocopying the outcome of miR-503 overexpression. Interestingly, compared with miR-503 overexpression, inhibition of cyc-lin D3 or E2F3 alone caused a less marked G1 arrest, im-plying that miR-503 may block the G1/S transition by synergistically targeting multiple targets.
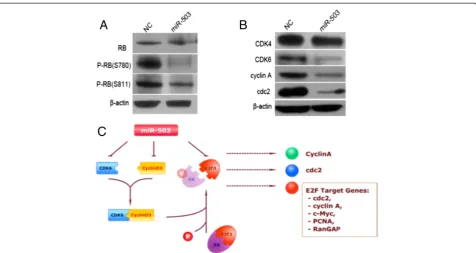
Cyclin D3 and CDK6 are crucial molecules that initiate the phosphorylation of retinoblastoma (Rb), which results in the release of E2F and subsequently the transactivation of genes required for S-phase entry. Therefore, we investigated
whether miR-503 could attenuate these events. Ectopic ex-pression of miR-503 caused a reduction of phosphorylated Rb protein, although little effect on the total Rb protein was found (Figure 6A). Moreover, the effect of miR-503 on endogenous genes such as CDK4, CDK6, p15 and p16, was further investigated. Overexpression of miR-503 in-duced significant downregulation of CDK6; however, little effect on endogenous expression of p15, p16 or CDK4 was observed (Figure 6B). Furthermore, the protein levels of E2F downstream targets, including cdc2 and cyclin A genes, were significantly lower in miR-503-transfected MHCCLM3 cells than in NC transfectants (Figure 6B).
These data suggest that miR-503 may inhibit the G1/S transition by directly suppressing both cyclin D3 and E2F3 through Rb-E2F signaling pathways (Figure 6C).
Discussion
Accumulating evidence has revealed that deregulation of cell cycle control is an essential step in carcinogenesis [23,24]. Recent studies have indicated that miRNAs are involved in tumorigenesis through the regulation of the
cell cycle. Wang et al. reported miR-138 induces cell
[image:7.595.59.538.89.360.2]cycle arrest by targeting cyclin D3 in HCC [25]. There-fore, deregulation of cell cycle-related miRNAs may fa-cilitate tumorigenesis. Deregulation of miR-503 has been identified in various disease types, including cancers
[19,26-31]. Caporali et al. reported that overexpression of miR-503 inhibited endothelial cell proliferation and migration by targeting CCNE1 and cdc25A [26]. Ectopic miR-503 expression induced G1 arrest by directly targeting cell-cycle regulators in acute myeloid leukemia [27]. Reportedly, miR-503 suppressed the endogenous CCND1 both at protein and mRNA levels by binding to
the 3′ UTR of the CCND1 gene and inhibited cell
growth by reducing S-phase cell populations in human
head and neck carcinomas [28]. miR-503 induced G1 ar-rest by downregulating cdc25A in heterologous cancer cells [30]. However, the molecular mechanisms by which miR-503 modulates cell cycle control in HCC are still largely unknown.
[image:8.595.58.539.87.502.2]Our findings showed that miR-503 downregulation was a frequent event in human HCC tissues. However, miR-503 was highly expressed in retinoblastoma [31]; this discrepancy may be due to use of different cell lines.
Figure 5Cyclin D3 and E2F3 are direct targets of miR-503. (A)the putative miR-503 binding sequence in the 3′UTR of Cyclin D3 and E2F3 mRNA. Mutation was generated on the Cyclin D3 and E2F3 3′UTR sequence in the complementary site for the seed region of miR-503.(B)
Analysis of luciferase activity. 293 T cells were cotransfected with 50 nM of either miR-503 or NC and 100 ng pmirGLO Vector containing Wt or Mut 3′UTR of Cyclin D3 or E2F3 (indicated as WT or MUT on the X axis). The relative firefly luciferase activity normalized with renilla luciferase was measured 48 h after transfection.(C)the effect of miR-503 on the expression of endogenous Cyclin D3 and E2F3 at mRNA levels.(DandE)
Endogenous Cyclin D3 or E2F3 protein levels are down-regulated in LM3 cells transfected with miR-503 mimics and up-regulated in Bel-7402 cells transfected with the miR-503 inhibitor(F)the effect of siRNA on the expression of endogenous Cyclin D3 and E2F3 at protein level.(G)
Gain- and loss-of-function studies indicated overexpre-ssion of miR-503 could suppress cell proliferation and colony formation and induce cell cycle arrest in HCC. We propose that reduced expression of miR-503 may disrupt cell cycle control, subsequently promote cell proliferation, and consequently facilitate the develop-ment and progression of HCC. These results suggest the important role of miR-503 in HCC tumorigenesis.
A family of the CDKs and their activating partners (cyclins) are involved in regulation of the cell cycle. The G1/S phase transition is regulated primarily by D-type cyclins (D1, D2 or D3) in complex with CDK4/CDK6. These complexes cooperate in phosphorylating proteins of the Rb family and leading to release of E2F transcrip-tion factors, thus activating E2F-mediated transcriptranscrip-tion and driving cells from G1 into S phase. The Rb pathway is known to act as a key checkpoint in cell cycle pro-gression. Our results showing that miR-503 targets mol-ecules both upstream (cyclin D3) and downstream (E2F3) of Rb, an archetypal tumor suppressor, provide new insight into tumorigenesis. Further investigations revealed that miR-503 significantly inhibits the expres-sion of CDK6 at the protein level. Whether miR-503 directly suppresses CDK6 expression requires further study. Collectively, our data suggest miR-503 is involved in the cell cycle regulation through Rb-E2F signaling in HCC.
The underlying mechanism responsible for the de-creased expression of miR-503 in HCC remains unclear. More than half of the annotated human miRNA genes are located in fragile sites in genomic regions that are frequently amplified, deleted, or rearranged in human cancers [32], providing plausible mechanisms of reduced miR-503 expression. In addition, promoter hyperme-thylation or transcriptional regulation might account at least in part for the reduced miR-503 expression in HCC. Further investigation is required to verify this hypothesis.
In summary, our data suggest that miR-503 functions as a powerful tumor suppressor and could be an inde-pendent prognostic marker in HCC patients. Moreover, the frequently downregulated miR-503 can inhibit the G1/S phase transition by directly targeting cyclin D3 and E2F3 through Rb-E2F signaling pathways. Therefore, miR-503 may serve as a useful therapeutic target for an miRNA-based HCC therapy.
Additional files
Additional file 1: Table S1.Correlation between the expression level of miR-503 and clinicopathological parameters.
[image:9.595.60.537.87.340.2]Additional file 2: Table S2.List of the oligonucleotides used in this study.
Competing interests
All authors declared that they have no competing interest.
Authors’contributions
LZ and SSZ contributed to the conception and design of the study. FQX and WZ performed the experimental work. FC and HYX interpreted the data and helped to draft the manuscript. LMC participated in the design of the study. HJG and JC performed the statistical analysis. CYX, XBY, SMD and KJC participated in the experiments. All the authors contributed to drafting and reviewing the manuscript, and all authors read and approved the final manuscript.
Acknowledgments
We thank Jilei Fu for the collection of clinical data, and Rong Su for her excellent technical assistance. This work was supported by the following grants and foundations: National S &T Major Project (2012zx10002-017); NSFC for Innovative Research Group (81121002); the National Natural Science Foundation of China (81201944); Zhejiang Provincial Natural Science Foundation (LQ12H03003).
Author details
1
Key Laboratory of Combined Multi-organ Transplantation, Ministry of Public Health; Key Laboratory of Organ Transplantation, Zhejiang Province, Hangzhou, Zhejiang, P.R. China.2Division of Hepatobiliary and Pancreatic Surgery, First Affiliated Hospital, School of Medicine, Zhejiang University, Hangzhou, P.R. China.3Institution of Cardiology, The First Affiliated Hospital, School of Medicine, Zhejiang University, Hangzhou, P.R. China.
Received: 13 May 2013 Accepted: 21 August 2013 Published: 22 August 2013
References
1. Parkin DM, Bray F, Ferlay J, Pisani P:Global cancer statistics, 2002.
CA Cancer J Clin2005,55:74–108.
2. Aravalli RN, Steer CJ, Cressman EN:Molecular mechanisms of hepatocellular carcinoma.Hepatology2008,48:2047–2063.
3. El-Serag HB, Rudolph KL:Hepatocellular carcinoma: epidemiology and molecular carcinogenesis.Gastroenterology2007,132:2557–2576. 4. Calin GA, Croce CM:MicroRNA signatures in human cancers.Nat Rev
Cancer2006,6:857–866.
5. Esquela-Kerscher A, Slack FJ:Oncomirs - microRNAs with a role in cancer.
Nat Rev Cancer2006,6:259–269.
6. Ambros V:The functions of animal microRNAs.Nature2004,431:350–355. 7. Bartel DP:MicroRNAs: genomics, biogenesis, mechanism, and function.
Cell2004,116:281–297.
8. Lewis BP, Burge CB, Bartel DP:Conserved seed pairing, often flanked by adenosines, indicates that thousands of human genes are microRNA targets.Cell2005,120:15–20.
9. Schratt GM, Tuebing F, Nigh EA, Kane CG, Sabatini ME, Kiebler M, Greenberg ME:A brain-specific microRNA regulates dendritic spine development.
Nature2006,439:283–289.
10. Brennecke J, Hipfner DR, Stark A, Russell RB, Cohen SM:Bantam encodes a developmentally regulated microRNA that controls cell proliferation and regulates the proapoptotic gene hid in Drosophila.Cell2003,113:25–36. 11. Chen CZ, Li L, Lodish HF, Bartel DP:MicroRNAs modulate hematopoietic
lineage differentiation.Science2004,303:83–86.
12. Su H, Yang JR, Xu T, Huang J, Xu L, Yuan Y, Zhuang SM:MicroRNA-101, down-regulated in hepatocellular carcinoma, promotes apoptosis and suppresses tumorigenicity.Cancer Res2009,69:1135–1142.
13. Lu J, Getz G, Miska EA, Alvarez-Saavedra E, Lamb J, Peck D, Sweet-Cordero A, Ebert BL, Mak RH, Ferrando AA,et al:MicroRNA expression profiles classify human cancers.Nature2005,435:834–838.
14. Yanaihara N, Caplen N, Bowman E, Seike M, Kumamoto K, Yi M, Stephens RM, Okamoto A, Yokota J, Tanaka T,et al:Unique microRNA molecular profiles in lung cancer diagnosis and prognosis.Cancer Cell2006,9:189–198. 15. Iorio MV, Visone R, Di Leva G, Donati V, Petrocca F, Casalini P, Taccioli C,
Volinia S, Liu CG, Alder H,et al:MicroRNA signatures in human ovarian cancer.Cancer Res2007,67:8699–8707.
16. Murakami Y, Yasuda T, Saigo K, Urashima T, Toyoda H, Okanoue T, Shimotohno K:Comprehensive analysis of microRNA expression patterns
in hepatocellular carcinoma and non-tumorous tissues.Oncogene2006,
25:2537–2545.
17. Liu Q, Fu H, Sun F, Zhang H, Tie Y, Zhu J, Xing R, Sun Z, Zheng X:miR-16 family induces cell cycle arrest by regulating multiple cell cycle genes.
Nucleic Acids Res2008,36:5391–5404.
18. Xu T, Zhu Y, Xiong Y, Ge YY, Yun JP, Zhuang SM:MicroRNA-195 suppresses tumorigenicity and regulates G1/S transition of human hepatocellular carcinoma cells.Hepatology2009,50:113–121.
19. Lu YC, Chen YJ, Wang HM, Tsai CY, Chen WH, Huang YC, Fan KH, Tsai CN, Huang SF, Kang CJ,et al:Oncogenic function and early detection potential of miRNA-10b in oral cancer as identified by microRNA profiling.Cancer Prev Res (Phila)2012,5:665–674.
20. Zhou J, Wang W:Analysis of microRNA expression profiling identifies microRNA-503 regulates metastatic function in hepatocellular cancer cell.J Surg Oncol2011,104:278–283.
21. Betel D, Wilson M, Gabow A, Marks DS, Sander C:The microRNA.org resource: targets and expression.Nucleic Acids Res2008,36:D149–153. 22. Krek A, Grun D, Poy MN, Wolf R, Rosenberg L, Epstein EJ, MacMenamin P,
da Piedade I, Gunsalus KC, Stoffel M, Rajewsky N:Combinatorial microRNA target predictions.Nat Genet2005,37:495–500.
23. Deshpande A, Sicinski P, Hinds PW:Cyclins and cdks in development and cancer: a perspective.Oncogene2005,24:2909–2915.
24. Massague J:G1 cell-cycle control and cancer.Nature2004,432:298–306. 25. Wang W, Zhao LJ, Tan YX, Ren H, Qi ZT:MiR-138 induces cell cycle arrest
by targeting cyclin D3 in hepatocellular carcinoma.Carcinogenesis2012,
33:1113–1120.
26. Caporali A, Meloni M, Vollenkle C, Bonci D, Sala-Newby GB, Addis R, Spinetti G, Losa S, Masson R, Baker AH,et al:Deregulation of microRNA-503 contributes to diabetes mellitus-induced impairment of endothelial function and reparative angiogenesis after limb ischemia.Circulation 2011,123:282–291.
27. Forrest AR, Kanamori-Katayama M, Tomaru Y, Lassmann T, Ninomiya N, Takahashi Y, de Hoon MJ, Kubosaki A, Kaiho A, Suzuki M,et al:Induction of microRNAs, mir-155, mir-222, mir-424 and mir-503, promotes monocytic differentiation through combinatorial regulation.Leukemia2010,24:460–466. 28. Jiang Q, Feng MG, Mo YY:Systematic validation of predicted microRNAs
for cyclin D1.BMC Cancer2009,9:194.
29. Roy P, Bhattacharya G, Lahiri A, Dasgupta UB, Banerjee D, Chandra S, Das M:
hsa-miR-503 is downregulated in beta thalassemia major.Acta Haematol 2012,128:187–189.
30. Sarkar S, Dey BK, Dutta A:MiR-322/424 and−503 are induced during muscle differentiation and promote cell cycle quiescence and differentiation by down-regulation of Cdc25A.Mol Biol Cell2010,
21:2138–2149.
31. Zhao JJ, Yang J, Lin J, Yao N, Zhu Y, Zheng J, Xu J, Cheng JQ, Lin JY, Ma X:
Identification of miRNAs associated with tumorigenesis of retinoblastoma by miRNA microarray analysis.Childs Nerv Syst2009,
25:13–20.
32. Calin GA, Sevignani C, Dumitru CD, Hyslop T, Noch E, Yendamuri S, Shimizu M, Rattan S, Bullrich F, Negrini M, Croce CM:Human microRNA genes are frequently located at fragile sites and genomic regions involved in cancers.Proc Natl Acad Sci USA2004,101:2999–3004.
doi:10.1186/1479-5876-11-195
Cite this article as:Xiaoet al.:MicroRNA-503 inhibits the G1/S transition by downregulating cyclin D3 and E2F3 in hepatocellular carcinoma.