DISTRIBUTED STATIC COMPENSATOR (DSTATCOM) FOR
VOLTAGE SUPPORT IN SINGLE WIRE EARTH
RETURN (SWER) NETWORKS
A Thesis submitted by
Seyed Javad Mirazimiabarghouei, M Eng
For the award of
Doctor of Philosophy
i
Abstract
This investigation is concerned with the effectiveness of Distributed STATic COMpensators (DSTATCOMs) at providing voltage support in Single Wire Earth Return (SWER) networks. The reason for the focus on SWER lines is the high cost of upgrading them in the traditional way to solve voltage regulation problems that result from load growth in some of the feeders. A number of aspects of DSTATCOM installation and operation have been explored. These include their location, reactive power circulation, reactive power prioritising, four quadrant operation and the timing of installation and operation.
It has been possible to derive analytical expressions only for the case of a single Thevenin source equivalent and a single load in parallel with a DSTATCOM. From one of those expressions it was deduced that, on a voltage increment per kVAr basis, DSTATCOMs are most effective as voltage regulators when they are installed at the customer terminals rather than further upstream into the network. This result has been found to apply generally to all practical SWER lines. Another derived expression predicted a peak value of customer terminal voltage when active power (P) and reactive power (Q) are injected by the DSTATCOM at constant kVA (S). This maximum voltage represents a stability limit for the case where DSTATCOMs are controlled to operate at constant kVA. Load flow studies revealed that in general this stability limit exists for all practical SWER lines.
ii
iii
Certification of Thesis
This thesis is entirely the work of Seyed Javad Mirazimiabarghouei except where otherwise acknowledged. The work is original and has not previously been submitted for any other award, except where acknowledged.
Principal Supervisor: Assoc Prof Tony Ahfock
Associate Supervisor: Dr Les Bowtell
iv
Acknowledgments
I wish to convey my most sincere thanks to my supervisor Associate Professor Tony Ahfock for his help throughout this project. He has provided excellent supervision, skilful guidance and tactful mentoring from the inception of this project right through to the compilation of this thesis. He has made this a rewarding although sometimes challenging experience for which I am sincerely grateful to have had such a gifted and fervent mentor.
I wish also to thank Dr Les Bowtell as my associate supervisor for his assistance and his kind words of encouragement. I would also like to express my gratitude to Dr Andreas Helwig as a USQ lecturer for all his advices and consultations and Mrs Shelley Bowtell for the thesis proofreading.
v
Table of Contents
Abstract i
Certification of Thesis iii
Acknowledgments iv
List of Figures ix
List of Tables xv
Abbreviations xvii
Nomenclature xx
Publications xxii
CHAPTER
1 INTRODUCTION 1
1.1 Background 1
1.2 Research Objectives 2
1.3 Thesis Outline 3
2 LITERATURE REVIEW 5
2.1 Introduction 5
2.2 SWER Line Characteristics 5
2.2.1 SWER History 5
2.2.2 Isolating Transformer 7
2.2.3 Conductors 10
2.2.4 Loads and Customers 11
2.2.5 SWER Advantages 12
2.3 SWER Issues 12
2.3.1 Load Growth 12
2.3.2 Ferranti Effect 13
2.3.3 Voltage Regulation 14
2.4 Voltage Regulation Options 15
2.4.1 Load Tap Changer (LTC) 15
2.4.2 Series/Shunt Capacitors 16
2.4.3 Fixed/Switched Shunt Reactors 17
vi
2.4.5 Voltage Regulator 18
2.4.6 FACTS Devices 19
2.4.7 STATic COMpensator (STATCOM) 21
2.5 DSTATCOM Placement 23
2.5.1 Network Side Injection 23
2.5.2 Customer Side Injection 27
2.6 Load Sharing Control Methods 28
2.6.1 Droop Based Control Method 28
2.6.2 Modified Droop Control Method 29
2.7 Summary 31
3 DSTATCOM PLACEMENT AND OPERATING POINT IN
SWER SYSTEM 33
3.1 Introduction 33
3.2 Long SWER Line Voltage Support 33
3.2.1 Single Line Diagram of a Four Bus SWER System 34
3.2.2 Phasor Diagram 34
3.3 Placement of Voltage Support Equipment 35
3.3.1 Network Side Voltage Support 36
3.3.2 Customer Side Voltage Support 37
3.3.3 Comparison of Two Voltage Support Schemes 38
3.4 Four Quadrant DSTATCOM 39
3.5 SWER System Voltage Analysis 40
3.5.1 Single Line Diagram of Two Bus SWER System 40
3.5.2 Voltage Drop Analysis 40
3.6 DSTATCOM Operating Point Analysis 45
3.6.1 Operation Point Angle 45
3.6.2 Voltage Sensitivity 50
3.6.3 Load Flow Study 52
3.6.4 Q-Priority 53
3.7 Case Study 54
3.7.1 Simple Four Bus SWER System 54
3.7.2 Richmond SWER Line 67
vii
4 Q_ONLY DSTATCOM OPERATING MODE 82
4.1 Introduction 82
4.2 DSTATCOM Q-only Mode Operation 82
4.3 Droop Characteristics 83
4.3.1 Droop Control Techniques 83
4.3.2 Droop Implementation in Load Flow Study 85
4.3.3 Modified Jacobian Matrix Elements 85
4.4 Modified Droop Characteristics 89
4.4.1 VAr Circulation 89
4.4.2 Hysteresis Control Loop for Q-only Mode 90 4.5 Modified Droop Characteristics Including Hysteresis Control Loop 92
4.5.1 DSTATCOM Q-only Mode Flowchart 93
4.6 Case study 93
4.6.1 Load Growth 93
4.6.2 Results and Discussions 94
4.7 Conclusions 108
5 Q_PRIORITY DSTATCOM OPERATING MODE 110
5.1 Introduction 110
5.2 DSTATCOM Q-Priority Mode Operation 110
5.3 Droop Characteristics 112
5.3.1 DSTATCOM Reactive Power-Voltage Droop 112 5.3.2 DSTATCOM Active Power-Voltage Droop 112 5.3.3 Load Flow Study Droop Implementation 113
5.3.4 Modified Jacobian Matrix Elements 113
5.4 Modified Droop Characteristics 117
5.4.1 Hysteresis Control Loops for Q-priority Mode 117 5.4.2 DSTATCOM Q-Priority Mode Flowchart 118
5.5 Case Study 121
5.6 Results and Discussions 121
viii
6 LOAD POWER FACTOR FOLLOW AND CORRECTION
DSTATCOM OPERATING MODES 136
6.1 Introduction 136
6.2 DSTATCOM Load PF Follow Mode Operation 137
6.3 Droop Characteristics 138
6.3.1 DSTATCOM Active Power -Voltage Droop 139 6.3.2 DSTATCOM Reactive Power-Voltage Droop 140 6.3.3 Load Flow Study with Droop Implementation 141
6.3.4 Modified Jacobian Matrix Elements 141
6.4 Hysteresis Control Loop for Load Flow PF Follow Mode 144 6.5 DSTATCOM Load Flow PF Follow Mode Flowchart 145
6.6 Hysteresis Control Loop for Load Flow PF Correction Mode 145
6.7 Case Study 148
6.7.1 Load PF Follow Mode Results 148
6.7.2 Load PF Correction Mode Results 152
6.8 Conclusions 163
7 DISCUSSION AND CONCLUSIONS 164
7.1 Research Outcomes 164
7.1.1 DSTATCOM Location 164
7.1.2 VAr Circulation Avoidance 165
7.1.3 Q Priority 166
7.1.4 The Possibility of Unwanted Islanding 167 7.1.5 Timing of DSTATCOM Installation and Operation 168
7.2 Further Work 169
8 REFERENCES 171
9 APPENDIX A 184
ix List of Figures
Figure 2.1: SWER network with isolating transformer . ... 8
Figure 2.2: Direct SWER network . ... 8
Figure 2.3: SWER line isolating transformer . ... 9
Figure 2.4: SWER customer transformer . ... 11
Figure 2.5: System demand forecast(2015-2025, Ergon Energy) . ... 14
Figure 2.6: Ferranti voltage boost due three SWER conductors . ... 14
Figure 2.7: Low Voltage Regulator (LVR) mounted on a SWER transformer pole for 240V single phase supply . ... 20
Figure 3.1: Single line diagram of a four bus SWER system. ... 34
Figure 3.2: Phasor diagram of a four bus SWER system. ... 35
Figure 3.3: Single line diagram of a four bus SWER system including network side DSTATCOM. ... 37
Figure 3.4: Single line diagram of a four bus SWER system including customer side DSTATCOM. ... 38
Figure 3.5: Single line diagram of a simple SWER system including four quadrant DSTATCOM. ... 40
Figure 3.6: Phasor diagram of a two bus SWER system. ... 41
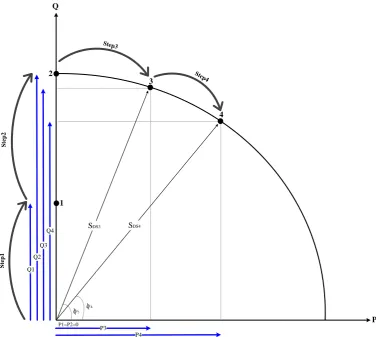
Figure 3.7: Maximum voltage and DSTATCOM active power at bus 2. ... 44
Figure 3.8: Rated power circle diagram of a four quadrant DSTATCOM. ... 45
Figure 3.9: Relationship between power and sensitivity ratio, equation (3.38). ... 48
Figure 3.10: DSTATCOM Steady state Stability Limit (DSSL) Point lay out. ... 49
Figure 3.11: Operation of DSTATCOM and power injection based on Q-priority strategy. ... 55
x
Figure 3.13: The effect of SWER line R/X ratio on the voltage improvement due to DSTATCOM customer side and network
side VAr injection in three different sizes. ... 58
Figure 3.14: The effect of load on the ratio of voltage improvement due to DSTATCOM customer side over network side VAr injection in three different sizes. ... 59
Figure 3.15: DSTATCOM size effect on customer side DSSL point. ... 60
Figure 3.16: DSTATCOM size effect on network side DSSL point. ... 61
Figure 3.17: DSTATCOM location effect on DSSL point. ... 62
Figure 3.18: The effect of SWER line R/X ratio on DSSL point. ... 64
Figure 3.19: The effect of load size on DSSL point. ... 65
Figure 3.20: The SWER line R/X ratio effect on DSSL point (Load is 60% & DSTATCOM is 30% of transformer rating). ... 66
Figure 3.21: The load size effect on DSSL point (DSTATCOM is 30% of transformer rating & R/X=0.7). ... 66
Figure 3.22: Location of Richmond SWER line system . ... 68
Figure 3.23: Single line diagram of Richmond SWER line with 126 nodes and 49 customers . ... 69
Figure 3.24: Network side and customer side DSTATCOM effect on all customers’ voltage profile (Load & DSTATCOM size 35% & 45% of transformer rating; only Q injection is considered). ... 70
Figure 3.25: Maximum possible voltage due DSSL point in Network side and customer side (load 65% transformer size, DSTATCOM 45% of transformer size). ... 72
Figure 3.26: The effect of DSTATCOM location on maximum voltage support at customer 49. ... 73
Figure 3.27: The effect of DSTATCOM location on maximum voltage support at customer 47. ... 74
Figure 3.28: Customer side and network side voltage sensitivity with respect to active power change. ... 75
Figure 3.29: Customer side and network side voltage sensitivity with respect to reactive power change. ... 75
xi
Figure 3.31: System voltage profile due to different DSTATCOM
operating angle and location. ... 77
Figure 3.32: Location effects on the voltage sensitivity ratio ... 77
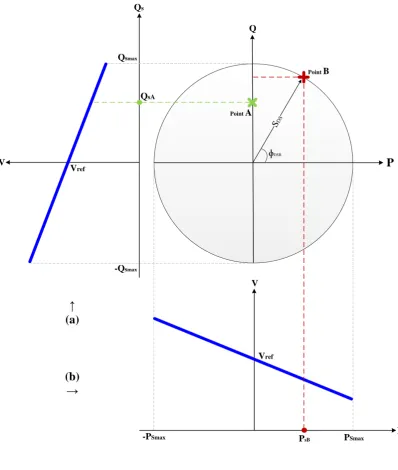
Figure 4.1: (a) A simple AC system including four quadrant DSTATCOM
and (b) its power diagram. ... 83
Figure 4.2: Reactive power-voltage droop characteristics (Qs-V). ... 84
Figure 4.3: (a) Active and (b) reactive power flow at bus i including
DSTATCOM operating in Q-only mode. ... 86
Figure 4.4: The hysteresis control loop for Q-only mode including
DSTATCOM switching ON or OFF position. ... 91
Figure 4.5: Modified droop characteristics including hysteresis control
loop. ... 93
Figure 4.6: DSTATCOM Q-only mode flowchart. ... 95
Figure 4.7: A typical 24 hours load profile in 70 years period of time considering 3% annual load growth for customer 49 (rated
transformer of 10 kVA). ... 96
Figure 4.8: A typical 24 hours load profile in 70 years period of time considering 3% annual load growth for customer 47 (rated
transformer of 25 kVA). ... 96
Figure 4.9: The 24 hours voltage profile of customer 49 corresponded with
the load at Figure 4.7. ... 97
Figure 4.10: The 24 hours voltage profile of the customer 47 corresponded
with the load at Figure 4.8. ... 97
Figure 4.11: The voltage profile of all 49 customers at peak time 19:00 in
70 years period of time. ... 99
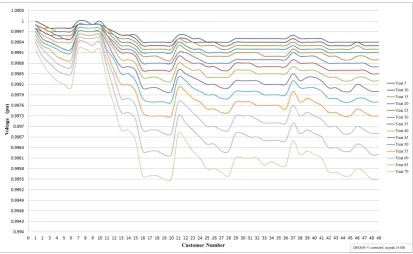
Figure 4.12: The voltage profile of all 49 customers at peak time 19:00 in 70 years period of time, using Qs-V droop characteristic as at
Figure 4.2. ... 99
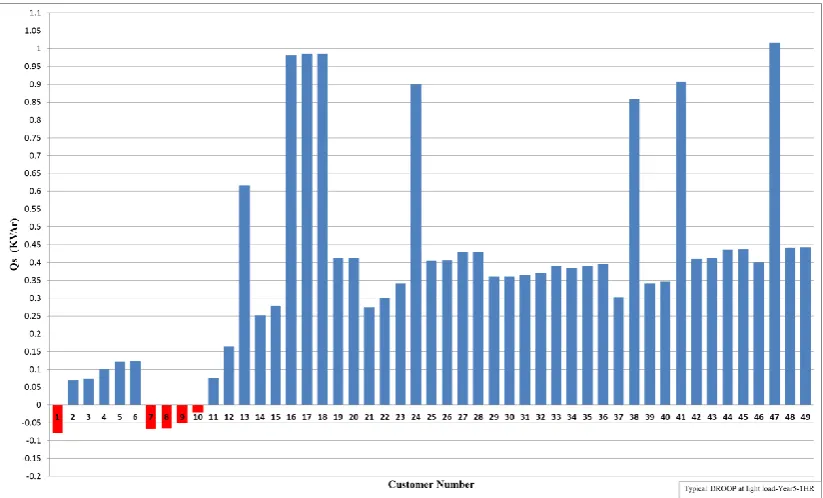
Figure 4.13: The DSTATCOM reactive power Qs to be injected or absorbed for all customers at time 1:00 of year 5, using Qs-V
droop characteristic as at Figure 4.2. ... 100
Figure 4.14: The DSTATCOM reactive power Qs to be injected or absorbed at customer 1 in 24 hours of year 5, using Qs-V
xii
Figure 4.15: The DSTATCOM reactive power Qs for all customers at
peak time 19:00 of year 70 using typical and modified Qs-V
droop characteristic as at Figures 4.2 and 4.5. ... 102
Figure 4.16: The voltage profile of all 49 customers corresponded with injected DSTATCOM reactive power Qs shown at Figure
4.15. ... 102
Figure 4.17: The voltage profile of all 49 customers at peak time 19:00 in 70 years period of time, using modified droop characteristics
as at Figure 4.5. ... 103
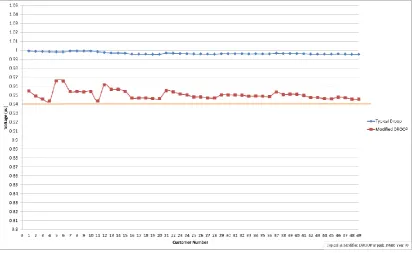
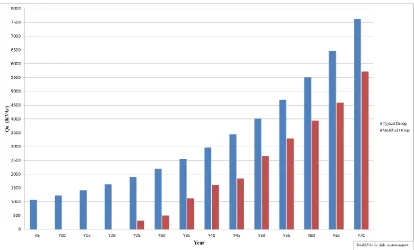
Figure 4.18: The needed DSTATCOM reactive power Qs to support the
voltage in 70 years period of time using typical and modified
Qs-V droop characteristics. ... 103
Figure 4.19: 24 hours voltage profile of all 49 customers in year 25
corresponding to Table 4.2. ... 107
Figure 4.20: 24 hours voltage profile of all 49 customers in year 70
corresponding to Table 4.3. ... 107
Figure 5.1: The DSTATCOM power injection in Q-priority mode
operation. ... 111
Figure 5.2: P-Q circle, Qs-V and PS-V droop control relationship. ... 114
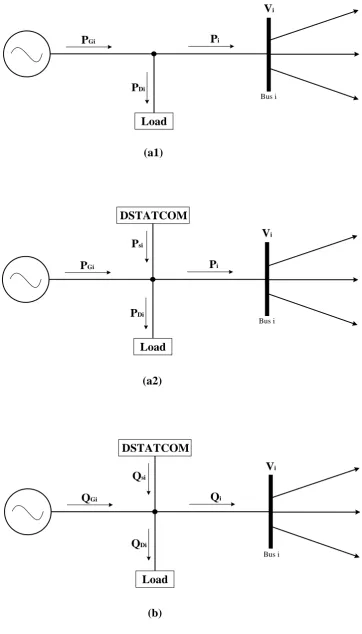
Figure 5.3: (a1) and (a2) Active and (b) Reactive power flow at bus i with
DSTATCOM operating in Q-priority mode... 115
Figure 5.4: Hysteresis control loop for Q-priority mode showing
DSTATCOM state. ... 119
Figure 5.5: DSTATCOM Q-priority mode flowchart. ... 120
Figure 5.6: Q-Priority DSTATCOM operation, time 7:00, year 70, P-Q
mode limits: 0.92pu-0.99pu. ... 122
Figure 5.7: System voltage profile, time 7:00, year 70 with DSTATCOM
operating in Q-priority mode. ... 122
Figure 5.8: DSTATCOM operation in Q-priority mode, time 19:00, year
70, P-Q mode limits: 0.92-0.99pu. ... 123
Figure 5.9: System voltage profile, 19:00, year 70 for DSTATCOM
operating in Q-priority mode. ... 123
Figure 5.10: DSTATCOM customer 41 daily operations profile, year 70,
P-Q mode limits: 0.92-0.99pu. ... 125
xiii
Figure 5.12: DSTATCOM Q-priority mode, time 7:00, year 70, P-Q mode
limits: 0.93pu-0.99pu. ... 127
Figure 5.13: System voltage profile, time 7:00, year 70, DSTATCOM
operating in Q-priority mode. ... 127
Figure 5.14: DSTATCOM Q-priority mode operations, time 19:00, year
70, P-Q mode limits: 0.93pu- 0.99pu. ... 129
Figure 5.15: System Voltage profile, time 19:00, year 70, DSTATCOM
operating in Q-priority mode. ... 129
Figure 5.16: DSTATCOM operation of customer 41 over a 24 hours period,
year 70, P-Q mode limits: 0.93pu-0.99pu. ... 130
Figure 5.17: Voltage profile of customer 41 over a 24 hours period, year
70, Q-priority mode. ... 130
Figure 5.18: Daily DSTATCOM operations, year 70, P-Q mode limits:
0.92-0.99pu. ... 134
Figure 5.19: Daily DSTATCOM operation for all customers, year 70, P-Q
mode limits: 0.93-0.99pu. ... 134
Figure 6.1: DSTATCOM power injection in load PF follow mode of
operation. ... 138
Figure 6.2: Active power-voltage (Ps-V) droop characteristics. ... 139
Figure 6.3: Reactive power-voltage (Qs-V) droop characteristics. ... 140
Figure 6.4: (a) Active and (b) reactive power flow at bus i for DSTATCOM
load PF follow mode. ... 142
Figure 6.5: Hysteresis control loop for load PF follow mode showing
DSTATCOM state. ... 144
Figure 6.6: DSTATCOM load PF follow mode flowchart ... 148
Figure 6.7: Hysteresis control loop for load PF correction mode showing
DSTATCOM state ... 147
Figure 6.8: Daily load profile and DSTATCOM operation with PF 0.9 of
customer 41 in year 70 (Load PF follow mode). ... 150
Figure 6.9: The system voltage with and without DSTATCOM operating at load PF follow mode for 24 hours at customer 41 in year 70
with PF of 0.9. ... 150
Figure 6.10: The 24 hours of load and DSTATCOM operation with PF 0.9
xiv
Figure 6.11: System voltage with and without DSTATCOM operating in load PF follow mode for 24 hours period of customer 49 in
year 70 with PF of 0.9. ... 151
Figure 6.12: Daily load conditions of all customers with three different power factors, 0.9, 0.8 and 0.7, year 70 with no DSTATCOMs
in the network. ... 152
Figure 6.13: Daily DSTATCOM operation, load PF follow mode, all customers with three different load power factors, 0.9, 0.8 and
0.7, year 70. ... 153
Figure A1: Single line diagram of Richmond SWER line with 126 nodes
xv List of Tables
Table 2.1: Properties of possible SWER conductors in Ergon Energy ... 10
Table 3.1: Simple SWER system specifications ... 56
Table 3.2: Customer voltage boost due to different DSTATCOM sizes and
locations ... 57
Table 3.3: Location and size effect of DSTATCOM on DSSL point ... 59
Table 3.4: Richmond customers’ voltage change due to different
DSTATCOM location ... 71
Table 3.5: Network side DSSL angle and maximum voltage support for all
customers ... 78
Table 3.6: Customer side DSSL angle and maximum voltage support for
all customers... 79
Table 4.1: Detailed hysteresis control loop of DSTATCOM Q_only mode
corresponded with ... 91
Table 4.2: 24 hours DSTATCOM operating status in year 25 to support
the voltage ... 105
Table 4.3: 24 hours DSTATCOM operating state in year 70 to support
voltage ... 106
Table 4.4: DSTATCOM usage for all customers over a 70 years period ... 108
Table 5.1: Hysteresis control loop details for DSTATCOM Q-priority
mode as per Figure 5.4 ... 119
Table 5.2: DSTATCOM operations, SDS=10 kVA, year 70, Q-only mode:
0.94-0.99pu; P-Q mode ... 126
Table 5.3: DSTATCOM mode operation: SDS=10 kVA, year 70, Q-only
mode limits: 0.94-0.99pu; ... 131
Table 5.4: DSTATCOM with SDS=10kVA, year 70, Q-only mode limits:
0.94-0.97pu; P-Q mode ... 133
Table 6.1: Hysteresis control loop of DSTATCOM load PF follow
corresponding with Figure 6.5 ... 145
Table 6.2: Hysteresis control loop of DSTATCOM load PF correction
corresponding with Figure 6.6 ... 148
Table 6.3: DSTATCOM state, load PF follow mode, year 70, load PF of
xvi
Table 6.4: DSTATCOM state, load PF follow mode, year 70, load PF of
0.8 ... 155
Table 6.5: DSTATCOM state, load PF follow mode, year 70, load PF of
0.7 ... 156
Table 6.6: System load power factor using DSTATCOM load PF
correction mode, year 40, ... 157
Table 6.7: System voltage profile with DSTATCOM operating in load PF
correction mode, year 40, ... 158
Table 6.8: System load power factor using DSTATCOM load PF
correction mode, year 40, ... 159
Table 6.9: System voltage profile with DSTATCOM operating in load PF
correction mode, year 40, ... 160
Table 6.10: System load power factor using DSTATCOM load PF
correction mode, year 40, ... 161
Table 6.11: System voltage profile with DSTATCOM operating in load
PF correction mode, year 40, ... 162
xvii
Abbreviations
LV Low Voltage
MV Medium Voltage
HV High Voltage
SWER Single Wire Earth Return
DG Distributed Generation
STATCOM STATic COMpensator
DSTATCOM Distributed STATCOM
EPR Earth Potential Rise
SC/GZ Steel Cored / Galvanized Zinc
SC/AC Steel Cored / Aluminium Clad
ADMD After Diversity Maximum Demand
PV Photovoltaic
POE Probability Of Exceedance
RE Renewable Energy
LTC Load Tap Changer
OLTC On Load Tap Changer
FACTS Flexible Alternating Current Transmission System
AVC Automatic Voltage Control
PFC Power Factor Correction
LVR Low Voltage Regulator
SSSC Static Synchronous Series Compensator
UPFC Unified Power Flow Controller
xviii SVC Static Var Compensator
VSI Voltage Source Inverter
VSC Voltage Source Converter
SMES Superconducting Magnetic Energy Storage
BES Battery Energy Storage
ESSs Energy Storage Systems
RGA Real Genetic Algorithm
PSO-TVAC Particle Swarm Optimization-Time Varying Acceleration Coefficients
IA Immune Algorithm
PSO Particle Swarm Optimisation
CPF Continuation Power Flow
GUSS Grid Utility Support System
RUSS Residential Utility Support System
VS Voltage Support
SVS Static VAr System
PF Power Factor
CB Circuit Breaker
DERs Distributed Energy Resources
DICs Distributed energy resources Interface Converters
IPV Interline Photo Voltaic
PCC Point of Common Coupling
BDC Bounded Droop Controller
RDC Robust Droop Controller
xix AC Alternative Current
MNR Modified Newton Raphson
pu Per Unit
RMS Root Mean Square
DS.NS DSTATCOM Network Side
DS.CS DSTATCOM Customer Side
R/X Resistance over Reactance
DSSL DSTATCOM Steady state Stability Limit
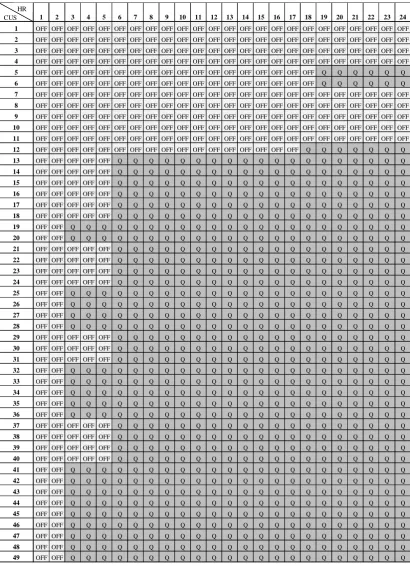
HR Hours
CUS Customer Number
EHV Extra High Voltage
xx
Nomenclature
RL Load resistance
IL Load current
T12 Isolating transformer located between bus 1 and 2
T34 Transformer connected to the load and is located between bus 3
and 4
R+jX Transmission line impedance
XT12 Thereactance of transformer T12
XT34 Thereactance of transformer T34
Vi The voltage at bus i
IDS.NS Network side DSTATCOM current
IDS.CS Customer side DSTATCOM current
PLi+jQLi Load active and reactive power connected to bus i
PDSi+jQDSi DSTATCOM active and reactive power connected to bus i
SDS.NS Switch to connect network side DSTATCOM to the network
SDS.CS Switch to connect customer side DSTATCOM to the network
QDS.NS The reactive power of network side DSTATCOM
QDS.CS The reactive power of customer side DSTATCOM
IDS.NS Network side DSTATCOM current
IDS.CS Customer side DSTATCOM current
∆|VNS| Voltage boost due to network side injection
∆|VCS| Voltage boost due to customer side injection
(R/X)N.S R/X ratio of network side installed DSTATCOM
xxi
∆Vx The real component of voltage drop ∆V
∆Vy The imaginary component of voltage drop ∆V
SDS DSTATCOM size in kVA
PDS DSTATCOM active power in kW
QDS DSTATCOM reactive power in kVAr
ɸDS DSTATCOM operating point angle
ɸDSSL DSTATCOM Steady state Stability limit operating angle
dPDS/dQDS The derivative of DSTATCOM active power with respect to its
reactive power
∂V/∂PDS Partial derivative of voltage with respect to DSTATCOM active
power
∂V/∂QDS Partial derivative of voltage with respect to DSTATCOM reactive
power
PDSSL DSTATCOM active power when it is operating at DSSL point
xxii
Publications
The following publications are the direct outcomes of this research project:
S.J.Mirazimiabarghouei,T.Ahfock and A.Helwig, “Placement of Distribution STATic COMpensator (DSTATCOM) as Voltage Support Equipment in Single Wire Earth Return (SWER) System” IEEE 6th International Conference on Power and Energy, ‘PECON 2016’, Malaysia, Melaka, 28-29 November 2016.
1
CHAPTER 1
1
INTRODUCTION
1.1
BackgroundA Single Wire Earth Return (SWER) system is a single wire distribution line for supplying single phase electric power. It has a distinguishing feature in that it uses the earth as the return path for the current thus avoiding the need for a second or neutral wire to act as a return path [1].Power is supplied from the main backbone to the SWER line by an isolating transformer. This transformer isolates the grid from ground or earth, and changes the grid voltage to the SWER voltage [2]. SWER distribution systems have been recognized as able to provide cost effective electricity over long distances to sparsely populated rural areas in a number of countries such as Australia, New Zealand, Canada and United States for over 50 years [3]. Currently more than 150000 km of SWER lines are in use all over Australia [4].
Whilst SWER systems are still currently being utilised in Queensland, there are problems and issues that limit their full potential to deliver power of acceptable quality. As a result of relatively long distance, the most serious power quality problem with SWER distribution system is voltage regulation. The long distance lines will result in low voltage at the end of the lines during peak demand [5, 6]. When the SWER line was first installed, while low voltage was not a problem, steady load growth will cause the problem to surface at some point in the life of the SWER line.
2
not be able to address the voltage problem. On the other hand upgrading of the network by using heavier conductors is a relatively expensive option [3].
Significant research has been conducted in the STATCOM area considering it as voltage support to enhance the voltage profile of the system either in typical three phase systems or in SWER networks [14-16]. The performance and effectiveness of STATCOMs, either reactive power only or four quadrant, will be affected by their location in the power network, number and size. Placement is one of the key factors and plays an important role in this matter. When considering placement of STATCOM, there is the possibility of mounting it at the customer side or network side of the customer transformer. In this study the Distribution STATCOM (DSTATCOM) is being used to improve under-voltage problems due to load growth in dispersed rural SWERs. In fact, four quadrant DSTATCOM is able to supply or absorb active power as well as reactive power using generator or storage such as a battery [4]. However installing DSTATCOMs in the system as voltage support equipment increases the possibility of VAr circulation. DSTATCOM operating modes, load sharing control methods, droop characteristic design and practical implementation are the challenges to be considered in this study.
1.2 Research Objectives
This thesis addresses the following questions in the context of SWER lines: (a) How effective are DSTATCOMs at providing customer voltage support? (b) Where and when should DSTATCOMs be installed?
In line with the above research questions the project objectives are:
(a) To compare the effectiveness of reactive power only (Q-only) DSTATCOMs with four quadrant DSTATCOMs at providing SWER line customer voltage support;
(b) To compare the effectiveness of connecting DSTATCOMs on the primary side of the SWER line customer transformer to connecting them on the secondary side;
3
(d) To extend the method proposed in (c) above to four quadrant DSTATCOMs connected to a SWER line.
1.3 Thesis Outline
This thesis is organised as follows:
Chapter 2 provides background knowledge about DSTATCOMs and SWER lines. The chapter also includes an overall literature review on current approaches for DSTATCOM integration in SWER systems as voltage support equipment. The placement of DSTATCOM, which can be at the customer or network side, is highlighted. Furthermore, the droop control method is reviewed in detail.
Chapter 3 compares the placement of the DSTATCOM on the network side of the customer transformer with its placement on the secondary side. It also analyses the level of voltage support provided by the DSTATCOM as a function of its operating point on the P-Q plane at rated kVA.
Chapter 4 introduces the Q_only DSTATCOM operating mode as a VAr compensator. The classical droop control strategy is modified to avoid VAr circulation in the network. The effectiveness of the proposed modification is demonstrated by load flow studies on a real SWER line. A new Jacobian had to be derived to enable those studies to be carried out.
4
Chapter 6 proposes the load power factor follow DSTATCOM operating mode and power factor correction mode for voltage support. In these modes, the DSTATCOM is guaranteed not to contribute to the possibility of islanding.
5
CHAPTER 2
2
LITERATURE REVIEW
2.1 Introduction
This chapter begins with providing an outline of SWER lines and DSTATCOM technologies. It systematically reports a comprehensive literature review on different issues of DSTATCOM integration in distribution systems from the perspective of system voltage profile and voltage support. The issues of DSTATCOM usage in bulk size as a single device or in a number of small sizes are thoroughly reviewed in this chapter. The placement of DSTATCOM either at the customer side or network side, from the literature is highlighted. The second part of this chapter is related to different ways of controlling DSTATCOMs. A droop control method is reviewed in detail as one of the popular control techniques, as well as load sharing strategies. Finally, the gaps and limitations relating to DSTATCOM placement and conventional and modified droop control methods, in terms of voltage control of systems, are discussed.
2.2 SWER Line Characteristics
2.2.1 SWER History
6
The dominant obstacle to rural electrification is high cost [18]. In order to avoid the expensive cost of power line upgrading and extensions, the World Bank is supporting the expansion of simple distribution networks for rural electrification [19].Single Wire Earth Return (SWER) technology is one of the most reliable and cost effective methods of rural electrification with a suitably low load density [20]. It is a single wire electrical system used to provide electrical power to remote and sparsely populated regions at a reasonable and cost effective price. Using SWER line technology, a single conductor is used to transmit the electricity to the distribution transformers at consumers’ homes, adapting all equipment grounded to the earth in order to provide a return path for the current [2].
Lloyd Mandeno invented the idea of SWER networks in New Zealand in 1920. His published paper in 1947 proposed SWER lines as an economic alternative to the typical distribution network for remote electrification [21]. Nowadays this SWER technique has become popular all over the world and many countries, such as Australia, USA, New Zealand, South Africa, Brazil and Canada are using it to supply rural electrification [22].
In order to electrify agricultural and rural regions, Australia recognised a need for power system expansion in the1950s. Australian electricity authorities turned to the SWER system due to its application years earlier as an economical solution for low load density areas [23].In 1959, an area in Central Queensland named Bajool began to use the SWER system. Consequently, years later, thousands of kilometres in remote regions of Queensland have installed SWER for rural land electrification [24].
7
of these Australian SWER networks is considered to be around 70 years, with a replacement cost of around $30000 to $50000 per kilometre [26].
For residential low voltage customers, Energy Queensland, formerly known as Ergon Energy, are required to operate within the National Electricity Rules which legislates a 240V connection point must remain within 240V with maximum variation of 6%. Considering the standard variation, the provided voltage level has to be between 225V and 255V which are 0.94pu and 1.06pu respectively [27].
2.2.2 Isolating Transformer
Commonly, a three phase supply feeder is used to feed a SWER line. SWER networks are presented in two basic types: firstly through an isolating transformer from the main supply as is illustrated in Figure 2.1 and secondly, directly from the main supply named direct SWER as shown in Figure 2.2. To isolate the earth current that circulates in SWER line as a return current, from three phase system, an isolating transformer is installed at the beginning of the feeder. As a result, not only it remains earth fault protection sensitivity but also avoids possible interfaces with underground telecommunication cables [23]. In addition, it provides earth fault protection on Medium Volt (MV) networks in terms of grid extension [28-30].
8 240 240 0 Drop Out Fuse Switch Surge Arrester Single Phase Transformer 19.1KV/240/0/240
Separate HV and LV Earths
Recloser Single wire line to rest
of distribution system
240 240 0 Drop Out Fuse Switch Surge Arrester
Separate HV and LV Earths 33/19.1 KV Isolating
Transformer
33KV
Figure 2.1: SWER network with isolating transformer[20].
240 240 0 Drop Out Fuse Switch Surge Arrester Single Phase Transformer 19.1KV/240/0/240
Separate HV and LV Earths Recloser
Single wire line to rest of distribution system
240 240 0 Drop Out Fuse Switch Surge Arrester
Separate HV and LV Earths Three phase
line
Figure 2.2: Direct SWER network [20].
9
While substation at the source has an entirely grounded neutral, using an isolating transformer is not essential [20].Excluding it and connecting one of the phases directly to the SEWR line is currently used in some countries, for example Brazil [30].
Direct SWER means lower cost and no constraint of load but it also may cause interference to telecommunication cables or high voltage concerns to electrical apparatus due to the flowing back of current [28]. On the other hand, using an isolating transformer controls SWER earth fault currents, maintains the sensitivity of earth fault protection and limits the load [31].
According to Ergon energy reports, more than 80% of SWER lines are isolated in SWER voltage break down percentage of 55% in 12.7kv, 36% in 19.1kv and only 9% in 11kv [2]. Figure 2.3 shows a SWER line isolating transformer in Ergon Energy operation.
10 2.2.3 Conductors
Based on load and customer density, line length changes with an average of 60km for SWER feeders, even though there is a 400km SWER system available in Australia [23].However, the length of lines between customers varies from 1km up to 20km, with some rural properties up to 25km [3].
Typically, SWER lines use low quality conductors, relatively resistive, cheap in price, with low load transmission capacity, due to small load current compared to normal three phase system. The most common types of power line conductors in SWER networks at spurs (toward customers) are Steel Cored Galvanized Zinc (SC/GZ) and Steel Cored Aluminium Clad (SC/AC). It has to be noted that steel conductors are harder and stronger than others with the ability to stand much longer distances. Conductors Banana and Sultana, with less resistivity and smaller R/X ratio, are more suitable to be used in main backbone feeder areas. They are closer to substations and have to carry more currents than other feeders. Other types of conductors are also used in limited applications [2]. Table 2.1 shows the properties of common SWER conductors in Ergon Energy [32].
Table 2.1: Properties of common SWER conductors in Ergon Energy
Co nd uct o r co de Co nd uct o r ty pe Are a o f Sect io n (mm 2 ) O v er a ll dia met er (mm ) Ca lcula ted brea kin g lo a d (k N) Unit ma ss ( kg /k m) F ina l mo du lu s o f ela st icit y ( G P a ) Co ef ficient o f lin ea r ex pa ns io n (x E -6 /° C) AC Resis ta nce (a t 7 5 °C) (o hm s/km )
3/2.75 3/2.75 SC/GZ 17.82 5.93 22.2 139 192 11.5 12.05
3/2.75 3/2.75 SC/AC 17.82 5.93 22.7 118 162 12.9 5.75
Apple 6/1/3.0 ACSR/Z 49.48 9 14.9 171 79 19.3 0.893
11 2.2.4 Loads and Customers
Small density of load is a distinguishing characteristic of rural electrification including SWER networks. Typically, a normal SWER line has a load density of around 0.5kVA per kilometre, reported to be in a range of between 0.3 to 0.5kVA, with 3.5kVA as After Diversity Maximum Demand (ADMD) in Queensland, Australia [2, 32, 33].The maximum customer load size starts from less than 2kW up to around 15kW [3].
SWER distribution level transformers, to be used at the customers, are sized in 10kVA, 25 kVA and 50kVA [3].The distance between the customers varies from one to 20km due to SWER low load densities. They are fed by distribution transformer secondary windings with voltage levels of either 240V or 480V. A typical SWER customer transformer mounted on a termination pole at the end of the branch is shown in Figure 2.4.
12
2.2.5 SWER Advantages
The SWER network key advantages are outlined below [2, 20, 35]:
Simplicity: Can be constructed quickly due to simple design and simple wire.
Maintenance: Simple and cost effective to maintain as a result of having one wire and less pole top hardware.
Cost: Fewer protection and switching devices decrease the capital cost
Metering: Less complicated metering method as Low Voltage (LV) instruments are able to connect directly to the earth lead.
Hazards: Hot metal and arcing are the result of two wires clashing. Using only one wire significantly decreases the possibility of hazards.
Spans: A single light conductor makes the spans longer and the pole quantity fewer.
Reliability: Increased network reliability due to a decrease in equipment failure.
2.3 SWER Issues
SWER networks do suffer from some issues relating to their design and operation. Some
of these issues will be investigated in this part of study. There are three main concerns:
Load growth
Ferranti effect
Voltage regulation
2.3.1 Load Growth
13
Ergon Energy estimates a load growth for a period of 10 years (2015-2025) as 10% Probability of Exceedance (POE). This is illustrated in Figure 2.5. Due to demand, continued growth and limited capacity of peak load supply, Australian energy companies encounter with the experiment of affordability. As a matter of concern, some SWER networks may over loading, or close to entirely cycle capacity or even operating near voltage margin [2].
2.3.2 Ferranti Effect
Voltage increase happening at the receiving end of a long energized power lines compare to the sending end voltage is known as the Ferranti effect. Usually, it appears on a live long line with a length of more than 80 kilometres and very light load. In fact, the greater the voltage and the longer the length of line, the greater the Ferranti effect
will be. Such lines include EHV, UHV or SWER [39].
14
Figure 2.5: System demand forecast(2015-2025, Ergon Energy)[40].
Figure 2.6: Ferranti voltage boost due three SWER conductors [2].
2.3.3 Voltage Regulation
15
and adjusting it within acceptable limits. This is defined as a ratio of voltage change magnitude among the sending and receiving end of transmission or distribution line over the receiving end voltage. It presents the power system capacity to deliver almost the steady voltage to customers in different load situations.
Voltage regulation issues can last a few cycles or longer, perhaps many hours. The short term problems can be recognised as voltage sags or surges, and the longer lasting ones are known as a LV and High Voltage (HV) challenges [41].
Voltage regulation in SWER networks is a typical challenge for Australian electrical energy distributers due to a mixture of causes, such as locating at the end of network, where system regulation is already largely high [24].Field tests performed on SWER networks in 2015 reported both overvoltage and undervoltage problems [40]. In addition, capacity constraints are happening due to voltage regulation issues in SWER lines [5].
2.4 Voltage Regulation Options
Regulating the supplied voltage to customers within acceptable limits is one of the distribution network operator’s responsibilities [42]. Voltage regulation is the main
concern for SWER lines within the Ergon Energy distribution portfolio [6].
As a result of performing with the voltage lower than standard, electrical equipment may overheat, break down or operation may be unstable. On the other hand, high voltage can result in component failure or overheating due to voltage stress. In either case, a voltage regulator would be applied to supply voltage within the normal operating parameters of the loads [41]. The desired voltages can be obtained by one of, or combinations of the techniques described in the following subsections [4].
2.4.1 Load Tap Changer (LTC)
16
turn ratio changes while it is supplying the load [7]. Typically, OLTC transformer coupled with a relay named Automatic Voltage Control (AVC) to adjust tap position in order to regulate the voltage [43]. Generally, it determines whether to modify the tap position or not, and will be limited by the number of taps and steps. The OLTC is commonly used in the distribution systems to transform from 33kV to 11kV or 6.6kV [42].
While the secondary voltage noticed to be operating apart from the permitted value, the tap changer mechanism corrects its tap position to recover the required voltage level in order to AVC relay command. The main drawback of this structure is that the limitation of tap changer operation to its tapping constraints and capacity [44].
2.4.2 Series/Shunt Capacitors
One of the major roles of capacitors in power systems is regulating the voltage, whether connected as a single unit or bank, either in series or shunt, or even fixed or switched. In order to minimize the voltage drop caused by inductive reactance, series capacitors act as a negative reactance (capacitive) used to compensate the positive reactance of system.
Using capacitors in series decreases the dropped voltage due to lagged load current for all customers downstream from the capacitor. It performs like a voltage regulator that improves the voltage which is proportional to the current amplitude and power factor angle. Unlike shunt capacitors, the series one minimises the fluctuation of voltage sourced by quick inductive load variation [9]. Upstream customers do not realise any flicker difference [8]. The effectiveness of the series capacitors are less for the more resistive loads. Series capacitors are also more practical and efficient on the system with higher X/R ratios [9].They have been used to address voltage issues on electrical power networks for more than 65 years, but in limited options. Ferroresonance possibility through downstream transformers, difficulties on short circuit protection and their cost has made them less popular in practice [8].
17
system, the source current magnitude is cut down and consequently, the dropped voltage between the source and customer reduced [45]. Moreover, the feeder power and system resistive losses are reduced, due to transmission line current reduction [46].
Switching on the switchable shunt capacitors at the peak demand and switching off these capacitors at the light load would result in boosting their effectiveness. It is important to control the switched capacitor correctly due to load variation during the day [7]. Some of the gains and benefits of shunt capacitor usage include, power bill reduction, system capacity rise, voltage improvement and losses reduction [47]. Distributed LV switched shunt capacitor banks at Weir SWER networks with 400km length and 96 customers are used to provide voltage support [6].
2.4.3 Fixed/Switched Shunt Reactors
Voltage rise occurs due to the charging capacitance of long transmission lines with a light load at the end of the feeder [4].It might be not noticeable in a typical three phase distribution system, but due to low load density and very long power lines, it is a remarkable challenge for SWER networks. It makes it difficult to keep the SWER customers voltage within an acceptable range [10].
Fixed shunt reactors have been introduced to address such an issue, by installing them in a SWER system to reduce the capacitive loading of the line and regulate voltages during off peak period. Such a solution regulated the voltage issue at light load. These reactors sat on top of the existing load during heavy consumption. It reduced the SWER line load ability and increased the low voltage problem that already existed [4].The ideal way of combatting this challenge is to replace fixed shunt reactors with a switchable reactor through a circuit breaker or a contactor, including multiple smaller reactors (preferably LV as it is economic and simpler [48]). Voltage problems during peak times can be avoided by switching them off [34, 49].A low voltage controllable reactor that is connected to the LV side of a SWER distribution transformer, has been proposed to regulate the voltage in two SWER systems, Jericho North and Stanage Bay, located in Queensland, Australia [4, 10].
18
voltage at peak load. Unfortunately, a SWER line has a high R/X ratio and these techniques of reactive compensation will be rather limited in the case of SWER networks. The resistive line loss will remain high in any case [50].
2.4.4 Distributed Generation (DG)
Implementing Distributed Generation (DG) in a typical three phase power system has been a popular choice due to several advantages such as power loss reduction, decreased cost, voltage enhancement, system upgrade deferral and improvements in reliability [51].It operates in a very effective form of voltage support by injecting real power in to the system. It can be generated from renewable or non-renewable sources, throughout various types of technologies [7, 50].
There is great potential for the use of DGs in SWER lines in terms of improving voltage regulation. This is due to SWER lines often being considered as a weaker network with a notable resistive element to the impedance of lines [11]. DG gains cause a line power flow reduction leading to improvement of voltage profile [52].The voltage rise, due to injected DG power, can be higher at the connection point than substation point; as a result it can pass to the transmission system from distribution level [7].
DGs are considered allocating in two cases, centralised or distributed. Results show a single DG can lead to more benefits for a typical three phase power system. On the other hand, SWER networks with a long power line, distributed customers, and motor starts, can have more benefits allocating distributed DG than a single DG [11]. DG development in diverse technologies and its usage in distribution levels of systems raise a stability concern, and there is a necessity for further study on the avoidance of adverse effects [7, 53].
2.4.5 Voltage Regulator
19
solutions [4]. In comparison with HV regulators allocated at SWER backbone transmission lines, the LV regulators benefit from being cost effective and easy to install [2].Traditionally, the LV side of a SWER distribution transformer is connected to a single load and supplies just one customer. This means, aside from upstream voltage issues, customer’s individual voltage can be adjusted exclusively [2].
A generous regulation range of ±16% and a very short response time of 33 milliseconds make LVRs advantageous and beneficial in terms of SWER system voltage support. Energy companies, like Ergon Energy in Australia installed LVRs in SWER systems in order to enhance the voltage level for their consumers [2].More than 1000 LVRs are being installed throughout the SWER networks.Figure 2.7 shows LVR mounted on a SWER transformer pole for a 240V single phase supply by Ergon Energy [54].
It should be noted that, in the case of power outage or circuit breaker reclosing, LVRs are not able to maintain supply due to lack of battery backup. Furthers, sags and swells are the concerns that may lead the LVRs in to a temporary pass through due to their voltage operating range [54].
2.4.6 FACTS Devices
20
Figure 2.7: Low Voltage Regulator (LVR) mounted on a SWER transformer pole for 240V single phase supply [54].
are directly or indirectly related to FACTS devices. In addition, they are also applicable in terms of voltage stability and voltage profile section of electric power systems. Some typical and popular examples of FACTS devices are Static Synchronous Series Compensator (SSSC), Unified Power Flow Controller (UPFC), Thyristor Controlled Series Compensator (TCSC), Static VAr Compensator (SVC) and STATic COMpensator (STATCOM) [12, 13].
It is usual to classify FACTS devices based on their connections type in three different groups; series connected, shunt connected and combined series-shunt. FACTS devices connect to the system in series such as TCSC, control power flow. Shunt connected FACTS devices, such as SVC or STATCOM, however, manage the voltage. Devices like UPFC, which have both series-connected and shunt-connected components, are known as combined series-shunt devices and can control voltage and power flow simultaneously [12].
21
[57]. FACTS devices connected in shunt have potential to bring some benefits for power systems due to their usage in appropriate locations and size. Some of these advantages are listed as below [58]:
Improving voltage profile of power systems
Reducing or clearing away power line overload
Boosting power system dynamic and transient stability
Cutting down the value of energy losses remarkably
Deferring the necessity of system upgrading
Adding further capacity to the existing structure
Both STATCOM and SVC are suitable for use in voltage control, compensating regular voltage variation and over voltage reduction [56]. Basically, their operation principals are the same while STATCOM is capable of producing more reactive power during below voltage regulation range and also responding faster due to no delay in thyristor firing of Voltage Source Converter (VSC) [2]. Providing more voltage stability margin than SVC at the weakest bus [59] and having superior performance with newer technology makes STATCOMs completely reliable and a popular choice [56].
2.4.7 STATic COMpensator (STATCOM)
22 STATCOM key advantages are listed below [60]:
Fast dynamic response to system load changes
Moderation of harmonics
High efficiency low voltage regulation
Real power source injection
Much research has been conducted in regard to the usage of STATCOM systems, considering them as a voltage support device to enhance the voltage profile of the system either for typical three phase systems or for SWER networks [14-16, 59-63].
A distributed approach of supporting voltage and modifying reactive power can apply to STATCOM systems in various sites with voltage and reactive power issues for both transmission applications and at distribution levels. This dispersed approach of STATCOM application in the distribution system is referred to as Distribution Static Compensation (DSTATCOM). In the event of a lone bulk reactive support component failure, the risk of reactive power support loss will be lower due to the usage of DSTATCOM in the network [61].
In addition, DSTATCOM has been developed to boost power system efficiency and reliability of a distribution network due to its shunt connected voltage source converter. DSTATCOMs play a vital role in distribution systems in terms of voltage support improvement and power loss reduction, under two different circumstances, steady state and dynamic [64]. Gains such as reactive support, voltage control and quick voltage recovery support, improving system voltage stability, enhancing system transient stability, increasing system reliability, boosting line capacity and decreasing system losses are considered some of the benefits of employing a DSTATCOM system due to flexible voltage and reactive control approaches [61].
23
Storage (SMES) applied with DSTATCOM can be a solution to raise the capacity of transmission including power flow controls. DSTATCOM has the ability to supply and absorb active and reactive power, known as four quadrant DSTATCOM operation. Not only does this have the ability to raise and lower the voltage, but can also control the series impedance or phase angle of the system. It makes it possible to have a system with lower line losses and transmission lines close to the thermal limits operation [65].
The FACTs are normally reserved for power electronic equipment (SVCs, STATCOMs) used in HV, EHV and UHV transmission. On the other hand, DSTATCOMs are used at distribution level. However design and operation of FACTs and DSTATCOMs are based on the same fundamental principles.
2.5 DSTATCOM Placement
The performance and effectiveness of FACTSs devices like DSTATCOM, either alone or combined with an active power source, will be affected by their number, size and location in the power network. Placement is one of the key criteria and plays an important role. Many researchers have investigated the location of FACTSs devices including DSTATCOMs in order to enhance power network operation using placement algorithms. Some of these algorithms are Particle Swarm Optimization (PSO), Tabu Search (TA), Simulated Annealing (SA), Genetic Algorithm (GA), Evolutionary Algorithm (EA), Bees Algorithm (BA), Harmony Search Algorithm (HSA), Group Search Optimizer with Multiple Producer (GSOMP) and Bacterial Swarming Algorithm (BSA) [65].
One of the other ways of considering placement of DSTATCOM is the possibility of mounting it on the customer side at distribution level or on the network side at transmission level. Either way it could be applied in multiple locations or in a centralised single point placement.
2.5.1 Network Side Injection
24
coupling transformer allowing them to be considered at transmission level. The optimal voltage profile during light load conditions and under full load conditions were accomplished by applying an optimisation algorithm. This was developed by calculating terms of the required active and reactive power for placing voltage support equipment in a single location, or distributed in two locations. It has been concluded that multiple injection, in this case from two locations, will be more effective in enhancing voltage regulation. Furthermore, results show that it would be more efficient for the power to be injected from the end of the line rather than closer to the primary source.
In a similar study [61], a distributed approach of DSTATCOM in multiple locations in
order to provide voltage support and reactive power control has been suggested for
transmission application and smaller utilities. Results show multiple installation of
DSTATCOM is more effective than a single large lumped solution where voltage and
reactive power is a concern. Another achievement of the distributed approach is higher
system reliability e.g., a single point failure with a single centralised unit removes
reactive power support.
Studies by [67] examined DSTATCOM for distribution voltage regulation
predominantly on long feeders with voltage issues. It has been considered that a single
DSTATCOM mounted somewhere between the source and the customer with a
specific distance from the substation. DSTATCOM is given to be a cost effective
solution to solve voltage regulation problems in long feeders. DSTATCOM usage for
supporting the voltage in a lumped load system raised the system capacity of the line
in order to improve its transient response and bulk capacity for voltage control. In
addition, DSTATCOM may supply loads with low loss factors as a backup when
placed in the middle of a distribution power line.
25
Another study in [63] developed an algorithm named Particle Swarm Optimization-Time Varying Acceleration Coefficients (PSO-TVAC) to support the voltage by supplying or consuming reactive power due to DSTATCOM installation in suitable site and size. The optimal location and size of DSTATCOM found to be beneficial and increased the power system voltage profile on standard IEEE system.
In addition, a recent study in [64]proposed a practical technique with the objective of minimizing losses and improving voltage profile using DSTATCOM. This technique finds the best potential busbar in a radial distribution system, based on different defined indexes, with the aim of raising the candidate bus voltage to 1pu. The results indicate a reduction in active power losses and an improvement in system voltage profile. It was concluded that the DSTATCOM made a significant change in distribution network voltage profile and presents itself as a cost effective and reliable solution in terms of loss saving.
Further research [68] studied the optimal location and sizing of DSTATCOM using Immune Algorithm (IA) in order to improve the current and voltage profile of the system. Biologically inspired algorithm was applied to find the optimum location and size of DSTATCOM in three different load conditions, light, medium and peak. Results show that using this technique to find the optimal size and location for voltage support equipment can decrease power losses, cost of DSTATCOM and current profile and also boost the buses voltage.
The research in [65]proposed a genetic algorithm to find the best location of injecting or absorbing power using DSTATCOM in two different methods, combining with storage or without storage. It has been concluded that using DSTATCOM alone will improve the load ability of a system but not as much as using it combined with storage system. One single DSTATCOM with storage is the best solution to address the voltage problem in the system.
26
different location. This study examined three different power systems, and all concluded a single result. The optimal placement and size of DG and DSTATCOM boosts the voltage profile and decreases system losses. Moreover, it has to be noted that placement of DG and DSTATCOM in the same bus has been more effective than placement in different buses, with respect to voltage improvement.
In a similar study [70]an analytical method to find the optimal place for DSTATCOM in power networks was proposed. This method is based on a simple load flow to calculate the system power losses and voltage. It has been considered that the DSTATCOM is able to inject and absorb active power as well as reactive power due to its storage device. DSTATCOM has been modelled to maintain the voltage of the connected bus at 1pu. The proposed method was found to be implemented effectively and easily, resulting in system voltage improvement of IEEE 33bus systems. One method, presented in [15]used Particle Swarm Optimisation (PSO) and Continuation Power Flow (CPF) to find the optimum location of DSTATCOM. It aimed, with respect to the DSTATCOM size, to enhance system voltage profile, reduce power losses and improve the load capability of the system. The results showed that following this proposed method of allocating multiple DSTATCOM, in different sizes, distributed in multiple locations which were suffering from voltage problems, can help to reach the mentioned goals. In addition, the voltage stability of power systems remarkably increased using 5 different sized DSTATCOMs, spread over an IEEE 57 bus test power system.
Similarly another study [71] uses the PSO optimisation algorithm to solve efficient size and location problems for multiple DSTATCOM devices in different load conditions from low to peak. The results indicated that, as the size of the load changed, the optimum location of DSTATCOM may vary, but certainly the size was increased. In addition, an important conclusion to consider is as the load increases, the impact of having two DSTATCOM units in the network becomes more effective than having only one, in terms of network voltage improvement.
27
constrained single wire high voltage distribution lines, known as SWER. GUSS works on rural and remote sections of the electricity network by charging batteries overnight, when demand for electricity is low, and discharging during peak demand periods. The main functions of GUSS are peak load reduction and voltage support of the SWER line. Additionally, customers on constrained networks who have had to limit their demand due to the available capacity may be able to access additional supply.
2.5.2 Customer Side Injection
The study in [73] compared two voltage compensation schemes of DSTATCOM. One to be placed alone where it is connected at a single feeder node, or multiple installations, where two of them are connected to two different places along a feeder. It is assumed that DSTATCOMs are connected at the customer at distribution level and are considered to be a customer side injection solution. The steady state results indicate that distributed point reactive power injection can greatly enhance the system voltage profile compared to single point injection.
SVC in [74]and DSTATCOM in [75, 76]were proposed as load Voltage Support (VS) equipment in a radial distribution network to be installed, in order to boost the voltage profile of the system. Both are considered as VAr compensator only with no storage elements and the line resistance has been ignored, as it assumed to be small compared to the line reactance. Results indicated that spreading out the VS devices between all loads and placing them at the customer side was advantageous over lumped VS on the network side. Benefits mentioned were lower VAr requirements, enhanced voltage regulation, cost effectiveness and higher reliability.
28 2.6 Load Sharing Control Methods
The DSTATCOM, as a source of active and reactive power, has to be considered from a control and load sharing point of view. To accomplish proper flows of real and reactive power in the system, several control techniques are proposed. The most popular ones are the master-slave control method [78], the power deviation control method [79],and frequency and voltage droop methods [80]. The droop technique is one of the most effective methods of control that is able to organise automatic load sharing between generators and develops the inverter operating power with the given ratings [81].
2.6.1 Droop Based Control Method
Researchers have recently been more interested in the employment of droop control methods, with the following advantages: [82-86]:
Easy implementation
No communications required
Flexibility, redundancy and expandability
High reliability
Different power ratings
29 2.6.2 Modified Droop Control Method
Modifying the conventional droop control method will improve the load sharing of the power network as reported in [102]. The power sharing between the inverters via several control designs are investigated in [85, 103-106]. Furthermore, the droop method with some modification was developed to make the system operation stable and secure [94, 96, 107-116]. In these papers, real and reactive power controls the frequency and voltage respectively.
A new droop control technique for interline photovoltaic (IPV) systems has been proposed in [117]. The Point of Common Coupling (PCC) voltage on the system will be regulated via IPV, which is operating as a FACTS device. To achieve voltage regulation in the system, the coupling effect between active and reactive powers, due to complex network impedance has to be considered. The modified P-Q-V droop control strategy is able to regulate the PCC voltage in low X/R ratio systems. The performance of typical and proposed droop control is compared and analysed.
As shown in [118], to improve the stability of parallel inverters in regards to boundedness and load sharing, the new droop named Bounded Droop Controller (BDC) is proposed. The BDC also introduces a bounded characteristic for the control output by considering the theory of Robust Droop Control (RDC). The closed loop stability of the system for the proposed bounded control method, regardless of the load type, (linear or nonlinear), is analysed via the small gain theorem. To increase the robustness of the controller against numerical errors and external disturbances, its structure is modified by forming an attractive oscillator scheme.
30
control method can extend the state of voltage emergency and keep it in the normal level.
To improve the reactive power sharing of DG units in AC micro grids, a new reactive power control technique is developed in [120]. The proposed control method is based on the operation of sharing error reduction and voltage recovery. The voltage bias of the droop characteristic curve is activated by the low-bandwidth synchronization signals and changed via sharing error reduction operation. The voltage recovery operation is performed to restore the output voltage to its rated value. Simple communications between the DGs has been considered to improve their power sharing and it does not affect the plug-and-play feature of each DG unit. As only a low bandwidth communication network is needed, it is recognised to be a cost effective and practical control method.
Another new load sharing method for parallel connected three phase VSCs is adopted in [121]. In this study the focus is on improving the frequency droop for real power sharing and developing a new droop control method for reactive power sharing. The improved frequency droop method operates on the phase angle of the VSC instead of frequency. To achieve the desired system response, the operator tunes the real power sharing controller without adding an integral gain term into the real power control algorithm to regulate the frequency. On the other hand, the new reactive power sharing applies integral the load bus voltage control, combined with a reference that is drooped versus reactive power output. The desired speed of response will be achieved by varying the gain of integrator without affecting voltage regulation
In [122] the operation of droop control is improved as the decentralized control strategies in DICs for autonomous power sharing. In this study the voltage restoration mechanism is applied in the Q-V droop control method to improve the reactive power sharing among DICs in the network. In the new reactive power-voltage droop control method, the voltage shows the rate of change of the voltage magnitude with time. The mentioned mechanism is proposed to maintain the magnitude of voltage at steady state.
31
There are several methods reported in [124]to simulate distribution systems over the last few decades. These network simulations are known as power flow and the most common calculation procedure is based on the solution of the non-linear equations of the studied network by means of a Newton-Raphson solver. Modified Newton Raphson (MNR) method is applied for implementation of the DG droop control method into a load flow through a novel approach for an islanded micro grid in [125].
In [62]it is reported that the recent increase of DGs in distribution networks has made necessary the development of new control strategies for the mitigation of power quality issues. One of these functions, considered as one of the most promising solutions for the management of voltage congestion, is represented by the droop control method of DG units. The traditional power flow formulation often does not allow for easy integration of