Recessive Host Range Mutants and Unsusceptible Cells That
Inactivate Virions without Genome Penetration: Ecological and
Technical Implications
Aaron P. Roznowski,aRobert J. Young,aSamuel D. Love,bAvenetti A. Andromita,bVanessa A. Guzman,bMargaret H. Wilch,b Ava Block,cAnne McGill,cMartine Lavelle,cAnastasia Romanova,cAimi Sekiguchi,cMeixiao Wang,cApril D. Burch,c
Bentley A. Fanea
aThe BIO5 Institute, University of Arizona, Tucson, Arizona, USA bTucson High Magnet School, Tucson, Arizona, USA
cBerkshire School, Advanced Math/Science Research Program, Sheffield, Massachusetts, USA
ABSTRACT Although microviruses do not possess a visible tail structure, one vertex
re-arranges after interacting with host lipopolysaccharides. Most examinations of host range, eclipse, and penetration were conducted before this “host-induced” unique vertex was discovered and before DNA sequencing became routine. Consequently, structure-function relationships dictating host range remain undefined. Biochemical and genetic analyses were conducted with two closely related microviruses, ␣3 and ST-1. Despite ⬃90% amino acid identity, the natural host of␣3 isEscherichia coliC, whereas ST-1 is a K-12-specific phage. Virions attached and eclipsed to both native and unsusceptible hosts; however, they breached only the native host’s cell wall. This suggests that unsus-ceptible host-phage interactions promote off-pathway reactions that can inactivate vi-ruses without penetration. This phenomenon may have broader ecological implications. To determine which structural proteins conferred host range specificity, chimeric virions were generated by individually interchanging the coat, spike, or DNA pilot proteins. In-terchanging the coat protein switched host range. However, host range expansion could be conferred by single point mutations in the coat protein. The expansion phenotype was recessive: genetically mutant progeny from coinfected cells did not display the phe-notype. Thus, mutant isolation required populations generated in environments with low multiplicities of infection (MOI), a phenomenon that may have impacted past host range studies in both prokaryotic and eukaryotic systems. The resulting genetic and structural data were consistent enough that host range expansion could be predicted, broadening the classical definition of antireceptors to include interfaces between protein complexes within the capsid.
IMPORTANCE To expand host range, viruses must interact with unsusceptible host
cell surfaces, which could be detrimental. As observed in this study, virions were in-activated without genome penetration. This may be advantageous to potential new hosts, culling the viral population from which an expanded host range mutant could emerge. When identified, altered host range mutations were recessive. Accordingly, isolation required populations generated in low-MOI environments. However, in lab-oratory settings, viral propagation includes high-MOI conditions. Typically, infected cultures incubate until all cells produce progeny. Thus, coinfections dominate later replication cycles, masking recessive host range expansion phenotypes. This may have impacted similar studies with other viruses. Last, structural and genetic data could be used to predict site-directed mutant phenotypes, which may broaden the classic antireceptor definition to include interfaces between capsid complexes.
KEYWORDS Microviridae, bacteriophage evolution, bacteriophage genetics, genome
penetration, host range,X174, unsusceptible host, virus-host interactions
CitationRoznowski AP, Young RJ, Love SD,
Andromita AA, Guzman VA, Wilch MH, Block A, McGill A, Lavelle M, Romanova A, Sekiguchi A, Wang M, Burch AD, Fane BA. 2019. Recessive host range mutants and unsusceptible cells that inactivate virions without genome penetration: ecological and technical implications. J Virol 93:e01767-18.https://doi .org/10.1128/JVI.01767-18.
EditorRozanne M. Sandri-Goldin, University of
California, Irvine
Copyright© 2019 American Society for
Microbiology.All Rights Reserved. Address correspondence to Bentley A. Fane, [email protected].
Received5 October 2018
Accepted5 November 2018
Accepted manuscript posted online14
November 2018
Published
crossm
17 January 2019
on November 6, 2019 by guest
http://jvi.asm.org/
T
he molecular events mediating early infection have been defined for many bacterial and animal viruses (1–6). This process begins with receptor recognition, perhaps the most critical extracellular factor governing host range. Accordingly, mutations in viral antireceptors are often necessary and sufficient to gain access to new hosts (7–11).Bacteriophage tail components recognize a diverse range of host cell receptors: monomeric proteins, multimeric complexes, lipopolysaccharides (LPS), peptidoglycan, and teichoic acids (12). For most nontailed and filamentous phages, unique vertices, spike complexes, or terminal proteins perform this function (13–16). Some phages require two receptors: one located on the cell wall’s outermost surface and a second one embedded within a membrane (17–19). In general, interactions with the initial receptor govern reversible attachment, whereas interactions with the secondary recep-tor are irreversible, inducing the conformational changes leading to penetration.
Considering the genetic tractability of most model phages, host range mutants have been isolated in relatively few systems. When isolated, mutations overwhelmingly alter the protein mediating irreversible attachment (8–10, 20). As is typical of mostenfants terribles,X174-like phages behave badly. Although they utilize only LPS as a receptor (21), host range mutations alter one of three structural proteins: the capsid, the spike, or the DNA pilot protein (22–27). Indeed, conformational changes involving all three structural proteins have been documented during early infection (28–30).
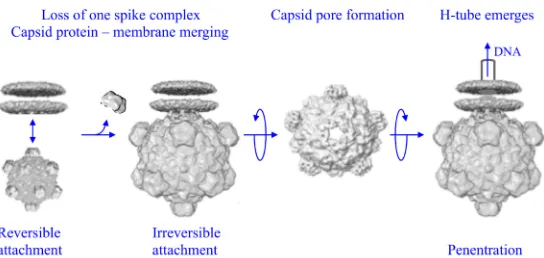
LPS outer core structure is the most critical, and perhaps the only, extracellular host range determinant of the X174-like phages (21). Reversible attachment may be mediated by conserved coat protein residues that form a six-carbon sugar binding site (Fig. 1). Although this has yet to be experimentally addressed, X-ray structures of the X174 capsid contain ordered sugars bound to these residues (31, 32). Moreover, Ca⫹⫹ ions, which facilitate attachment, structurally change this site from a nonbinding to a binding conformation (33).
Two lipid bilayer-attached structures derived from cryo-electron microscopy (cryo-EM) studies, pre- and post-DNA release, elucidate the conformational switches associ-ated with irreversible attachment, or eclipse. In both structures, the G protein spike at the lipid-interacting vertex has been removed (30). An annulus of coat protein residues merges with the lipid bilayer, anchoring the infecting virion to the membrane. In the post-DNA release structure, there is a pore at the attached vertex, presumably through which the DNA translocating conduit, or H tube, emerges and penetrates the cell wall (28, 29).
While the cryo-EM and X-ray structures demonstrate how three proteins can medi-ate attachment and penetration, without supporting genetic and biochemical data, the relationship to the host range remains obscure. The results of past studies are limited. First, most were conducted before DNA sequencing was commonplace. Thus, the identity of the host range-altering substitution remains unknown. Second, host strains
FIG 1Early microvirus infection. Reversible attachment, likely mediated by a six-carbon sugar binding site, is followed by the formation of a host-induced unique vertex. The infecting particle loses the G protein spike complex at the lipid-interacting vertex, and the capsid protein merges with the membrane. Five coat proteins rearrange, forming a pore through which the H tube, a DNA-translocating conduit, emerges from the particle.
on November 6, 2019 by guest
http://jvi.asm.org/
[image:2.585.70.342.69.198.2]were often poorly defined, many beingEscherichia coliC–K-12 hybrids. Thus, selections were unilateral, expanding host range to an alternative host. More detailed compari-sons would be facilitated if a naturally occurring microvirus of the alternate host is concurrently examined.
TheX174-like phages fall into three evolutionary clades, represented byX174, G4, and␣3 (34). With the exception of a few phages within the␣3 clade, which also use LPS as a receptor (35), all known phages share a host,E. coli C. Bacteriophage ST-1 is one of two knownE. coliK-12-specific microviruses (36). The three structural proteins that may govern host range, the viral coat, major spike, and DNA pilot proteins, respectively, display 91.4, 89.8, and 85.7% identity with those of bacteriophage ␣3, an E. coli C-specific phage. The three early infection stages, attachment, eclipse, and penetration, were biochemically characterized in both native and unsusceptible hosts. To comple-ment these biochemical assays, host range switching and expansion were genetically analyzed. During the course of this study, it became apparent that standard laboratory protocols, often deemed trivial, can greatly influence experimental results. Due to recessive phenotypes, standard protocols had to be altered. This phenomenon may have broader implications, influencing the results of other prokaryotic and eukaryotic virus host range research. Moreover, unsusceptible host interactions inactivated viruses, in essence culling the population from which an expanded host range mutant could emerge. This may reflect a novel facet of the virus-host arms race. Last, the genetic and biochemical data were easily interpreted within a structural context, allowing pheno-type prediction, which may expand the classic antireceptor definition to include interfaces between capsid complexes.
RESULTS
Virions reversibly and irreversibly attach to unsusceptible hosts but breach only native host cell walls.Reversible attachment, eclipse, and K⫹efflux assays were used to analyze phage-cell interactions with both permissive and unsusceptible hosts. To assay attachment, phages and cells were coincubated in a CaCl2-containing
starva-tion buffer at 16°C. Calcium ions promote reversible attachment (33), whereas low temperature and starvation prevent eclipse (37). Cells and attached phage were removed by centrifugation. Thus, supernatant titers directly reflect the unattached phage population. To analyze the next entry step, eclipse or irreversible attachment, the pellets were resuspended in a CaCl2-containing nutrient broth preheated to 37°C.
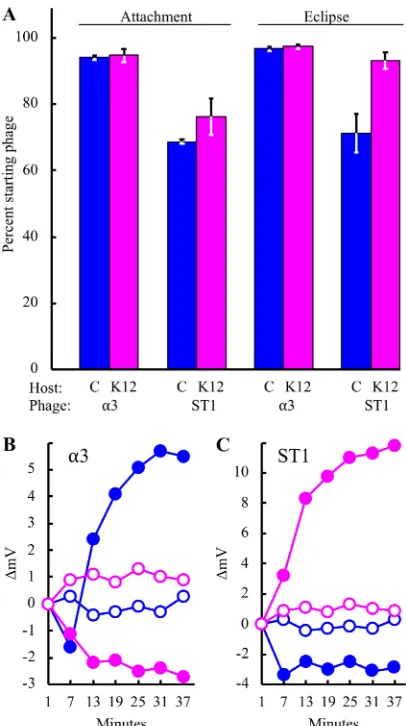
Uneclipsed particles were removed by the addition of EDTA, which chelates the Ca⫹⫹ ions. For ␣3, no significant differences in attachment or eclipse efficiencies were observed as a function of host range (Fig. 2A). In contrast, some statistical differences were observed for ST-1. However, they are likely too small to account for the⬍10⫺10
titer on theE. coliC host.
During penetration, many phages create a conduit connecting the phage particle with the host’s cytoplasm. Potassium ions, the cells’ primary osmolyte, diffuse through this channel (38–40). Thus, K⫹efflux assays detect virus-mediated cell wall breaches. Phages were preattached to cells at 4° to inhibit eclipse. Afterwards, infected cultures were diluted into K⫹-free buffer at 37°, and extracellular K⫹levels were monitored as described in Materials in Methods. In contrast to previous experiments, biologically significant differences were observed. Efflux occurred only when the phages were incubated with their respective permissive hosts (Fig. 2B and C). Negative readings of the change in potential (in millivolts) were observed when phages were added to unsusceptible hosts, suggesting K⫹uptake. However, the initial cell and phage prep-arations lacked significant K⫹levels. This effect may be caused by an influx of trace NH4⫹ions present in the phage preparations. NH4⫹, when above 2.7 ppm, can interfere
with K⫹-selective electrodes when K⫹concentrations are at or below 1 ppm. All efflux experiments were conducted using the same cell and phage preparations. Thus, trace ion effects should be the same in all experiments but are masked when K⫹efflux occurs.
on November 6, 2019 by guest
http://jvi.asm.org/
Host range correlates with the viral coat protein found in␣3–ST-1 chimeric particles. To determine whether interchanging individual structural proteins altered host range, chimeric particles were generated by separately interchanging the viral coat F, major spike G, and DNA pilot H proteins. To interchange the G and H proteins, the corresponding genes were cloned and used to complement ␣3 and ST-1 nonsense mutants. Chimeric phages were generated in their permissive hosts and subsequently assayed for plaque formation on their unsusceptible hosts, both expressing the appro-priate cloned gene. For example, ␣3 am(G) phage was initially grown in E. coli C expressing the ST-1 G gene, which complemented as well as the␣3 gene. The resulting progeny were then plated onE. coliK-12 expressing the ST-1 G gene. Plating efficiency was less than 10⫺6. Similar results were obtained for the other three chimeric particles.
Thus, the G and H proteins were interchangeable but did not alter host range. Cloned coat F gene induction was too toxic to conduct complementation assays as described above. Therefore, chimeric particles were generated via recombination as described in Materials and Methods. Briefly,E. coliC cells harboring the cloned ST-1 F gene were infected with wild-type␣3. For ST-1, K-12 cells contained the cloned ␣3 gene. Putative recombinants were identified by plaque formation on the parental phage’s unsusceptible host. They were recovered for both phages (frequency,⬃10⫺5). FIG 2Attachment, eclipse, and penetration as a function of host range. The permissive host for␣3 isE. coliC, whereas ST-1 is a K-12-specific phage. (A) Attachment and eclipse experiments were performed in triplicate. The host cells and phages used in each experiment are given in the figure. Error bars represent standard deviations. (B and C) ␣3- and ST-1-induced K⫹ efflux. Phages were incubated with their respective permissive hosts, as indicated. Filled blue symbols,E. coliC; filled magenta symbols,E. coli K-12; open blue symbols,E. coliC alone; open magenta symbols,E. coliK-12 alone.
on November 6, 2019 by guest
http://jvi.asm.org/
[image:4.585.104.307.71.434.2]Subsequent plating assays were used to determine whether host range had expanded or switched entirely. Both phenotypes were observed. Members of each phenotypic class had their coat protein genes sequenced (Table 1 and Fig. 3).
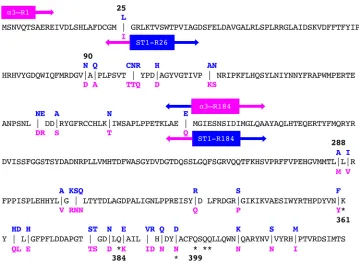
Figure 3 contains the amino acid sequences of both phages, which are ⬃90% identical. Although differences were observed throughout the sequence, they tended to cluster in small groups. Due to highly similar viral genome sequences, it was not possible to determine precise recombination junctions. Therefore, recombinant names reflect the position of the first amino acid categorically encoded by the donor gene. Thus, the name␣3-R184 describes an␣3 parent in which all gene F codons after and
TABLE 1Host range of coat protein chimeric virions
Phagea
Coat protein
composition (%)a Plating efficiency on:b
␣3 ST-1 E. coliC122 E. coliK-12
Wild-type␣3 100 0 1.0 ⬍10⫺10
␣3-R1 0 100 ⬍10⫺6 1.0
␣3-R184 43 57 0.9 1.0
Wild-type ST-1 0 100 ⬍10⫺10 1.0
ST-1–R26 6 94 1.0 ⬍10⫺4
ST-1–R184 43 57 0.4 1.0
aCoat protein composition and mutant phage nomenclature were derived from the coat protein sequence.
The designations indicate the first amino acid that is identical to the foreign protein sequence within the recombinant strain. For example, the coat protein sequence found in strain␣3-R184 becomes identical to the ST-1 sequence at residue 184. With the exception of the coat protein gene, or a portion thereof, the remaining genome is derived entirely from␣3. Both coat proteins are 431 amino acids in length.
bPlating efficiency is defined as assay titer/most permissive titer. Thus, if the assay and most permissive titers
were obtained on the same host, the plating efficiency was reported as 1.0.
FIG 3Amino acids sequences of the␣3 and ST-1 coat proteins. Identical amino acids are depicted in black text on the central line, whereas diverged amino acids are indicated with blue (␣3) and magenta (ST-1) text, above and below the central line, respectively. The junctions found in recombinants are given by the positions of the colored boxes. Colors and arrows indicate which viruses donated the sequence. For example, the coat protein sequence of ␣3-R1 is 100% identical to ST-1. Thus, it is positioned at the beginning of the sequence and is shown in magenta. In contrast, the first 183 amino acids in the␣3-R184 coat protein are derived from␣3, as indicated by the blue leftward arrow. The remaining amino acids are derived from ST-1. Asterisks indicate sites at which point mutations conferred PA phenotypes in␣3.
on November 6, 2019 by guest
http://jvi.asm.org/
[image:5.585.41.400.399.661.2]including 184 were donated by the ST-1 gene (Fig. 3). As can be seen in Table 1, host range correlates with the coat protein. ␣3-R1, which now synthesizes the ST-1 coat protein, forms plaques only onE. coliK-12. ST-1–R26, which produces the␣3 protein with the exception of one amino acid, is anE. coliC-specific phage. In contrast, chimeric coat proteins (␣3-R184 and ST-1–R184) expand host range to both cell types.
Expanded host range mutations are recessive.In most genetic selections using microviruses, single gain-of-function mutations typically appear at frequencies between 10⫺4and 10⫺6(41–48). However, unsusceptible host plating efficiencies were less than
10⫺10(Table 1) when standard phage stocks were used, which are incubated until total
cell lysis is achieved. Moreover, unsusceptible host cell growth was unaffected despite draconian multiplicity of infection (MOI) values between 100 to 1,000. This tight restrictive phenotype may indicate that altering host range requires multiple muta-tional events. However, one␣3 expanded-host-range mutant was isolated. Despite the 10⫺11isolation frequency associated with the ␣3 polyamorous (PA) mutant, only a
single G ¡A transition was found within the entire genome. It conferred a D¡N substitution in the viral coat protein. The structural consequences of this substitution, as well as of other PA mutations, are discussed below. The exceptionally low isolation frequency of a single transition suggested that an additional level of genetic complexity was affecting the selections.
Both hosts lack restriction modification systems. E. coli C is naturally restriction negative (49), whereas the K-12 strain (IJ1133) has been genetically modified (50). However, the presence of an unknown or uncharacterized restriction modification system could explain the low mutant isolation frequency. To test this hypothesis, the␣3 PA mutant was propagated in each host. Afterwards, progeny titers were determined on bothE. colistrains. The titers did not significantly differ (data not shown); thus, the existence of an unknown restriction system seemed unlikely.
Alternatively, the PA phenotype may be recessive. Unlike functions governing intracellular growth, host range can operate on the extracellular level. Consequently, the MOI of the previously infected cell can influence phenotype penetrance and mutant isolation frequency. In this model, a PA genome packaged within a capsid containing both wild-type (WT) and PA coat proteins may not infect the new host. Viral stock preparations are designed to produce the highest possible titers. To allow for multiple propagation cycles, the culture’s initial MOI is very low. However, cultures incubate until all cells have been infected and slaughtered. Consequently, the last growth cycles occur at MOIs favoring coinfections. To test this hypothesis, a dominance assay was per-formed. Lysis-resistant cells were coinfected with a PA and non-PA parent at various ratios (Table 2). The non-PA parent contained an amber mutation in the H gene, which
TABLE 2Expanded host range is recessive
Parental MOI
Frequency of gene H
complementation-independent progeny determined on:a
PPVb am(H)strain PA E. coliK-12 E. coliC
0.5 0 ⬍10⫺6 10⫺5c NA
0 0.5 0.7 1 0.7d
0.5 0.5 0.08 0.5 0.16
5 0.5 1.5⫻10⫺3 0.15 1.0⫻10⫺2
10 0.5 5.0⫻10⫺4 0.1 5.0⫻10⫺3
aThe titer of gene H complementation-independent progeny was determined by plating onsup°strains ofE. coliC and K-12, which select against the non-PAam(H)parent.
bPPV, phenotype penetrance value, conveys the percentage of genetically PA individuals, inferred by the
absence of theam(H)mutation, that display the PA phenotype, determined by the ability to form plaques onE. coliK-12. The PPV was calculated as the ratio of the given frequencies forE. coliK-12 toE. coliC.
cThis value established experimental background: the loss of theam(H)phenotype via either reversion of
recombination with the cloned␣3 H gene. The total titer was determined withE. coliC cells expressing the cloned␣3 H gene.
dThis value established the background level arising from natural differences in plating efficiencies.
on November 6, 2019 by guest
http://jvi.asm.org/
was complemented by a cloned ␣3 H gene. The resulting progeny could be distin-guished by three differential plating assays.
1. For total progeny, the titer onE. coliC cells expressing the cloned␣3 H gene. 2. For genetically PA progeny regardless of PA phenotype, the titer on E. coliC
without the cloned␣3 H gene, which selects against the non-PAam(H)parent. 3. For genetically and phenotypically PA progeny, the titer onE. coliK-12.
PA phenotype penetrance is classically defined as the percentage of genetically PA individuals displaying the associated phenotype. It can be determined with the follow-ing formula:phenotype penetrance value(PPV)⫽titer inE. coliK-12 cells/titer inE. coli C without the cloned␣3 H gene.
In these experiments, the MOI of the PA parent was kept constant at 0.5, whereas the non-PA parental MOI varied from 0.5 to 10. At the higher MOIs (⬎5), nearly all PA-infected cells will be coinfected with the non-PA parent. Thus, PA genomes will likely be packaged into heterogeneous capsids as described above. If the PA phenotype is recessive, the phenotype penetrance value will decrease as the non-PA parent MOI increases. As can be seen in Table 2, the PPV dropped nearly three orders of magnitude. Population life history influences mutant isolation frequencies.If the PA phe-notype is recessive, as the data suggest, the population’s life history could significantly influence mutant isolation. If the population was derived from coinfected cells, fre-quencies could be misleadingly low. To test this hypothesis, genetic selections were performed with populations generated without coinfections. Several techniques were employed: use of overlay plates, plating of permissive host infectious centers with unsusceptible hosts, terminating stock preparation before culture lysis, and low-MOI infections with lysis inhibition. Of all four techniques, the lysis inhibition protocol was the most efficient and least problematic and was easily incorporated into high school curricula. The technical advantages and drawbacks of each method and how they can be integrated into high school curricula are detailed in the Materials and Methods section.
Regardless of protocol,␣3 PA mutants were isolated at a frequency of⬃10⫺5, which
is consistent with the generation of single point mutations. Although these mutants form plaques on both hosts, plaque morphology was noticeably smaller onE. coilK-12. In contrast, no altered host range ST-1 mutants were isolated by these techniques. In this instance, the low isolation frequency may truly indicate that multiple mutational events are required.
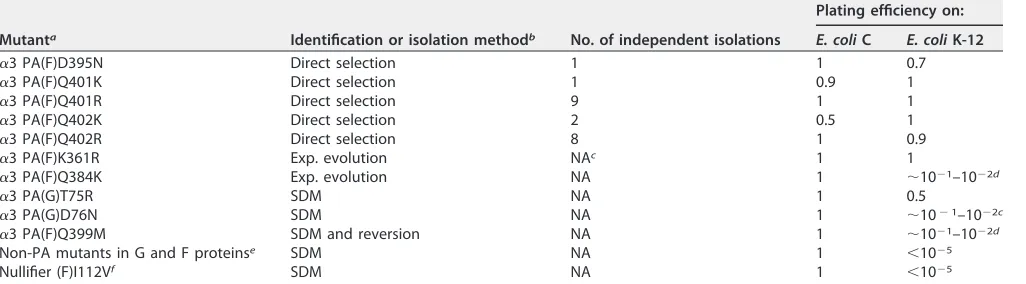
The ␣3 PA substitutions localize to a protein-protein interface.The PA muta-tions identified by direct selecmuta-tions are listed in Table 3 (first five entries). Five genetically distinct substitutions altered three coat protein residues. The mutant ge-nomes were sequenced, and no other substitutions were found, suggesting that the identified mutations were both necessary and sufficient to confer the PA phenotype. Although more than 10 independent sources were used, it is unlikely that the selections went to saturation. Two mutations, D395N and Q401K, were independently isolated once whereas the Q401R and Q402R mutations were isolated from almost every independently prepared population. The positions of these amino acids, as well as other substitutions conferring the PA phenotype (see below), are indicated with asterisks in Fig. 3 and identified within the␣3 X-ray structure (Fig. 4). Only the D395N mutation is located directly at a diverged residue between␣3 and ST-1. The amino acid in the ST-1 sequence is asparagine.
To identify other mutations, the existing PA mutants were experimentally evolved on both hosts. Wild-type␣3 was similarly treated onE. coliC to identify mutations that may arise from the passaging technique (see Materials and Methods). Nineteen ge-nomes were selected for whole-genome sequence analysis. Numerous substitutions were identified in each genome. However, many of them may not directly affect host range. Therefore, only mutations exclusively found in E. coliK-12-evolved genomes were selected for further analysis: coat protein substitutions K361R and Q384K. To
on November 6, 2019 by guest
http://jvi.asm.org/
determine whether these mutations affected host range, they were placed in a wild-type background and assayed for plaque formation onE. coliK-12. As can be seen in Table 3, both mutations conferred the PA phenotype.
All of the PA mutations substitute a more basic amino acid for the wild-type residue, as follows: K¡R (361), Q¡R (401 and 402), Q¡K (384, 401, and 402), or D¡N (395). Unlike the other mutations, the Q384K mutation conferred a very weak PA phenotype (Table 3). Moreover, in the ␣3 crystal structure (51), it is not located near the other substitutions, which reside within the outer circumference of the coat-spike protein interface (Fig. 4A, B, and C).
Mutations conferring the PA phenotype can be predicted, albeit in a limited manner.The locations of the four sites conferring the strongest PA phenotypes, D395, Q401, Q402, and K361, cluster with their side chains oriented toward a descending loop of the major spike protein G (Fig. 4C). Chemically, the PA substitutions are more basic than the wild-type residues. These observations suggest that PA phenotypes may be predictable, a hypothesis tested by site-directed mutagenesis.
Mutations in both the F and G genes were designed to replace the wild-type residues with more basic ones. Based on location and side chain orientation, G protein substitutions at T75 and D76 were predicted to confer the PA phenotype, whereas substitutions at I177, H178, and Q181 were not expected to alter host range. With the exception of the D76 mutagenesis, primers contained ARA at the target site, encoding either lysine (AAA) or arginine (AGA). Codon D76 was changed to AAC (asparagine). Mutagenized DNA was transfected into bothE. coliC and K-12 cells. The T75 and D76 reactions produced plaques on both hosts. Two mutants were recovered, T75R and D76N, and both displayed the PA phenotype (Table 3). Reactions with cells expressing I177, H178, and H181 of the G gene produced plaques only onE. coliC. I177R, I177K, H178K, Q181K, and Q181R mutants were recovered on that host but did not alter host range;E. coliK-12 plating efficiencies were four orders of magnitude lower than those obtained onE. coliC.
[image:8.585.42.555.85.227.2]In the capsid protein, PA phenotypes were predicted for substitutions at S400 but not at Q399 and L404. However, the results were more complex. Transfection plates were incubated at both 30°C and 37°C. With one exception (see below), plaques developed only onE. coliC. The coat F genes were sequenced (n⬎12) and all were wild type. Typically, in our laboratory, viable mutants represent 25% to 50% of recovered progeny. Thus, these negative results may indicate lethal phenotypes. Alternatively, mutating these codons may be technically problematic. However, an unintended
TABLE 3Plating efficiencies of PA mutants
Mutanta Identification or isolation methodb No. of independent isolations
Plating efficiency on:
E. coliC E. coliK-12
␣3 PA(F)D395N Direct selection 1 1 0.7
␣3 PA(F)Q401K Direct selection 1 0.9 1
␣3 PA(F)Q401R Direct selection 9 1 1
␣3 PA(F)Q402K Direct selection 2 0.5 1
␣3 PA(F)Q402R Direct selection 8 1 0.9
␣3 PA(F)K361R Exp. evolution NAc 1 1
␣3 PA(F)Q384K Exp. evolution NA 1 ⬃10⫺1–10⫺2d
␣3 PA(G)T75R SDM NA 1 0.5
␣3 PA(G)D76N SDM NA 1 ⬃10⫺1–10⫺2c
␣3 PA(F)Q399M SDM and reversion NA 1 ⬃10⫺1–10⫺2d
Non-PA mutants in G and F proteinse SDM NA 1 ⬍10⫺5
Nullifier (F)I112Vf SDM NA 1 ⬍10⫺5
aMutant names reflect the protein, position, and substitutions conferring the PA phenotype. For example, PA(F)D395N reflects a D¡N substitution at position 395 in
the coat F protein.
bExp. evolution, experimental evolution; SDM, site-directed mutagenesis; SDM and reversion: site-directed mutagenesis followed by a reversion event (see text for
details).
cNA, not applicable.
dThe PA phenotype was extremely weak, as reflected by low variable plating efficiencies and pathetic, pinprick-size plaques.
eThe following non-PA mutations occurred in G protein: I177R, I177K, H178K, Q181K, and Q181R. In F protein, a D395R non-PA mutation was present. fThis mutation nullified the PA phenotype in Q401K, Q401R, Q402K, Q401R, D395N genetic backgrounds.
on November 6, 2019 by guest
http://jvi.asm.org/
mutation was recovered. It contained a methionine codon at Q399, likely arising from a spontaneous event after site-directed mutagenesis, for example, CAG (Q)¡ AAG (K)¡ATG (M), or from a contaminating primer.
While the recovery of the Q399M mutant argues against technically problematic site-directed mutagenesis, the argument falls short of being compelling. To more rigorously determine whether substitutions were lethal, recombination rescue experi-ments were performed with cloned genes containing the S400K, S400R, L404K, or L404R mutation. On thesup° host without a plasmid, the plating efficiency of a strain with an amber mutation in the F gene at Q399 [am(F)Q399] was five orders of
FIG 4The location of PA substitutions within the␣3 X-ray structure. (A and B) Space-filling renderings of the␣3 X-ray structure. The coat F protein is depicted in white, and the spike G protein is in magenta. The PA substitutions are depicted in blue. One G protein spike has been removed (B) to illustrate the location of PA substitutions within the F-G protein interface. (C) The F-G interface. The PA substitutions and coat and spike proteins are colored as described for panels A and B. Numbers depict the amino acids’ locations within the primary structure. (D) Phenotypes of site-directed mutations. Side chain colors are as follows: blue, substitutions conferring the PA phenotype; gray, substitutions that did not alter host range; black, substitutions likely conferring a lethal phenotype.
on November 6, 2019 by guest
http://jvi.asm.org/
[image:9.585.43.546.70.555.2]magnitude below the permissive titer. Thus, 10⫺5 represents the background am⫹ reversion frequency. Plating efficiency rose to⬃10⫺3in the presence of the uninduced,
cloned wild-type gene, reflecting a recombination frequency two logs above back-ground. In contrast, plating efficiency with the mutant plasmids was equal to theam⫹ reversion frequency. Thus, the inability to recover these mutant phages suggests that the substitutions confer a lethal phenotype. However, the underlying molecular basis of the lethal phenotype cannot be determined with this genetic assay.
Exceptions to rules governing phenotype prediction. The unintended Q399M mutant was isolated onE. coliK-12. Thus, it was subjected to selective pressure beyond viability, i.e., expanded host range. The mutation introduces a more hydrophobic amino acid that conferred a very weak PA phenotype (Table 3). Unlike the side chains at the neighboring PA sites, which are oriented toward the G protein spike, the Q399 side chain descends into the capsid. A more hydrophobic descending side chain, one oriented into the capsid, may affect the F-G interface in the same way as a more basic, ascending side chain. The general rule also suggests that a D395R substitution, like D395N, would similarly alter host range. However, it did not; theE. coliK-12 plating frequency was less than 10⫺5. Last, residue Q384 is not in the F-G interface, yet Q384K
conferred a weak PA phenotype. As visualized in the cryo-EM structure of an infecting virion (30), this residue may affect a nearby lipid-interacting ring.
Reversion of the PA phenotype and structural data may identify another coat region governing host range.As described above, PA mutants were experimentally evolved on bothE. coliC and K-12 cells. Afterwards, approximately 50 plaques were assayed for host range phenotypes differing from their respective parents. All assayed plaques arising from passages throughE. coliK-12 retained the ability to form plaques onE. coliC. In contrast, Q402R and Q402K lineages evolved onE. coliC gave rise to strains that lost the PA phenotype. A common coat protein substitution was found in both lineages, i.e., I112V. To determine whether this mutation was both necessary and sufficient to nullify the PA phenotype, it was placed directly into the Q401K, Q402R, Q402K, Q402R, and D395N genetic backgrounds. In all instances, the K-12 plating efficiency fell more than five orders of magnitude. Thus, the I112V mutation nullified the PA phenotype. Residue I112V is not in the F-G interface. Instead, it resides within the aforementioned lipid-interacting ring (30).
DISCUSSION
Host-mediated virus inactivation and its evolutionarily significance. Despite structural proteins displaying⬃90% identity, bacteriophages␣3 and ST-1 infect differ-entE. colistrains. Extracellular tropism can be divided into three stages: (i) attachment, (ii) eclipse, defined as host-mediated inactivation, and (iii) penetration, which involves breaching the cell wall and subsequent genome transport. Regardless of the permis-sive/unsusceptible nature of the host, attachment and eclipse did not appear to be affected. However, phages could breach only their permissive host’s cell wall. In the unsusceptible host, eclipse leads to an off-pathway reaction that inactivates the infect-ing particle. Thus, samplinfect-ing unsusceptible host surfaces can have negative conse-quences that could influence evolutionary trajectories in natural environments. While detrimental to the virus, at least in the laboratory setting, this could be evolutionarily advantageous to potential hosts, perhaps representing a prophylactic strategy in the virus-host arms race. The potential host culls the population from which an expanded host range mutant can emerge. Alternatively, this may be a consequence of lab adaptation in which a virus, removed from its natural multihost environment, is continually propagated in one cell type. In a homogeneous host environment, selective pressure to avoid harmful nonhost cell interactions, if they existed, would be greatly relaxed.
The genetics of host range expansion and switching.The host ranges of bacte-riophage␣3 and ST-1 were switched by interchanging their viral coat proteins. Thus, by strict definition, the viral coat protein is both necessary and sufficient to change host
on November 6, 2019 by guest
http://jvi.asm.org/
range. However, genetic data suggest that there is a distinction between host switching and expansion, which is conferred by recessive, single point mutations.
Unlike dominant and recessive phenotypes associated with intracellular processes, readily discerned by coinfection burst sizes, phenotypes governing extracellular phe-nomena affect the next generation. When genetically PA genomes were packaged into heterogeneous particles composed of wild-type and PA coat proteins, the phenotypic penetrance was greatly reduced (Table 2). Consequently, ␣3 PA mutants were effi-ciently isolated only from populations generated in low-MOI environments. Single mutants arose at a 10⫺4 to 10⫺5 frequency from those samples. In contrast, when
selections were conducted with standard, high-titer stocks, the frequency was⬃10⫺11.
To generate the high titers favored by most researchers, cultures are incubated until all cells produce progeny. Therefore, most cells will be coinfected in the final stages of stock growth. If the proteins governing host range operate within complexes, e.g., trimeric tail spikes, baseplates, multimeric spikes or an entire capsid, the population’s coinfection life history will affect selections. Dominant alleles will be favored, whereas recessive ones will be under-isolated or undetected (8–10, 25). A similar phenomenon has been documented for antibody escape mutants (52), which are significantly underestimated in populations containing heterogeneous particles.
The relative effect of the population’s life history may vary depending on whether the phage encodes some sort of superinfection exclusion mechanism and/or the ability to lysogenize its host. Two superinfection exclusion mechanisms have been docu-mented inX174 (53, 54), which is a lytic phage. However, there is a temporal aspect to superinfection exclusion: the excluding phage must first establish an infection. Indeed, superinfection exclusion was experimentally defined using delayed secondary infection protocols (53, 54). Thus, simultaneous or nearly simultaneous coinfections could occur during multiround, standard stock preparation, especially if the infections are somewhat synchronized. The penultimate burst would rapidly change the culture from a low- to a high-MOI environment.
ST-1 host range could be switched by interchanging the ST-1 coat protein with␣3. However, no PA mutants could be isolated regardless of the population’s life history. When␣3 PA mutants were experimentally evolved inE. coliC, a second, PA-nullifying, site mutation emerged. If the ST-1 coat protein naturally contains a nullifying amino acid, host range expansion may require two mutations: the acquisition of a PA mutation and the loss of the nullifier. The “nullifying” label is entirely semantic, reflecting the isolation of the nullifying mutation after the PA mutations. Nonetheless, its existence demonstrates that small, often ignored, conservative differences between indepen-dently lab-adapted wild-type strains can have experimental consequences. Seemingly different yet rigorously generated and analyzed data sets may all be correct.
The structural basis of host range, receptor interactions, and phenotype pre-diction.When visualized within the␣3 virion structure, most of the coat protein PA mutations clustered to the outer circumference of the coat-spike interface. The substi-tutions were more positively charged than the wild-type amino acid residues. More-over, side chains were oriented toward a descending G protein insertion loop. This suggested that PA phenotypes could be predicted, at least within the limited context of the hosts and phages used in this study. To test this simple hypothesis, charges were introduced into the descending G protein insertion loop (Fig. 4), which resulted in the PA phenotype (Table 3). In contrast, alterations in side chains oriented away from this region did not expand host range. However, two observations suggest that the initial hypothesis requires refinement: (i) some substitutions conferred lethal phenotypes, which precluded host range examination, and (ii) the introduction of a more hydro-phobic amino acid (Q ¡ M) with a descending side chain also conferred a PA phenotype, albeit a weak one.
The viral antireceptor may be an interface between protein complexes.Crill and colleagues examined evolutionary reversals whenX174 was adapted by repetitively switching between two permissive deep-rough LPS hosts (55). Similar to our results,
on November 6, 2019 by guest
http://jvi.asm.org/
they identified three fitness-elevating coat protein residues located on the outer circumference of the coat-spike interface (Fig. 5). Although the experimental ap-proaches differed, the collective results are very consistent with the cryo-EM recon-struction of infecting particles, further indicating that G spike removal is critical to early infection (30). This may broaden the classical concept of viral antireceptors to structural interfaces between protein subassemblies. The contrasting phenotypes of G protein PA substitutions and the G protein chimeric viruses further support the importance of the interface. The chimeras, generated by exchanging the entire G protein between␣3 and ST-1, did not exhibit altered host ranges. However, the F-G interface would not be identical in these strains. The limited differences between the␣3 and ST-1 G protein primary structures are confined to the folded proteins’ apical regions. In contrast, G protein PA substitutions affect the interface located on the basal surface.
Multiple interactions with a single receptor most likely govern early infection. Many bacterial viruses require primary and secondary receptors. Primary receptors are usually located on the host’s exterior surface (e.g., LPS, teichoic acid, and pili) and typically mediate reversible attachment. The second receptor, which induces penetra-tion, is often a membrane protein (17–19). Although LPS appears to be the only receptor used byX174-like viruses (21), distinct LPS-virion interactions may mimic a multiple-receptor system. Both structural and genetic data support this model.
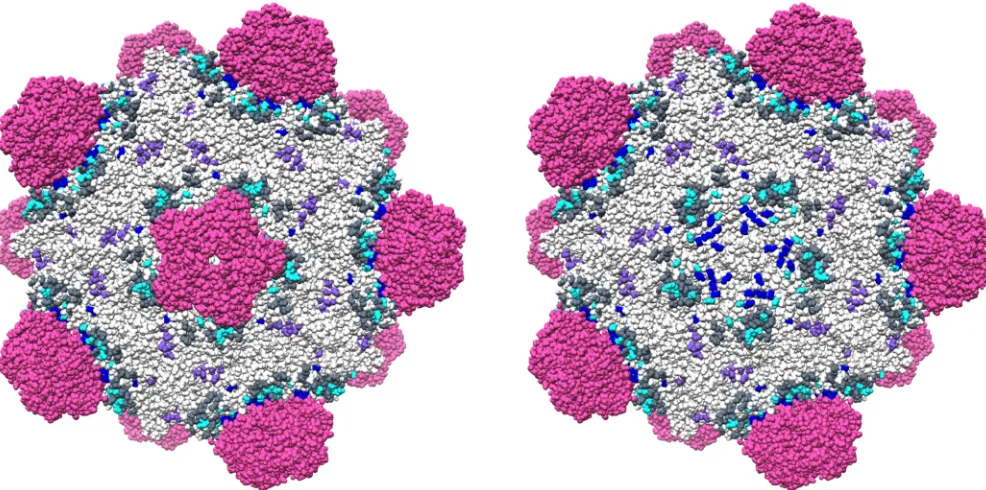
Figure 5 illustrates the amino acids genetically identified to affect X174 and ␣3 host range. It also depicts residues identified in X-ray and cryo-EM studies that may play a role in early infection. A six-carbon sugar binding site, located near the 3-fold axis of symmetry (Fig. 5, purple residues), may govern reversible attachment. Although its direct role has yet to be experimentally addressed, X-ray structures show bound sugar molecules (31, 32). Moreover, Ca⫹⫹ions, which facilitate attachment, change this site from a nonbinding to sugar binding conformation (33). This interaction is followed by at least two additional LPS-mediated reactions: (i) spike removal and (ii) capsid protein
FIG 5Structurally and genetically defined residues governing host range and extracellular virus-host interactions inX174 and␣3. The image depicts the␣3 structure. The root mean square deviations between equivalent C␣atoms of theX174 and␣3 coat proteins, which share 72% sequence identity, is only 0.8 Å (51). Thus, equivalentX174 residues could be reasonably mapped onto the␣3 virion. Mutations identified in this study are shown in dark blue. Primarily residing within the coat F-spike G protein interface, they are more easily visualized when a spike complex is removed (right image). Mutations identified in X174 studies (26, 55) are depicted in cyan. The residues of the conserved six-carbon sugar binding site are highlighted in purple (31–33). The bulge-forming EF insertion loop, which contains the residues that merge with the lipid bilayer (30), is depicted in dark gray. The images were generated using Chimera (62) and Protein Data Bank accession code1M06.
on November 6, 2019 by guest
http://jvi.asm.org/
[image:12.585.45.538.73.318.2]melding with the lipid bilayer. Although the exact residues merging with the cell membrane are not known, they all reside in the EF insertion loop that extends from the coat protein’s jelly roll fold. Some residues within this loop form a bulge surrounding the 5-fold axis of symmetry (Fig. 5, dark gray). Like the nullifying mutation described in this study, other host range-affecting mutations map to this region (26, 55).
Standard laboratory techniques: less can be more. During the course of this study, it became apparent that standard laboratory techniques and protocols, often deemed trivial, can greatly influence experimental results. The PA mutants isolated in this study had a recessive phenotype. If not for the first author’s tenacity or dumb luck isolating the initial mutant (frequency, 10⫺11), the study would have been terminated.
Either no conclusion or incorrect ones would have been drawn. In this instance, standard virus stock preparation, a⫹50-year practice, never questioned and falsely deemed adequate for any experiment, could have greatly influenced outcomes. During viral penetration and genome trafficking, proteins often operate in complexes which were assembled in the previously infected cell. As demonstrated here, the recovery of recessive gain-of-function mutants can be highly influenced by the life history of the population subjected to selective pressure.
MATERIALS AND METHODS
Phage plating, media, buffers, and stock preparation.Plating, media, buffers, and standard stock preparation have been previously described (56).
Bacterial strains.The wild-typeEscherichia coliC strain C122 and derivatives BAF5 (supE) and BAF8 (supF) have been previously described (56, 57). RY7211 contains a mutation in themraYgene, conferring resistance to viral E protein-mediated lysis (58). TheE. coliK-12 strain IJ1133 was genetically modified to eliminate restriction modification systems (50).E. coliC is naturally devoid of restriction modification systems (49). IJ1198 and IJ1220 are respectivesupFandsupEderivatives of IJ1133 (50).
Cloning of␣3 and ST-1 genes.To clone the␣3 and ST-1 coat F genes, nucleotides 3067 to 4362 (59) were PCR amplified with primers with introducing upstream NcoI and downstream HindIII sites. To clone the ST-1 spike G gene, nucleotides 4348 to 4985 were PCR amplified with primers introducing upstream NcoI and downstream EcoRI sites. To clone the␣3 spike G gene, nucleotides 4366 to 4961 were amplified by primers introducing upstream NcoI and downstream AleI sites. To clone the ST-1 DNA pilot H gene, nucleotides 5063 to 42 were amplified with primers introducing upstream SacII and downstream XhoI sites. And, last, to clone the␣3 pilot H gene, nucleotides 5083 to 6089 were amplified with primers introducing upstream BglII and downstream XhoI sites. The PCR products were digested with the specified enzymes and ligated into pSE420 DNA (Invitrogen) digested with the same enzymes.
Mutations were introduced into the cloned␣3 F gene by amplifying the entire plasmid with Q5 DNA polymerase (NEB) with abutting primers, one of which introduced the desired mutation. The PCR product’s 5=hydroxyl termini were phosphorylated, and ends were ligated using T4 polynucleotide kinase and ligase (NEB), respectively. The nucleotide sequences of all clones were verified by a direct DNA sequencing analysis.
Construction of␣3 and ST-1 chimera via recombination.E. coliC cells harboring the cloned ST-1 F gene were infected with wild-type␣3. For ST-1, K-12 cells contained the cloned␣3 F gene. Thirty-milliliter cell cultures were grown to a concentration of⬃108cells/ml, infected at an MOI of⬃10⫺5, and
incubated for 2 h. Cultures did not incubate until lysis. After the addition of lysozyme, titers of cultures were determined on both permissive and unsusceptible hosts. Putative recombinants were identified as described in Results.
Site-directed phage mutants of␣3.Single-stranded viral DNA was isolated by the OLT (Our Little Trick) protocol, which has been previously described (41). Mutations were introduced by amplifying the entire genome with abutting primers, one of which introduced the desired mutation. The PCR products were treated as described above. The resulting ligation products were transfected into C122. If the ligation product contained an amber mutation, BAF5 (supE) was transfected.
Attachment, eclipse, and Kⴙassays.Attachment and eclipse assays have been previously described
(60, 61). K⫹efflux assays, modeled after a previously published protocol (38), were performed by first growing cells to an optical density at 660 nm (OD660) of 0.08 in TKY medium (1.0% tryptone, 0.5% KCl,
0.5% yeast extract) at 37°C. Cells were pelletized and washed in an equal volume of SM buffer (100 mM NaCl, 10 mM MgSO4, 50 mM Tris, pH 7.5), washed again in 1/10th the volume of SM buffer, and
resuspended in 1/100th the volume of iced SM buffer containing 10 mM MgCl2and 5.0 mM CaCl2. The
cell culture was divided into 1.0-ml aliquots and kept on ice, and chilled phage was added at an MOI of 75. Presumably, high MOIs are required to detect the efflux signal (38–40). Iced SM buffer containing MgCl2and CaCl2was added to equalize aliquot volumes. Cultures were incubated for 15 min on ice to
allow phage preattachment. At 1.0-min intervals, cultures were diluted 10-fold into SM buffer containing MgCl2and CaCl2preheated to 37°C. Immediately after dilution, an Orion IonPlus potassium electrode
(Thermo Scientific) connected to a Sartorius PB-11 pH meter was inserted into an infection, and a reading was taken after 1.0 min. This electrode was then rinsed with distilled H2O, blotted dry, and placed into
the dilution of the subsequent infection. The electrode was rotated between infections at 1-min intervals once all infections were diluted.
on November 6, 2019 by guest
http://jvi.asm.org/
Genetic selections with populations generated in low-MOI environments.Four different tech-niques were used to obtain populations generated in low-MOI environments, as follows. One method used an overlay protocol, whereby⬃107infectious particles and⬃108permissive host cells were mixed
in 2.0 ml soft agar (56) and plated. After a 30-min incubation at 33°C,⬃108unsusceptible host cells in
soft agar were poured atop the plates, which were then incubated at 37°C for 5 h. A second method used a preattachment protocol, whereby approximately⬃106infectious particles and⬃107permissive host
cells were mixed and incubated at 37°C for 5 min. Afterwards,⬃5.0⫻108unsusceptible host cells in
2.0 ml of soft agar was added to the reaction mixtures, plated, and incubated at 37°C. A third method used a low-titer stock protocol which was identical to a standard stock preparation (56) except that the culture was not allowed to incubate until lysis. A fourth protocol used lysis inhibition for␣3 and ST-1. For ␣3 a single plaque (⬃106to 107phages) and 0.1 ml of lysis-resistant cells (⬃108cells) were placed into
1.0 ml of TKY medium (1.0% tryptone, 0.5 KCl, 0.5 yeast extract) supplemented with 10.0 mM MgCl2and
5.0 mM CaCl2. Infections were incubated for 5 h at 37°C and then placed on ice. Egg white lysozyme was
added to a final concentration of 2.0 mg/ml and incubated overnight at 4°C. For mutant isolation, progeny were plated on the unsusceptible host. For ST-1, a phage with an amber mutation in the gene E, which encodes the viral lysis protein, was used. The protocol was identical to that used for␣3 except thatE. coliK-12 IJ1133 cells (sup°) were infected. The unsusceptible host for mutant isolation wasE. coli C BAF8 (supF).
Of all four techniques, the lysis inhibition protocol was the most efficient. Each single plaque infection represents an independent population source. Unlike generating low-titer stocks, these infections did not need to be continuously monitored for lysis. For the overlay and preattachment techniques, permissive rounds of infections occurred on the same plate from which host range mutants were picked. Conse-quently, mutant plaques often contained a high level of wild-type phage, which obscured sequencing results obtained without prior plaque purification. The lysis inhibition protocol was also the easiest to integrate into off-campus, high school schedules as a fully hands-on endeavor. Infections were started before the school day began and incubated while the students attended their other classes. Lysozyme was added during their scheduled laboratory class and incubated overnight. The next morning, selection plates were prepared before the start of classes and incubated during the day. Students picked plaques during their scheduled science hour. PCRs and product purification were also performed during scheduled science hours.
Experimental evolution.Starting with single plaques of each PA mutant, virions were stabbed into plates freshly seeded with bacteria and incubated for 5 h at 37°C. Virions from the same starting plaque were initially stabbed into both E. coli C- and K-12-containing plates. Afterwards, the subsequent populations were kept separate. A portion of the phage from each clearing was then transferred to a freshly prepared plate. Wild-type␣3 was similarly passaged onE. coliC to identify mutations that could arise from the passaging technique. After the 10th passage, at which time clearings had become substantially larger, 24 individual plaques were isolated from each population and plated on bothE. coli C and K-12 to determine whether passaging on one host led to any alterations in host range. For the reasons discussed above, this protocol was also easy to integrate into off-campus, high school schedules as a fully hands-on endeavor.
ACKNOWLEDGMENTS
We thank I. J. Molineux for providing ST-1 and theE. coliK-12 strains used in this study.
This research was supported by National Science Foundation grant MCB-1408217 (B.A.F.), the BIO5 Institute at the University of Arizona, and U.S. Department of Agri-culture Hatch funds to the University of Arizona. We also acknowledge the support of programs in which undergraduate and high school students participated: the Steps 2 STEM Program (University of Arizona) and the Advanced Math/Science Research Pro-grams at Berkshire School and Tucson Magnet High School.
REFERENCES
1. Leiman PG, Chipman PR, Kostyuchenko VA, Mesyanzhinov VV, Rossmann MG. 2004. Three-dimensional rearrangement of proteins in the tail of bacteriophage T4 on infection of its host. Cell 118:419 – 429.https://doi .org/10.1016/j.cell.2004.07.022.
2. Belnap DM, Filman DJ, Trus BL, Cheng N, Booy FP, Conway JF, Curry S, Hiremath CN, Tsang SK, Steven AC, Hogle JM. 2000. Molecular tectonic model of virus structural transitions: the putative cell entry states of poliovirus. J Virol 74:1342–1354. https://doi.org/10.1128/JVI.74.3.1342 -1354.2000.
3. Bubeck D, Filman DJ, Cheng N, Steven AC, Hogle JM, Belnap DM. 2005. The structure of the poliovirus 135S cell entry intermediate at 10-angstrom resolution reveals the location of an externalized polypeptide that binds to membranes. J Virol 79:7745–7755.https://doi.org/10.1128/ JVI.79.12.7745-7755.2005.
4. Hu B, Margolin W, Molineux IJ, Liu J. 2013. The bacteriophage t7 virion
undergoes extensive structural remodeling during infection. Science 339:576 –579.https://doi.org/10.1126/science.1231887.
5. Cotmore SF, Tattersall P. 2007. Parvoviral host range and cell entry mechanisms. Adv Virus Res 70:183–232.https://doi.org/10.1016/S0065 -3527(07)70005-2.
6. Lee H, Shingler KL, Organtini LJ, Ashley RE, Makhov AM, Conway JF, Hafenstein S. 2016. The novel asymmetric entry intermediate of a picor-navirus captured with nanodiscs. Sci Adv 2:e1501929.https://doi.org/10 .1126/sciadv.1501929.
7. Hueffer K, Parker JS, Weichert WS, Geisel RE, Sgro JY, Parrish CR. 2003. The natural host range shift and subsequent evolution of canine parvo-virus resulted from parvo-virus-specific binding to the canine transferrin re-ceptor. J Virol 77:1718 –1726.https://doi.org/10.1128/JVI.77.3.1718-1726 .2003.
8. Duffy S, Turner PE, Burch CL. 2006. Pleiotropic costs of niche expansion
on November 6, 2019 by guest
http://jvi.asm.org/
in the RNA bacteriophage phi 6. Genetics 172:751–757.https://doi.org/ 10.1534/genetics.105.051136.
9. Ford BE, Sun B, Carpino J, Chapler ES, Ching J, Choi Y, Jhun K, Kim JD, Lallos GG, Morgenstern R, Singh S, Theja S, Dennehy JJ. 2014. Fre-quency and fitness consequences of bacteriophage phi6 host range mutations. PLoS One 9:e113078. https://doi.org/10.1371/journal .pone.0113078.
10. Tetart F, Repoila F, Monod C, Krisch HM. 1996. Bacteriophage T4 host range is expanded by duplications of a small domain of the tail fiber adhesin. J Mol Biol 258:726 –731.https://doi.org/10.1006/jmbi.1996 .0281.
11. Yosef I, Goren MG, Globus R, Molshanski-Mor S, Qimron U. 2017. Extend-ing the host range of bacteriophage particles for DNA transduction. Mol Cell 66:721–728.e3.https://doi.org/10.1016/j.molcel.2017.04.025. 12. Bertozzi Silva J, Storms Z, Sauvageau D. 2016. Host receptors for
bacte-riophage adsorption. FEMS Microbiol Lett 363:fnw002.https://doi.org/ 10.1093/femsle/fnw002.
13. Mindich L, Bamford D, McGraw T, Mackenzie G. 1982. Assembly of bacteriophage PRD1: particle formation with wild-type and mutant viruses. J Virol 44:1021–1030.
14. Mindich L, Sinclair JF, Cohen J. 1976. The morphogenesis of bacterio-phage phi6: particles formed by nonsense mutants. Virology 75: 224 –231.https://doi.org/10.1016/0042-6822(76)90021-0.
15. Mindich L, Sinclair JF, Levine D, Cohen J. 1976. Genetic studies of temperature-sensitive and nonsense mutants of bacteriophage phi6. Virology 75:218 –223.https://doi.org/10.1016/0042-6822(76)90020-9. 16. Stengele I, Bross P, Garces X, Giray J, Rasched I. 1990. Dissection of
functional domains in phage fd adsorption protein. Discrimination be-tween attachment and penetration sites. J Mol Biol 212:143–149.https:// doi.org/10.1016/0022-2836(90)90311-9.
17. Baptista C, Santos MA, São-José C. 2008. Phage SPP1 reversible adsorp-tion to Bacillus subtilis cell wall teichoic acids accelerates virus recogni-tion of membrane receptor YueB. J Bacteriol 190:4989 – 4996.https://doi .org/10.1128/JB.00349-08.
18. McPartland J, Rothman-Denes LB. 2009. The tail sheath of bacteriophage N4 interacts with the Escherichia coli receptor. J Bacteriol 191:525–532.
https://doi.org/10.1128/JB.01423-08.
19. Parent KN, Erb ML, Cardone G, Nguyen K, Gilcrease EB, Porcek NB, Pogliano J, Baker TS, Casjens SR. 2014. OmpA and OmpC are critical host factors for bacteriophage Sf6 entry in Shigella. Mol Microbiol 92:47– 60.
https://doi.org/10.1111/mmi.12536.
20. Meyer JR, Dobias DT, Weitz JS, Barrick JE, Quick RT, Lenski RE. 2012. Repeatability and contingency in the evolution of a key innovation in phage lambda. Science 335:428 – 432. https://doi.org/10.1126/science .1214449.
21. Michel A, Clermont O, Denamur E, Tenaillon O. 2010. Bacteriophage phiX174’s ecological niche and the flexibility of its Escherichia coli lipopolysaccharide receptor. Appl Environ Microbiol 76:7310 –7313.
https://doi.org/10.1128/AEM.02721-09.
22. Weisbeek PJ, van de Pol JH, van Arkel GA. 1973. Mapping of host range mutants of bacteriophage phiX174. Virology 52:408 – 416. https://doi .org/10.1016/0042-6822(73)90335-8.
23. Sinsheimer RL. 1968. Bacteriophage phi-X174 and related viruses. Prog Nucleic Acids Res Mol Biol 8:115–169. https://doi.org/10.1016/S0079 -6603(08)60545-0.
24. Tessman ES. 1965. Complementation groups in phage S13. Virology 25:303–321.https://doi.org/10.1016/0042-6822(65)90208-4.
25. Bone DR, Dowell CE. 1973. A mutant of bacteriophage phiX174 which infects E. coli K12 strains. I. Isolation and partial characterization of phiXtB. Virology 52:319 –329.https://doi.org/10.1016/0042-6822(73) 90326-7.
26. Cox J, Putonti C. 2010. Mechanisms responsible for a phiX174 mutant’s ability to infect Escherichia coli by phosphorylation. J Virol 84: 4860 – 4863.https://doi.org/10.1128/JVI.00047-10.
27. Newbold JE, Sinsheimer RL. 1970. The process of infection with bacte-riophage phiX174. XXXII. Early steps in the infection process: attach-ment, eclipse and DNA penetration. J Mol Biol 49:49 – 66.https://doi.org/ 10.1016/0022-2836(70)90375-X.
28. Sun L, Rossmann MG, Fane BA. 2014. High-resolution structure of a virally encoded DNA-translocating conduit and the mechanism of DNA penetra-tion. J Virol 88:10276 –10279.https://doi.org/10.1128/JVI.00291-14. 29. Sun L, Young LN, Zhang X, Boudko SP, Fokine A, Zbornik E, Roznowski
AP, Molineux IJ, Rossmann MG, Fane BA. 2014. Icosahedral⌽X174 forms
a tail for DNA transport. Nature 505:432– 435.https://doi.org/10.1038/ nature12816.
30. Sun Y, Roznowski AP, Tokuda JM, Klose T, Mauney A, Pollack L, Fane BA, Rossmann MG. 2017. Structural changes of tailless bacteriophage phiX174 during penetration of bacterial cell walls. Proc Natl Acad Sci U S A 114:13708 –13713.https://doi.org/10.1073/pnas.1716614114. 31. McKenna R, Ilag LL, Rossmann MG. 1994. Analysis of the single-stranded
DNA bacteriophage phi X174, refined at a resolution of 3.0 A. J Mol Biol 237:517–543.https://doi.org/10.1006/jmbi.1994.1253.
32. McKenna R, Xia D, Willingmann P, Ilag LL, Krishnaswamy S, Rossmann MG, Olson NH, Baker TS, Incardona NL. 1992. Atomic structure of single-stranded DNA bacteriophage phi X174 and its functional implications. Nature 355:137–143.https://doi.org/10.1038/355137a0.
33. Ilag LL, McKenna R, Yadav MP, BeMiller JN, Incardona NL, Rossmann MG. 1994. Calcium ion-induced structural changes in bacteriophage phi X174. J Mol Biol 244:291–300.https://doi.org/10.1006/jmbi.1994.1730. 34. Rokyta DR, Burch CL, Caudle SB, Wichman HA. 2006. Horizontal gene
transfer and the evolution of microvirid coliphage genomes. J Bacteriol 188:1134 –1142.https://doi.org/10.1128/JB.188.3.1134-1142.2006. 35. Sandulache R, Prehm P, Kamp D. 1984. Cell wall receptor for
bacterio-phage Mu G(⫹). J Bacteriol 160:299 –303.
36. Bowes JM, Dowell CE. 1974. Purification and some properties of bacte-riophage ST-1. J Virol 13:53– 61.
37. Newbold JE, Sinsheimer RL. 1970. Process of infection with bacterio-phageX174. XXXIV. Kinetic of the attachment and eclipse steps of the infection. J Virol 5:427– 431.
38. Cumby N, Reimer K, Mengin-Lecreulx D, Davidson AR, Maxwell KL. 2015. The phage tail tape measure protein, an inner membrane protein and a periplasmic chaperone play connected roles in the genome injection process of E. coli phage HK97. Mol Microbiol 96:437– 447.https://doi .org/10.1111/mmi.12918.
39. Boulanger P, Letellier L. 1992. Ion channels are likely to be involved in the 2 steps of phage-T5 DNA penetration into Escherichia coli cells. J Biol Chem 267:3168 –3172.
40. Letellier L, Plancon L, Bonhivers M, Boulanger P. 1999. Phage DNA transport across membranes. Res Microbiol 150:499 –505. https://doi .org/10.1016/S0923-2508(99)00107-2.
41. Blackburn BJ, Li S, Roznowski AP, Perez AR, Villarreal RH, Johnson CJ, Hardy M, Tuckerman EC, Burch AD, Fane BA. 2017. Coat protein muta-tions that alter the flux of morphogenetic intermediates through the phiX174 early assembly pathway. J Virol 91:e01384-17.https://doi.org/ 10.1128/JVI.01384-17.
42. Zamyatnin A. 1972. Protein volume in solution. Prog Biophys Mol Biol 24:107–123.https://doi.org/10.1016/0079-6107(72)90005-3.
43. Cherwa JE, Jr, Fane BA. 2009. Complete virion assembly with scaffolding proteins altered in the ability to perform a critical conformational switch. J Virol 83:7391–7396.https://doi.org/10.1128/JVI.00479-09.
44. Cherwa JE, Jr, Uchiyama A, Fane BA. 2008. Scaffolding proteins altered in the ability to perform a conformational switch confer dominant lethal assembly defects. J Virol 82:5774 –5780.https://doi .org/10.1128/JVI.02758-07.
45. Doore SM, Baird CD, Roznowski AP, Fane BA. 2014. The evolution of genes within genes and the control of DNA replication in microviruses. Mol Biol Evol 31:1421–1431.https://doi.org/10.1093/molbev/msu089. 46. Gordon EB, Knuff CJ, Fane BA. 2012. Conformational switch-defective
X174 internal scaffolding proteins kinetically trap assembly intermedi-ates before procapsid formation. J Virol 86:9911–9918.https://doi.org/ 10.1128/JVI.01120-12.
47. Roznowski AP, Fane BA. 2016. Structure-function analysis of theX174 DNA-piloting protein using length-altering mutations. J Virol 90: 7956 –7966.https://doi.org/10.1128/JVI.00914-16.
48. Uchiyama A, Chen M, Fane BA. 2007. Characterization and function of putative substrate specificity domain in microvirus external scaffolding proteins. J Virol 81:8587– 8592.https://doi.org/10.1128/JVI.00301-07. 49. Daniel AS, Fuller-Pace FV, Legge DM, Murray NE. 1988. Distribution
and diversity of hsd genes in Escherichia coli and other enteric bacteria. J Bacteriol 170:1775–1782.https://doi.org/10.1128/jb.170.4 .1775-1782.1988.
50. Moak M, Molineux IJ. 2000. Role of the Gp16 lytic transglycosylase motif in bacteriophage T7 virions at the initiation of infection. Mol Microbiol 37:345–355.https://doi.org/10.1046/j.1365-2958.2000.01995.x. 51. Bernal RA, Hafenstein S, Olson NH, Bowman VD, Chipman PR, Baker TS,
Fane BA, Rossmann MG. 2003. Structural studies of bacteriophage
on November 6, 2019 by guest
http://jvi.asm.org/
pha3 assembly. J Mol Biol 325:11–24. https://doi.org/10.1016/S0022 -2836(02)01201-9.
52. Holland JJ, de la Torre JC, Steinhauer DA, Clarke D, Duarte E, Domingo E. 1989. Virus mutation frequencies can be greatly underestimated by monoclonal antibody neutralization of virions. J Virol 63:5030 –5036. 53. Hutchison CA, 3rd, Sinsheimer RL. 1971. Requirement of protein
syn-thesis for bacteriophage phi X174 superinfection exclusion. J Virol 8:121–124.
54. van der Avoort HG, van Arkel GA, Weisbeek PJ. 1982. Cloned bacterio-phage phi X174 DNA sequence interferes with synthesis of the comple-mentary strand of infecting bacteriophage phi X174. J Virol 42:1–11. 55. Crill WD, Wichman HA, Bull JJ. 2000. Evolutionary reversals during viral
adaptation to alternating hosts. Genetics 154:27–37.
56. Fane BA, Hayashi M. 1991. Second-site suppressors of a cold-sensitive prohead accessory protein of bacteriophage phi X174. Genetics 128: 663– 671.
57. Fane BA, Head S, Hayashi M. 1992. Functional relationship between the J proteins of bacteriophages phi X174 and G4 during phage morpho-genesis. J Bacteriol 174:2717–2719. https://doi.org/10.1128/jb.174.8 .2717-2719.1992.
58. Bernhardt TG, Struck DK, Young R. 2001. The lysis protein E of phi
X174 is a specific inhibitor of the MraY-catalyzed step in peptidogly-can synthesis. J Biol Chem 276:6093– 6097.https://doi.org/10.1074/ jbc.M007638200.
59. Kodaira K, Nakano K, Okada S, Taketo A. 1992. Nucleotide sequence of the genome of the bacteriophage alpha 3: interrelationship of the genome structure and the gene products with those of the phages, phi X174, G4 and phi K. Biochim Biophys Acta 1130:277–288.https://doi.org/ 10.1016/0167-4781(92)90440-B.
60. Cherwa JE, Jr, Sanchez-Soria P, Wichman HA, Fane BA. 2009. Viral adaptation to an antiviral protein enhances the fitness level to above that of the uninhibited wild type. J Virol 83:11746 –11750.https://doi .org/10.1128/JVI.01297-09.
61. Hafenstein SL, Chen M, Fane BA. 2004. Genetic and functional anal-yses of the oX174 DNA binding protein: the effects of substitutions for amino acid residues that spatially organize the two DNA binding domains. Virology 318:204 –213. https://doi.org/10.1016/j.virol.2003 .09.018.
62. Pettersen EF, Goddard TD, Huang CC, Couch GS, Greenblatt DM, Meng EC, Ferrin TE. 2004. UCSF Chimera—a visualization system for explor-atory research and analysis. J Comput Chem 25:1605–1612.https://doi .org/10.1002/jcc.20084.