Faculty of Health, Engineering & Sciences
Vibroacoustic Transformer Condition Monitoring
A dissertation submitted by
Dean Mark Starkey Student ID: 0061038897
in fulfilment of the requirement of
ENG4112 Research Project Part 2
towards the degree of
Bachelor of Engineering (Honours) Major Power Engineering
Dean Starkey | 0061038897 i
ABSTRACT
Throughout the life of a transformer the effects of mechanical shocks, insulation
aging, thermal processes and short circuit forces will cause deformations in the
winding. This deformation can lead to vibration in the transformer and mechanical
fatigue of the solid insulation. Defects which form in a transformers structure can
cause faults such as partial discharge, hot spots and arcing. These faults generate
combustible gases which can be analysed for condition assessment of the transformer.
The development of a suitable and cost effective vibration measurement system forms
a key part of this research project. A monitoring system is developed for real-time
vibration analysis. An embedded capacitive accelerometer is used in conjunction with
an Arduino microcontroller to record vibrations. The sensor platform is designed to
communicate wirelessly via XBee radios to a terminal computer. A software program
and user interface is designed as a tool for analysis.
The outcomes and benefits of these works are primarily based on determining the
condition of transformer insulation through measurements of vibration. Following a
working measurement system, suitable transformer sites are monitored. Spectral
analysis is performed in the frequency domain to determine a correlation with gas
analysis results. The validity of vibroacoustic measurement as a predictive
maintenance tool is subsequently evaluated.
Six transformers are chosen for vibration monitoring with analysis of the vibration
signatures correlated to the dissolved gas analysis reports at each site. The vibration
signatures at each location are analysed using the Short Time Fourier Transform and
frequency peaks compared for the different sites. It was noted that sensor location does
not have a large impact on vibration magnitudes and identifying the frequency
components present in the signal. However, from the signatures obtained there is not
enough variation in magnitude or frequency components to suggest that this method
Dean Starkey | 0061038897 ii
LIMITATIONS OF USE
The Council of the University of Southern Queensland, its Faculty of Health,
Engineering & Sciences, and the staff of the University of Southern Queensland, do
not accept any responsibility for the truth, accuracy or completeness of material
contained within or associated with this dissertation.
Persons using all or any part of this material do so at their own risk, and not at the risk
of the Council of the University of Southern Queensland, its Faculty of Health,
Engineering & Sciences or the staff of the University of Southern Queensland.
This dissertation reports an educational exercise and has no purpose or validity beyond
this exercise. The sole purpose of the course pair entitled “Research Project” is to
contribute to the overall education within the student’s chosen degree program. This
document, the associated hardware, software, drawings, and other material set out in
the associated appendices should not be used for any other purpose: if they are so used,
Dean Starkey | 0061038897 iii
CERTIFICATION
I certify that the ideas, designs and experimental work, results, analyses and
conclusions set out in this dissertation are entirely my own effort, except where
otherwise indicated and acknowledged.
I further certify that the work is original and has not been previously submitted for
assessment in any other course or institution, except where specifically stated.
Dean Starkey
Student Number 0061038897
Signature
Dean Starkey | 0061038897 iv
ACKNOWLEDGEMENTS
I would like to thank my supervisors Mr Andreas Helwig and Dr Narottam Das for
their guidance, feedback and support during this project.
I would also like to thank my work colleague Matthew Gibson for providing the DGA
information and reports needed. I would like to thank my parents for their continued
support and encouragement throughout this journey. Above all I would like to thank
my wife Yasmin Starkey for patiently supporting me in my studies over the past five
Dean Starkey | 0061038897 v
ABSTRACT ... i
LIMITATIONS OF USE ... ii
CERTIFICATION ... iii
ACKNOWLEDGEMENTS ... iv
LIST OF FIGURES ... ix
LIST OF TABLES ... xiii
... 15
INTRODUCTION ... 15
1.1 Project Aim ... 16
1.2 Project Objectives ... 17
1.3 Ethical Considerations ... 18
... 20
BACKGROUND AND LITERATURE ... 20
2.1 Magnetostriction ... 20
2.2 Acoustic Signals ... 22
2.3 Traditional Condition Monitoring ... 23
Chemical Detection ... 24
Acoustic Detection ... 26
Source location of partial discharge ... 26
2.4 Vibroacoustic Condition Monitoring ... 28
Dean Starkey | 0061038897 vi
Shannon Nyquist Sampling Theorem ... 29
Fast Fourier Transform (FFT) ... 30
Window Function ... 30
Power Spectral Density (PSD) ... 31
2.6 Review of Information ... 32
... 33
METHODOLOGY ... 33
3.1 Measurement System Hardware ... 33
Sensor Selection ... 34
Microcontroller ... 38
Resource Analysis ... 40
3.2 Measurement System Software ... 42
3.3 Controlled Experiment ... 44
3.4 Field Testing ... 46
Condition Analysis ... 46
Site Selection ... 47
3.5 Risk Assessment ... 50
... 51
Dean Starkey | 0061038897 vii
4.1 Hardware Development ... 51
Wireless communication ... 51
Sensor Encapsulation ... 55
4.2 Software Development ... 58
Programming Software ... 59
GUI Layout and Structure ... 61
Program Initialisation ... 62
Process Measurement ... 64
Feature Extraction ... 66
Exporting and Loading Data ... 68
Filtering Data ... 70
... 72
TESTING AND RESULTS ... 72
6.1 Initial System Testing ... 72
6.2 Wireless testing ... 73
Transmission data accuracy ... 74
Transmission Range Testing ... 75
6.3 Controlled Experiment ... 76
Dean Starkey | 0061038897 viii
Location of accelerometer ... 79
Duration of testing ... 81
Interpretation of results ... 81
6.5 DGA results ... 82
6.6 Load analysis ... 83
6.7 Effect of sensor position ... 85
6.8 Spectrum analysis ... 86
6.9 Summary of Results ... 92
... 93
CONCLUSION ... 93
7.1 Further Work ... 93
REFERENCES ... 95
Appendix A. Project Specification ... 99
Appendix B. MATLAB Code ... 100
Appendix C. Arduino Code ... 113
Appendix D. DGA Reports ... 116
Appendix E. Load Profiles ... 122
Appendix F. Risk Analysis ... 124
Dean Starkey | 0061038897 ix
LIST OF FIGURES
Figure 2-1 Principle of AE (IEEE Std C57.127 2007) ... 23
Figure 2-2 Gas Generation Chart (Singh & Bandyopadhyay 2010) ... 25
Figure 2-3 PD Experiment (Kozako et al. 2009) ... 26
Figure 3-1 Signal capture and data flow ... 34
Figure 3-2 Basic accelerometer structure (Aggarwal 2010) ... 35
Figure 3-3 ADXL345 (Left), ADXL345 Development Board (Right) (element14) . 38 Figure 3-4 ADXL345 sensor functional block diagram (Analogue Devices 2009) .. 38
Figure 3-5 Arduino UNO (Left), Raspberry Pi (Right) (element14) ... 40
Figure 3-6 Simplified program flow chart ... 43
Figure 3-7 Experimental setup representation ... 44
Figure 3-8 Vibration motor construction (top), Uxcell vibration motor (bottom) (Microdrives 2016)... 45
Figure 3-9 Site 1 (Top Left), Site 2 (Top Right), Site 3 (Middle Left), Site 4 (Middle Right), Site 5 (Bottom Left), Site 6 (Bottom Right) ... 48
Figure 4-1 XBee communication Arduino to PC ... 51
Figure 4-2 Wireless shield UART selection switch ... 52
Figure 4-3 ZigBee mesh network example ... 53
Dean Starkey | 0061038897 x
Figure 4-5 Shore Hardness Scale (Smooth On 2012) ... 56
Figure 4-6 Sensor Terminated (Top Left), Casting Process (Top Right), Curing Process (Bottom Left), Finished Result (Bottom Right) ... 58
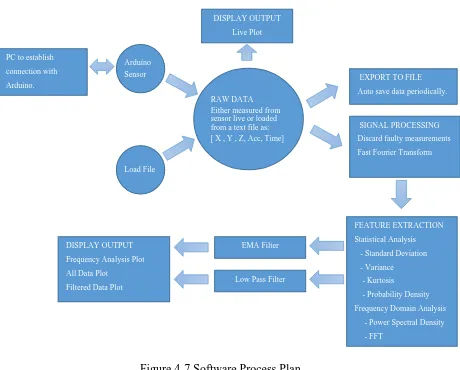
Figure 4-7 Software Process Plan ... 59
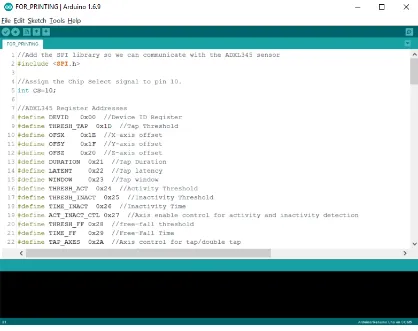
Figure 4-8 Arduino IDE Programming Environment ... 60
Figure 4-9 New Matlab GUIDE (Top), Developed Matlab GUIDE (Bottom) ... 61
Figure 4-10 Vibration Monitoring System User Interface ... 62
Figure 4-11 Before Initialisation (Left), Program Running (Right) ... 62
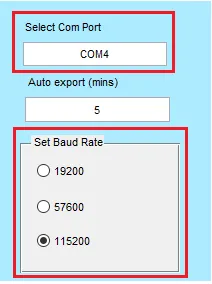
Figure 4-12 Serial Communication Parameters ... 63
Figure 4-13 Prior to Serial Connection (Left), Successful Serial Connection (Right) ... 64
Figure 4-14 Arduino IDE Serial Monitor Output ... 64
Figure 4-15 Real-time Vibration Measurement Display ... 65
Figure 4-16 Two Examples of Bad Reading ... 66
Figure 4-17 Real-time Signal Information (Left), Statistical Information (Right) .... 66
Figure 4-18 Histogram & PDF (Top), All Acceleration Data Plot (Bottom) ... 67
Figure 4-19 Fast Fourier Transform (Top), Power Spectral Density (Bottom) ... 68
Figure 4-20 Auto and Manual Export (Left), Export to directory (Right) ... 69
Dean Starkey | 0061038897 xi
Figure 4-22 Load Historical Data Files ... 70
Figure 4-23 Filter Selection ... 71
Figure 4-24 EMA Filter (Top), Low Pass Filter (Bottom) ... 71
Figure 6-1 ADXL345 initial test setup (Left), ADXL345 initial wiring (Right) ... 72
Figure 6-2 Initial XBee communication ... 73
Figure 6-3 Zone substation transmission range testing ... 76
Figure 6-4 Vibration system and motor test setup ... 77
Figure 6-5 Portion of sampled signal ... 77
Figure 6-6 Frequency components of vibration motor signal ... 78
Figure 6-7 Proposed accelerometer placement (Borucki 2012) ... 79
Figure 6-8 Site 5 rear wall mount (Top), Site 5 side wall mount (Bottom) ... 80
Figure 6-9 STFT plot for Site 1 – 2D (Left), 3D (Right) ... 82
Figure 6-10 Site 3 load profile ... 84
Figure 6-11 Site 4 load profile ... 85
Figure 6-12 Sites 1 and 2 sensor location comparison ... 86
Figure 6-13 Sites 1 to 3 Short Time Fourier Transform ... 87
Figure 6-14 Sites 4 to 6 Short Time Fourier Transform ... 88
Figure 6-15 Sites 1 to 6 Power Spectral Density ... 89
Dean Starkey | 0061038897 xiii
LIST OF TABLES
Table 2-1 Recommended DGA limits (Wang, Vandermaar & Srivastava 2002) ... 24
Table 3-1 Desired sensor specification ... 36
Table 3-2 MEMS sensor comparison ... 37
Table 3-3 Development platform comparison ... 39
Table 3-4 Resource Analysis ... 40
Table 3-5 Vibration motor characteristics ... 45
Table 3-6 Dissolved Gas Analysis Condition Limits (IEEE Std C57.104 2009) ... 47
Table 3-7 Sites 1 to 6 comparison ... 47
Table 3-8 DGA Results, Sites 1, 2 & 3 ... 49
Table 3-9 Transformer Condition Assessment ... 49
Table 4-1 XBee Pro characteristics (Digi 2014) ... 51
Table 4-2 Wireless Network Settings ... 54
Table 4-3 Encapsulation Resin Comparison ... 56
Table 4-4 Epoxy Resin ER2074 properties ... 57
Table 6-1 Direct USB connection testing ... 74
Table 6-2 XBee wireless connection testing ... 74
Table 6-3 Summary of DGA results ... 83
Dean Starkey | 0061038897 xiv Table 7-1 Risk Matrix ... 125
Dean Starkey | 0061038897 15
INTRODUCTION
Power transformers provide the crucial link between the generation, transmission and
distribution of electricity to customers at different voltage levels. Broadly the study
of power transformers is a key field in the power engineering discipline. Whilst the
fundamental electrical principles have not changed since transformers were
introduced the consumer dependence on efficient power networks has driven the
investment and research in this area.
The life expectancy of a transformer is linked to the deterioration of both solid and
liquid oil dielectric insulation over time. A transformers life expectancy is typically
25 to 35 years through design however in practice transformers can remain in service
for over 60 years. The predominant causes of transformer insulation degradation are
from electrical, thermal and mechanical stresses. Electrical stress is caused by over
current or over voltage conditions which can lead to thermal stress from increased
winding and hotspot temperatures. Mechanical stress is primarily a result of the
electromagnetic constriction forces known as magnetostriction and is the main source
of transformer noise.
Due to the critical role of transformers in the electricity network, power utilities place
importance on the maintenance and condition monitoring of these assets. A traditional
diagnostic method for transformer condition monitoring is through testing the
insulating oil and is known as dissolved gas analysis (DGA). This type of testing
involves a number of oil samples being taken over time and examining of the presence
and concentration of certain types of dissolved gases. Depending on the type of gas
and ratio in the sample conclusions can be drawn about the condition of a transformers
internal insulation.
A possible result of the deterioration of insulation is the presence of partial
Dean Starkey | 0061038897 16 left unmonitored can result in a critical failure of the asset. Whilst the most common
practice to determine transformer insulation condition is to analyse the presence of
dissolved gases, it is has also been extensively demonstrated that acoustic emission
methods in the high frequency range can be used to determine a correlation of PD
activity and the source location of PD. Presently the detection and location of PD is
not considered an exact science (IEEE Std C57.127 2007) although acoustic methods
provide another source of information to assist in condition assessment.
The primary source of transformer noise is from vibrations in the laminated iron core
where electromagnetic attraction between the laminated sheets and constantly
changing magnetic flux causes structural deformations of the magnetic material. It is
recognised that vibration measurement is not a traditional method of analysis used for
condition assessment of transformers. The Vibroacoustic Method (VM) is one
suggested by Bartoletti et al. (2004) and consists of measuring mechanical vibrations
for transformer condition assessment. Current literature on transformer vibration is
limited and in depth studies are required before vibration characteristics can be used
as a diagnostic method and predictive maintenance tool. This research aims to identify
the validity of monitoring transformer vibroacoustic emissions in the low frequency
range as a predictive maintenance tool for the precursor events that lead to PD and
potential transformer failure.
1.1
Project Aim
To date research on condition monitoring of transformers using acoustic emissions in
the high frequency range has been extensively undertaken for the identification and
location of PD in a transformer. Most research of PD in oil suggests in addition to the
measurable electrical pulses, acoustic waves occur in the ultra-sonic range and
electromagnetic waves up to the Ultra High Frequency (UHF) range. Developing a
further understanding of partial discharge in transformers is believed to have a direct
cost saving by enhancing risk management, replacement strategies and investment
Dean Starkey | 0061038897 17 tool in predictive maintenance and intervention strategies to prevent catastrophic
failure of a transformer.
In contrast to this research the monitoring of transformer vibrations in the low
frequency range is not a widely adopted condition monitoring method. It is theorised
that by spectral analysis of the acoustic signal in the low frequency range and by
looking at the changes in the specific frequency peaks over time a determination can
be made to depict if these source changes are internal to the transformer or by external
harmonic loads. Through this research a greater understanding of transformer vibration
signatures is the objective.
The development of a low cost vibration monitoring system is required as part of this
project. Modern acoustic emission methods for transformer condition assessment in
the high frequency range require specialised piezoelectric sensors, signal conditioning
and data acquisition units that are considerably expensive. Vibration condition
monitoring systems are not applied to transformers and those that do exist for rotating
plant are also expensive. As power utilities look to be more efficient and reduce capital
expenditure the design of cost effective condition monitoring systems contributes to
the field of maintenance engineering.
1.2
Project Objectives
The specific project objectives can be summarised as follows:
Develop an inexpensive real-time vibration measuring system
Test the developed system using a controlled experiment
Select suitable substations and analyse DGA results
Monitor selected substations using developed system
Analyse substation vibration signatures to determine a correlation with DGA
Dean Starkey | 0061038897 18
1.3
Ethical Considerations
The consequences and ethics of this research project have been considered in terms of
the improvements to the field of transformer condition assessment and the potential
social and economic impacts of this work. Some of the relevant ethical principles to
this research project are:
Scientific integrity – adhering to professional values, and practices ensuring
objectivity and clarity.
Data integrity – quality of the procedure, documentation and reporting of
results.
Social responsibility – considering the impacts of the research on the
environment and society.
This research requires access to organisational data from NSW electricity utility
Ausgrid, for which approval has been granted. The data obtained from this
organisation is not classified however some of the specific locations and names of
substations have been changed. Data integrity is maintained and no changes have been
made to results or measurements.
Social responsibility in this research requires the mitigation of health and safety risks.
The risks which exist in the application of this work are due to the nature of working
in close proximity to electricity. Whilst this risk exists for persons involved in working
near transformers, it is intended that the methods explained are only used by
adequately trained and experienced persons. The outcomes of this work are not
expected to present any health and safety impacts to the environment or general public.
Transformers are an essential part of the distribution network and as population density
is increased, transformers are installed closer to the general populace. The causes and
remedies of transformer noise and vibrations has been the study of many researchers
over many generations. Any consequential effects of this research to the environment
Dean Starkey | 0061038897 19 that only aids to decrease the impact of noise and improve the efficiency of power
Dean Starkey | 0061038897 20
BACKGROUND AND LITERATURE
2.1
Magnetostriction
Magnetostriction is the property of ferromagnetic materials which causes them to
change shape when subject to a magnetic field. Transformers inherently undergo
mechanical forces which are a result of the constantly fluctuating magnetic field
permeating the iron core. Mechanical forces are produced when the magnetisable
material inside a transformer changes configuration. The mechanical forces that result
from these magnetic forces lead to periodic changes of length in the laminated core
structure. Transformers are designed such that the core laminations are pressed
together which supresses these mechanical vibrations. Noise however is still generated
by these forces and can be a significant impact to the environment, public and life of
the asset (Transformers 2003).
Magnetostriction is characterised by the coefficient 𝜖, and can be represented by
(Kulkarni & Khaparde 2004):
𝜖 =∆𝑙
𝑙 ( 1 )
Where 𝑙 and ∆𝑙 are the length of the lamination sheet and its change. The
magnetostriction coefficient depends on the instantaneous measure of flux density
given by the following expression:
𝜖(𝑡) = ∑ 𝐾𝑣𝐵2𝑣 𝑛
𝑣=1
( 2 )
Where 𝐵 represents instantaneous flux density and 𝐾𝑣 is a coefficient depending on
Dean Starkey | 0061038897 21 𝐹 = 𝜖(𝑡)𝐸𝐴
( 3 )
Where 𝐸 represents the modulus of elasticity and 𝐴 is the cross sectional area of the
lamination.
Early research into magnetostriction effects by George (1931) found vibrations to
occur at frequencies which are multiples of the fundamental frequency (50Hz). These
effects occur in the low frequency range and are tonal in nature. The vibrations occur
at even harmonics of the power frequency and are dominated by that of the 2nd
harmonic (100Hz). The 'IEEE Standard Test Code for Liquid-Immersed Distribution,
Power, and Regulating Transformers' (2016) describes transformer audible noise being
composed of three components:
Core sound - Originates from transformer core consisting of primarily even harmonics 2nd, 4th, 6th and 8th.
Load sound - Originates from vibrations of the windings and tank walls under load, dominated by the 2nd harmonic.
Cooling sound - Typical broadband fan noise at the blade passage frequency.
Transformer noise however does not only occur at even harmonics, in practice
transformer noise is found to be made up of frequencies of odd multiples of the
fundamental frequency being 1st, 3rd, 5th and 7th harmonics. The magnitude of these
transformer frequencies is dependent on the transformer construction and transformer
load.
Other sources that accelerate insulation damage include severe load faults, lightning
strikes, load induced current harmonics as well as transformation harmonics from the
voltage transformation process. Further to the noise generated by magnetostriction is
the potential degradation and accelerated aging causing paper to chaff and pressboard
Dean Starkey | 0061038897 22
2.2
Acoustic Signals
Transformers in normal operation emit acoustic signals and the study of these
emissions is aimed at providing an indication of condition and insulation health.
Acoustic signals from transformers are known from many studies to be generated
from:
Magnetostriction of the transformer magnetic materials and wound
conductors.
Partial discharge as a result of the mechanical and thermal stress
applied to the components inside the transformer tank that result from
corona discharge in insulation voids.
Loosening of packing blocks due to displacement of windings
Destruction of conductor paper insulation during fault conditions
Shrinkage and decomposition of the insulation with age.
A definition from AS 60270 (R2015) describes partial discharge (PD) as an electrical
discharge that does not completely bridge the insulation between conductors, or
conductors and an earthed part of the transformer. PD forms from a concentration of
local electrical stress either on or in the insulation and appears as short current pulses.
PD is a term used to explain many forms of electrical discharge however these are
generally categorised as follows:
Internal discharge - Discharge formed in insulation cavities due to poor manufacture or aged insulation.
Surface discharge - Discharge formed along the surface boundary of typically a solid type of insulation liquid or gas interface.
Corona - Current discharge often initiated around sharp points of conduction generally at air or oil insulation interfaces.
Electrical treeing - Discharge formed over time in a solid dielectric that begins to form permanent conducting tracks across an insulation dielectric
Dean Starkey | 0061038897 23 These signals propagate from the source in all directions travelling through
intersecting mediums (i.e. oil, mechanical and insulation supports) until the signal
arrives at the tank wall. Figure 2-1 shows the principle behind the AE method of
[image:24.595.129.508.176.446.2]detecting PD.
Figure 2-1 Principle of AE (IEEE Std C57.127 2007)
2.3
Traditional Condition Monitoring
There are many methods that can be employed for condition monitoring of
transformers some of which can be categorised as chemical, electrical, thermal and
acoustic. The formation of PD inside a transformer results in chemical changes to the
insulating oil and produces electrical, thermal and acoustic emissions that can be
Dean Starkey | 0061038897 24
Chemical Detection
Oil testing methods such as DGA are conducted offline and can identify the presence
of gases based on oil samples periodically taken over time. Wang, Vandermaar and
Srivastava (2002) describe a characteristic of partial discharge as high levels of
hydrogen with low levels of other gases. However, it is discussed that oil testing does
not always provide sufficient information to determine insulation integrity. In addition
to DGA, parameters of age, manufacturer and failure history are a vital part of the
evaluation. Table 2-1 shows the typical gases tested, concentration thresholds and the
age compensation that can be applied. DGA requires expert analysis to draw
conclusions about insulation condition due to the complex and variable nature of
chemical testing.
Table 2-1 Recommended DGA limits (Wang, Vandermaar & Srivastava 2002)
The two main causes of gas and chemical formation inside an oil immersed
transformer are from thermal and electrical disturbances. The thermal decomposition
of both oil and solid insulation exposed to arcing temperatures produces a wide range
of gases. The rate at which these gases are generated are produced is dependant
exponentially on temperature and volume of material at that temperature (IEEE Std
Dean Starkey | 0061038897 25 The gases and chemicals that form inside a power transformer generate at different
temperatures as shown in Figure 2-2. Both hydrogen and methane begin to form at
approximately 150°C, with ethane at 250°C and ethylene produced at 350°C. Traces
of acetylene indicate temperatures of at least 500°C whilst large amounts of acetylene
indicate temperatures over 700°C. In addition to temperature it should be noted that
small quantities of hydrogen, methane and carbon monoxide are produced by the aging
process and thermal decomposition of oil impregnated cellulose.
Dean Starkey | 0061038897 26
Acoustic Detection
Acoustic Emission (AE) methods use ultrasonic piezoelectric transducers to detect
the AE generated by the various potential acoustic sources listed. Acoustic sensors
can be installed internally or externally on the transformer tank wall to detect the
emission. There are benefits of reduced interference and noise from installing the
sensors internally although this is not always a practical approach. Installing sensors
externally increases the flexibility of the system and is a less invasive approach, and
allows for measurement while the transformer remains in operation. Externally
mounted sensors require a coupling gel or grease to increase the accuracy of the
acoustic measurements and reduce unwanted noise. The types of systems used to
measure AE from PD include automated workstations, digital oscilloscopes and
continuous online monitoring systems. Figure 2-3 shows an example PD test
experiment with externally placed sensors using a digital storage oscilloscope coupled
with a preamplifier circuit.
Figure 2-3 PD Experiment (Kozako et al. 2009)
Source location of partial discharge
A major advantage of AE methods is the possible correlated identification of the
acoustic source location within the transformer. The short current pulse generated
Dean Starkey | 0061038897 27 becoming less restrained by the pressboard blocks has a particular shape, size and
frequency. It is the spectral analysis of these signals which can be used to determine
the propagation delay between the sensors.
Digital signal processing techniques are required to analyse AE and determine the
source location of PD. It is identified in IEEE Standard (2007) that for accurate source
location a variety of signal processing techniques can be employed including:
Time domain - Examining the start of a signal in the time domain is the simplest approach.
Cross correlation - Two acoustic sensors are used with one data source delayed in comparison to the other channel. Corresponding data points are
multiplied to attain a correlation where the maximum will be given by the
real time delay between the signals. A disadvantage of this method would
be where there are two different waveforms recorded.
Signal mean - Averaging can be applied to repetitive signals to
eliminate stochastic noise. This method reduces the amplitude of random
signals nearly to zero revealing the repetitive signal. A disadvantage of this
method is that AE signals are not always repetitive in nature and can have
varying amplitudes.
Fast Fourier Transform - The signal is decomposed into its natural frequencies so that the spectral densities can be analysed. These densities
c a n be modified mathematically to get an estimate of time delay and
source location.
Wavelet Transform - A suitable wavelet technique is employed to analyse the signal and frequency around a certain point in time. This can
provide the estimated time delays and yield a more accurate acoustic
Dean Starkey | 0061038897 28
2.4
Vibroacoustic Condition Monitoring
The research of transformer vibrations is primarily via the analysis of measured
statistical data or through calculation in an established model. A vibroacoustic method
of transformer condition assessment describes the measurement of vibrations under a
transformers regular operation. This type of condition monitoring while widely
adopted by industry for rotating plant is not an industry standard for assessment of
transformers. At the core of this method is the analysis of acceleration values and
amplitudes of the frequency components.
Borucki (2012) discusses a vibroacoustic method for the assessment of transformer
core condition and highlights some of the issues of using this method. As a large
variety of transformers are used in operation, the varying size, power and construction
type can make determining an effective diagnostic criteria difficult. Another issue is
the nonlinearity of the transformers load and induced oil circulation which can
generate overlapping vibrations leading to erroneous interpretation of the results. For
this research the vibration signals were measured during the transient state when
switching a 200kVA transformer under laboratory conditions. The vibration signals
were analysed using a Short Time Fourier Transform (STFT) and found to occur in
the range 0Hz to 10kHz. It was found that the location of measurement transducer on
the transformer tank had no significant influence on the registered signals.
Shengchang, Lingyu and Yanming (2011) further analysed transformer vibrations with
respect to the variation of transformers and found that those of the same type have
almost identical vibration profiles. Contrary to those findings by Borucki (2012) it was
noted that sensor position was important and that transformers of different types could
not be used to compare vibration signatures. It was stated that when vibration
signatures are compared they must be normalised by the square of the applied voltage
and loading current.
In the field of partial discharge measurement Solin, Yolanda and Siregar (2009) used
Dean Starkey | 0061038897 29 clear enough to detect PD in momentary windows of monitoring. As PD magnitude is
influenced by temperature and location of the source it was theorised that only by
continuously monitoring a transformer over time could a correlation between PD and
vibration signature be determined.
Saponara et al. (2015) recognised a key issue in the study of transformer predictive
maintenance was the development of a system of tracking mechanical degradation.
This work implemented a distributed network of measuring nodes where vibration
measurements were taken in the range 100Hz-1kHz. The developed system used
capacitive MEMs accelerometers where processing the signal in the frequency domain
was done via software using Fast Fourier Transform (FFT). It was recognised in
industrial cases where high level background noise is more than 70dB that vibration
measurement was the only viable online method to detect mechanical degradation.
2.5
Signal Processing
Stone (2005) highlights that there is much literature on the subject of signal processing
and removal of noise although there is little corroboration to which is the best method.
Various methods to process and differentiate signals from noise include statistical
analysis, neural networks, fuzzy logic, wavelet transformation, fractal analysis and
time vs frequency clustering. Statistical analysis involves using the mean, standard
deviation, kurtosis and skew to approximate the shape of the signal. The following
sections briefly outline some of the key methods used in most literature for processing
of vibroacoustic signals.
Shannon Nyquist Sampling Theorem
The Shannon Nyquist Sampling Theorem is an important concept in digital signal
processing. The theorem was derived by Harold Nyquist and Claude Shannon and
forms a cornerstone of modern signal processing. This theory discovered that aliasing
of the signal occurred when the sampling frequency was less than at least twice that of
Dean Starkey | 0061038897 30 frequency’. More in depth this theorem states that a function of time 𝑓(𝑡) that contains
no frequency components greater than 𝜔𝐶 is thus band limited and can be constructed
by the values of 𝑓(𝑡) at a set of sampling points spaced by 𝑇 < 𝜋/𝜔𝐶 seconds (Luo,
Ye & Rashid 2010). This signal can be constructed by:
𝑓(𝑡) = ∑ 𝑒(𝑘𝑇)
+∞
𝑘=−∞
)sin 𝑣(𝑡, 𝑘𝑇)
𝑣(𝑡, 𝑘𝑇) ( 4 )
Where 𝑣(𝑡, 𝑘𝑇) ≡ (𝜔𝑆− 𝜔𝑆𝑘𝑇)/2
Fast Fourier Transform (FFT)
The Discrete Fourier Transform (DFT) and Fast Fourier Transform (FFT) are essential
mathematical tools to decompose a discreetly sampled signal into its frequency
components. The Fourier Transform (FT) is the transformation of a continuous time
signal and can be defined as:
𝑋(𝜔) = ∫ 𝑥(𝑡)𝑒−𝑗𝜔𝑡𝑑𝑡, 𝜔 ∈ (−∞, ∞)
∞
−∞ ( 5 )
The DFT replaces the infinite integral with the finite sum:
𝑋(𝜔𝑘) ≡ ∑ 𝑥(𝑡𝑛). 𝑒𝑘−𝑗𝜔𝑘𝑡𝑛
𝑁−1
𝑛=0
, 𝑘 = 0,1,2 … . . , 𝑁 − 1 ( 6 )
The FFT algorithm has the primary advantage of significantly reduced computation
compared to that of DFT. In general, the discrete Fourier coefficients of a signal
sampled ′𝑛’times has 𝑂(𝑛2) computational complexity. Comparatively when n is an
integer of power 2, the FFT delivers a reduce order of complexity 𝑂(𝑛 log(𝑛)).
Window Function
Discrete blocks of digitised time are required by the FFT process and are referred to
Dean Starkey | 0061038897 31 the beginning and end of the cycle. As a signal can only be measured for a specific
time period the FT makes the assumption that the signal is repetitive and resulting
discontinuities can be introduced. Spectral leakage is related to the spreading in the
frequency spectrum, where the signal which should be at one frequency although leaks
into all other frequencies (Bores 2012). This leakage is related to the discontinuities at
the end of each measurement time and may be reduced by an appropriate window
function. The window function in effect multiplies the signal by a function that
approaches zero at either end. There are many different types of window functions and
to select an appropriate function an estimate of the frequency content of the signal is
required.
From the literature the common window functions applied are the Hamming and Hann
functions which are sinusoidal in shape. Shreve (1995) highlights that the Hamming
window provides better frequency resolution at the expense of amplitude. In
comparison the Kaiser-Bessel window is ideal for separating close frequencies as there
is less spectral leakage into the side bins however the resolution is less than with
Hamming.
Power Spectral Density (PSD)
The results of vibroacoustic measurement were processed by Zmarzly et al. (2014)
using the Power Spectral Density function. PSD is useful in showing the strength of
variations in energy, which in this case is acceleration as a function of frequency.
Random vibrations are those which are not predictable at any point in time unlike that
of a sinusoidal vibration. The amplitude of random vibrations cannot be expressed as
a function of time mathematically although statistical analysis can determine the
probability of occurrence at a specific amplitude. The PSD is the FT of the
autocorrelation function and is of use in the analysis of random vibrations.
The autocorrelation of two signals 𝑠1(𝑡) and 𝑠2(𝑡) with time delay 𝜏 is given by (MIT
Dean Starkey | 0061038897 32 𝑅𝑐(𝜏) = < 𝑠1(𝑡)𝑠2(𝑡 + 𝜏) >
( 7 )
The PSD of the stationary stochastic process defined by the Wiener-Khinchin theorem
is then:
𝑆(𝑓) = ∫ 𝑅𝑐(𝜏)
∞
−∞
𝑒−𝑗𝜔𝜏𝑑𝜏
( 8 )
This process is the same for a discrete time process where PSD is given by the DFT of
the discrete autocorrelation function:
𝑆𝑥(𝑓) = ∑ 𝑅𝑥(𝑛)𝑒−𝑗𝜔𝑛 𝑛=∞
𝑛=−∞
, −1
2≤ 𝑓 ≤
1
2 ( 9 )
2.6
Review of Information
It is clear from the literature that acoustic measurement techniques to assess
transformer condition are not an exact science or widely adopted by industry.
Typically, most power utilities rely upon the long standing and proven methods such
as chemical testing (DGA) which usually require the transformer to be out of service
to take samples. It is evident that only by trend analysis over time can the changes in
‘hum’ frequencies of the vibroacoustic response be used in condition diagnostics. The
changes in this acoustic response of the transformer is theorised to be a predictive
maintenance tool in the identification of deformation due to faults, damage to magnetic
core material, and lessening of restraint of coils by press board blocks and end of
Dean Starkey | 0061038897 33
METHODOLOGY
Transformer oil with high levels of hydrogen dissolved gas is considered to have a
partial discharge occurring within the tank. The project aims to determine a correlation
between the high levels of certain gases in oil and the vibroacoustic emissions that
should be present. The refined project objectives are:
Develop a real-time vibration measuring system using non-commercial grade
and cost effective equipment.
Test the developed system using a controlled experiment
Monitor substations to determine correlation between vibration signatures
and DGA results
This project involves the development of a cost effective measurement system which
forms a crucial part of this project. The vulnerability to noise is a major issue with
vibration measurements and to determine if the device operates as expected a
controlled experiment is required. The controlled experiment will simulate a known
vibration signal using a vibration motor. Following a confirmed working system, a
selected set of transformers will be monitored to determine if there is a correlation
between DGA and results from vibroacoustic testing.
3.1
Measurement System Hardware
A system needs to developed that is capable of close to real time data processing. The
components need to be carefully selected such that the sampling rate at minimum
satisfies that of the Nyquist frequency. From the literature it evident that vibrations in
the range of 100Hz-400Hz is the target bandwidth. The system will require four main
components including a sensor, signal conditioning circuitry, microcontroller and
Dean Starkey | 0061038897 34 Figure 3-1 Signal capture and data flow
Sensor Selection
The choice of sensor is important to obtain valid results with requirements for stable
performance and good frequency response. Conventional piezoelectric sensors are
used in industry for vibration based condition monitoring however come at a high cost.
The sensors alone can cost thousands of dollars and require signal conditioning
amplifiers which are considerably more expensive. The recent advances in embedded
accelerometers make for a much cheaper alternative and these often have built in signal
conditioning.
Micro-ElectroMechanical Systems (MEMS) are a small low powered and low cost
accelerometer that have enabled innovation in smartphones and modern electronic
devices. Advancements in MEMS performance and accuracy have seen industrial
applications specifically in vibration measurement. MEMS utilise semiconductor
technology with single chip components to provide a low mass sensor with high
Sensor ConditioningSignal Microcontroller
Dean Starkey | 0061038897 35 sensitivity and shock resistance. External acceleration is measured via the changes in
capacitance of a proof mass between fixed electrodes as shown in Figure 3-2.
Figure 3-2 Basic accelerometer structure (Aggarwal 2010)
The advantage of these types of sensors is that they can generally measure a wide band
from 0Hz (DC) to 32kHz, although most inexpensive MEMS have a range of 0 to
1kHz. In addition to good low frequency response MEMS sensors have the advantage
of good temperature sensitivity. A disadvantage of capacitive accelerometers is the
sensitivity to electromagnetic interference and reduced resolution due to the unit size
and plate surface area. To avoid erroneous results a suitable casing is required to reduce
susceptibility to interference. Important characteristics to consider in the selection of a
suitable MEMS sensors with multiple axis are:
Bandwidth – Operating capability of the sensor in Hz
Operating Temperature – Operating temperature range in °C
Measurement range – The acceleration range in 𝑔
Sensitivity - Acceleration change expressed as a ratio due to output signal. For digital sensors in LSB/g or for analogue in mV/g.
Dean Starkey | 0061038897 36
Cross axis sensitivity – Measure of effects on an axis when acceleration is
applied to a differing axis in %.
Each transformer will have a vibration profile, when this vibration is linear a single
axis sensor can be used however a tri axis sensor will add more flexibility as the
vibration direction can be detected. Therefore, only those MEMS sensors with three
axis measurement points have been considered.
A list of basic specifications has been determined for the desired application in Table
3-1. The acceleration range has been specified based on findings by Saponara et al.
(2015). Bandwidth is an important factor in determining which sensor to use. For
digital MEMS sensors the bandwidth is limited by half the data rate of the signal
conditioning circuitry, to satisfy the Nyquist frequency. Operating temperature is also
of importance due to the high temperatures experienced during transformer peak loads.
Table 3-1 Desired sensor specification
Specification Min Max
Bandwidth 50Hz 1kHz
Interface Digital or Analogue N/A
Operating Temperature -10°C 70°C
Acceleration range 0.5g 5g
Noise Density 0g/√𝐻𝑧 10mg/√𝐻𝑧
Cross Axis Sensitivity -2% 2%
Cost 0 $150
Taking into consideration these important characteristics, commonly available sensors
have been compared in Table 3-2. These sensors all come supplied on a development
board which provides some minor circuitry and wire connection points. All the sensors
Dean Starkey | 0061038897 37 Table 3-2 MEMS sensor comparison
Sensor
Band.
width.
Hz
Interface Acc. Range Sensitivity
Noise Density mg/√Hz Cross Axis Sens. Cost
ADXL345 6.25 to
1600 SPI / I2C ±2g to ±16g
3.9mg/LSB
31.2mg/LSB 3.9
31.2 ±1% $84 ADXL343 0.1 to 1600 SPI ±2g to ±16g 3.9mg/LSB
31.2mg/LSB 4.2
34.3 ±1% $60 ADIS16209 0 to 50 SPI ±1.7g 0.24mg/LSB 0.19 ±2% $161 ADXL375 0 to 1000 SPI / I2C ±200g 49mg/LSB 5 ±2.5% $60 LIS331AL 0 to 1000 Analogue ±2g 145mV/g 0.3 ±2% $71 BMA150 25 to 1500 I2C ±2g to ±8g 256mg/LSB 0.5 ±2% $42
From the analysed MEMS sensors, the ADXL345 shown in Figure 3-3 has been chosen
as it meets all desired criteria. The ADXL345 is a small and thin 3mm x 5mm x 1mm
package and has a selectable measurement range of ±2g, ±4g, ±8g and ±16g. It is
envisaged that for this application ±2g will be used, with testing required validate the
correct range. The digital communication protocols I2C and SPI are available and it is
envisaged that SPI will be the simplest to implement for this application. An embedded
32 level First In First Out (FIFO) buffer as shown in Figure 3-4 is used to store
information that cannot be read immediately. This type of buffering is a useful way of
storing the data that arrives asynchronously and allows a decreased interaction between
the microcontroller and the sensor thus saving considerable power. Due to the sensitive
structure of the development board, suitable encapsulation of the accelerometer is
required for thermal, mechanical and water resistant protection. The device can be set
Dean Starkey | 0061038897 38 Figure 3-3 ADXL345 (Left), ADXL345 Development Board (Right) (element14)
Figure 3-4 ADXL345 sensor functional block diagram (Analogue Devices 2009)
Microcontroller
A small, cost effective and efficient microcontroller is required to process the signal.
The two most commonly used development platforms are the Raspberry Pi and
Arduino. The Arduino is a microcontroller that includes an on board Analogue to
Digital Converter (ADC) which makes it ideal for applications involving external
sensors. In comparison, the Raspberry Pi is a functional minicomputer and requires an
operating system. A core comparison of these development platforms is shown in
Dean Starkey | 0061038897 39 Table 3-3 Development platform comparison
Attribute Arduino UNO Raspberry Pi 3
Architecture ATmega328P ARM Cortex A53
Storage 32kB microSD Card
Clock Speed 16MHz 1.2GHz
RAM 2kB 1GB
USB
SPI
USART
I2C
ADC -
Operating System - Linux
Language C, C++ C++, Java, Python
Cost $49 $56
The Arduino by this comparison can be assumed to be inferior however for the
proposed application it is still considered suitable. Both the Arduino and Raspberry Pi
can be interfaced with a laptop via direct serial connection (USB) or wirelessly using
the ZigBee communication protocol and a wireless XBee shield. This data can be
directly analysed using the MATLAB programming environment.
The Arduino has less overheads in comparison with the Raspbery Pi as it simply
executes the written code as the firmware interperates it without an operating system.
The Raspberry Pi programming environment can be considered more complex due to
the Linux environment and Python language. The clear advantages of the Raspberry
Pi are the processing power and operting system functionality however the hardware
connections are not as distinct in comparison with the Arduino. The main purpose of
an Arduino is for sensor applications with greter flexibility for inputs and outputs.
After consideration of both platforms the Arduino as shown left in Figure 3-5 is the
Dean Starkey | 0061038897 40 Figure 3-5 Arduino UNO (Left), Raspberry Pi (Right) (element14)
Resource Analysis
Hardware resources required for the build of the measurement system are considered
in Table 3-4.
Table 3-4 Resource Analysis
Resource Image Source Qty Comments Cost
Arduino UNO Element14 1 MCU development
platform $49
Arduino prototype board,
wireless and SD card
shield
Element14 1
For connection of
XBee wireless
modules and SD
card
$28
Accelerometer
ADXL345 Element14 1
Tri axis
accelerometer
mounted on PCB
Dean Starkey | 0061038897 41
Resource Image Source Qty Comments Cost
PRO power 0.055mm2 6
core screened cable Element14 10m
Cable for
connection from
sensor to Arduino
$28
XBee PRO wireless
module Element14 2
Wireless module for
communication
between PC and
Arduino
$106
XBee Explorer USB Australian
Robotics 1
Serial base unit for
XBee. For
programming and
communicating
between XBee and
PC.
$39
DC Vibration Motor Zoxoro
Australia 1
DC vibration motor
for testing sensor
repsonse
$30
Lithium rechargeable
battery and charger
Little Bird
Electronics 1
Rechargeable
battery supply for
Arduino
$57
Arduino enclosure Little Bird
Electronics 1
Enclosure to house
Arduino $25
Electrolube Epoxy, White Element14 250g
Epoxy resin for
electrical
encapsulation and
potting
$30
Dean Starkey | 0061038897 42
3.2
Measurement System Software
To capture the data from the ADXL345 a suitable program is to be developed to
communicate between the microcontroller and sensor. Firmware for the sensor is to be
created in the Arduino IDE programming environment and uploaded to the
microcontroller. The sensor will communicate in SPI with the microcontroller sending
the measurement readings as ASCII characters to the microcontroller at a high data
rate. The microcontroller is to perform minimal on board processing of the
measurements as to not slow the data flow. To maintain real time data capture the
signal processing is to be performed on a laptop computer with suitable processing
capabilities.
A Graphical User Interface (GUI) is to be developed in MATLAB for real time
processing. The idea behind a user interface is from commercial vibration monitoring
systems which offer real time processing. An advantage of vibration condition
monitoring is that the user can make decisions about the health of an asset often
instantly without the need for post processing. The user should be able to have instant
access to the vibration data and be able to make assessments without returning to the
office to analyse the results.
Signal processing of the acquired vibration signal is to be performed by the software
developed. As the proposed sensing is not time coherent the non-zero values at the
start and end of sensing will cause spectral leakage, degrading the resolution when
using FFT. The application of a window function in MATLAB can be used in addition
to FFT for analysis. Whilst analysing the signal using FFT is for a specific moment in
time it is important that the user be updated with the frequency components in real
time also. With the above taken into consideration the simplified program flow chart
Dean Starkey | 0061038897 43
Initialise Sensor GUI start button
Inintialise SPI Comm. Setup Sensor Comm. Port
Setup Interrupts to
transmit data Store in array
Start Reading
x, y, z Convert to acceleration
Check if data
buffer filled Filter Data
Transmit Data Plot FFT & PSD
MATLAB Arduino Firmware
Figure 3-6 Simplified program flow chart Y
Dean Starkey | 0061038897 44
3.3
Controlled Experiment
A controlled experiment will simulate the vibrations at a particular frequency to ensure
that the sensors are operating correctly. This experiment utilises a DC magnetic
vibration motor which will simulate vibrations at a known frequency. The sensor is
attached to the vibration motor with a suitable coupling gel and connected to the
microcontroller. A series of tests are to be conducted and results analysed in real time
and post processing applied. The measurement set up is shown in Figure 3-7.
Figure 3-7 Experimental setup representation
A vibration motor has a large range of applications and has been used by researchers
including Saponara et al. (2015) to validate accelerometer readings to a known source.
A cylinder type vibration motor has a DC motor of similar type construction to that
shown in Figure 3-8. The motor vibrates due to the off centred mass attached to the
end of the rotating shaft. The vibration force can be adjusted by the mass connected to
the shaft and the frequency is a function of the motor speed in revolutions per minute
given by the following equations.
𝑓𝑣𝑖𝑏𝑟𝑎𝑡𝑖𝑜𝑛 =
𝑀𝑜𝑡𝑜𝑟𝑅𝑃𝑀
60 ( 10 )
𝐹𝑣𝑖𝑏𝑟𝑎𝑡𝑖𝑜𝑛 = 𝑚𝑟𝜔^2
( 11 )
Dean Starkey | 0061038897 45 Figure 3-8 Vibration motor construction (top), Uxcell vibration motor (bottom)
(Microdrives 2016)
Table 3-5 outlines the manufacturer specifications for the chosen vibration motor.
Table 3-5 Vibration motor characteristics
Attribute Uxcell Vibration motor
Voltage DC 6-24V
Speed 2 – 10000 RPM
Dimensions 25 x 38 mm
Vibration frequency 1 to 167 Hz
Dean Starkey | 0061038897 46
3.4
Field Testing
Test reports for substations where DGA reveals high levels of H2 are analysed with
assistance from experts in this field to obtain a suitable list of monitoring sites.
Following testing, the developed measurement system will be installed at the selected
locations and monitored for a period of time. Data will need to be reviewed between
installation at new locations to determine if there are any fundamental flaws with the
system and that the results are as expected. In addition to a site with insulation
degradation a location is selected which is assumed to have no degradation. The site
where insulation integrity is maintained is measured to provide a baseline for
comparison.
Condition Analysis
Challenges were encountered in the selection of suitable sites due to the lack of records
and history kept on substation DGA results. Survey results were made available from
2016 data although no past history was obtaned for specific sites. There are difficulties
in assessing DGA results if a location has no previous measurement history. A four
level criteria developed by IEEE Std C57.104 (2009) is recommended where historical
readings are not available. This method has been adopted which uses concentrations
to make determinations on the condition as follows:
Condtion 1 – Indicates the transformer is operating satisfactorily
Condtion 2 – Indicates greater than normal combustion levels. Action should be taken to establish a trend.
Condtion 3 – Indicates a high level of decomposition. Immediate action should be taken to establish a trend.
Condtion 4 – Indicates excessive decomposition. Continued operation could result in failure.
Dean Starkey | 0061038897 47 Table 3-6 Dissolved Gas Analysis Condition Limits (IEEE Std C57.104 2009)
Site Selection
Six sites have been selected for field testing based on available DGA reports and are
shown in Figure 3-9 as well as compared in the following Table 3-7. The sites chosen
are of differing manufacturers, voltage ratios and age with differing insulation
condition.
Table 3-7 Sites 1 to 6 comparison
Attribute Site 1 Site 2 Site 3 Site 4 Site 5 Site 6
Commissioned year 1979 1970 1994 1994 2007 2011
Age in Years as of 9/16 38 46 22 22 9 5
Primary / Secondary (kV) 33/11 33/11 132/11 132/11 66/11 132/11
Nameplate Rating (ONAN) 15MVA 15MVA 25MVA 25MVA 20MVA 30MVA
Manufacturer Tyree Standard
Waygood Asea Brown Broveri Asea Brown Broveri
Wilson Wilson
Type of Insulation Oil Oil Oil Oil Oil Oil
Vector Group DYN1 DYN1 YND1 YND1 DYN1 YND1
No of Pumps 1 2 1 1 1 1
Dean Starkey | 0061038897 48 Figure 3-9 Site 1 (Top Left), Site 2 (Top Right), Site 3 (Middle Left), Site 4 (Middle
Right), Site 5 (Bottom Left), Site 6 (Bottom Right)
Dean Starkey | 0061038897 49 Table 3-8 DGA Results, Sites 1, 2 & 3
Component (ppm) Formula Site 1 Site 2 Site 3 Site 4 Site 5 Site 6
Hydrogen H2 213 81 196 28 2.8 6.3
Oxygen O2 1160 969 21000 9310 31900 31400
Nitrogen N2 45600 78500 72500 55500 66300 66800
Methane CH4 92 147 27 4 0.8 0.9
Carbon Monoxide CO 809 1400 622 746 40 83
Carbon Dioxide CO2 3340 4770 4260 1010 424 534
Ethylene C2H4 207 49 38 < 1 0.5 0.6
Ethane C2H6 38 117 2 < 1 0.08 0.1
Acetylene C2H2 23 11 239 < 1 0 0
Propane C3H8 56 132 8 < 1 0.1 0.5
Total Dis. Comb. Gas TDCG 1438 1937 1131 778 44 91
Through application of the condition criteria shown in Table 3-9, it is evident that Sites
1-3 have serious decomposition. Comments from an expert chemist in is that the DGA
results indicate discharges of high energy are probably present at these locations. As a
product of the poor results and historical results at site 1 it is planned that the substation
be replaced before the end of 2017. Sites 2 and 3 are being routinely tested to monitor
any further deterioration in condition. In comparison both sites 5 and 6 results are
considered satisfactory and are to act as a baseline measurement.
Table 3-9 Transformer Condition Assessment
Component Hydrogen (ppm) Methane (ppm) Acetelyne (ppm) Ethylene (ppm) Carbon Monoxide (ppm) Carbon Dioxide (ppm) Total Disolved Combustable Gas (ppm)
Known As H2 CH4 C2H2 C2H4 CO CO2 TDCG
Site 1 Condition 2 Condition 1 Condition 3 Condition 4 Condition 3 Condition 2 Condition 2
Site 2 Condition 1 Condition 2 Condition 3 Condition 1 Condition 4 Condition 3 Condition 3
Site 3 Condition 2 Condition 1 Condition 4 Condition 1 Condition 3 Condition 3 Condition 2
Site 4 Condition 1 Condition 1 Condition 1 Condition 1Condition 3 Condition 1 Condition 2
Dean Starkey | 0061038897 50
3.5
Risk Assessment
Risks associated with physical safety are assessed and categorised in line with
workplace procedures and safe work method statements (SWMS). As part of
workplace safety policy before commencing work a hazard assessment check (HAC)
form will be required to document worksite specific hazards. This document is to be
completed in association with reading the relevant SWMS for the task.
A strategy employed to mitigate risk is applying a hierarchy of controls with the most
effective control being elimination and least effective control is the use of personal
protective equipment (PPE). Working through the list of controls is a method of
reducing the level of risk to the lowest possible, these are:
Eliminate Removal of the hazard completely
Substitute Change process or item to reduce risk
Isolate Use preventative measures
Engineer Use mechanical aids, barriers etc
Administrative Develop safe work procedures
PPE Use protective equipment, e.g. gloves, hard hat etc.
The installation of an acoustic measuring device requires substation access to mount
the device on the transformer walls. Gaining access to substations is part of current
employment duties and whilst considered a common task in the work place various
hazards are introduced and need to be assessed. Risks are standardised using the
risk matrix in and common risks associated with working in substations are
Dean Starkey | 0061038897 51
VIBRATION MONITORING SYSTEM
4.1
Hardware Development
Wireless communication
For the monitoring system to be suitable for installation a wireless network connection
is required. XBee modems are Arduino compatible and are purpose built on a
development board for easy connection with the use of a wireless Arduino Shield as
shown in Figure 4-1.
Figure 4-1 XBee communication Arduino to PC
Table 4-1 outlines some of the key characteristics of the XBee Pro.
Table 4-1 XBee Pro characteristics (Digi 2014)
Performance XBee Pro 802.15.4
RF Data Rate 250kbps
Indoor Urban Range 100 m
Outdoor Range 1.6 km
Transmit Power 60 mW
Receiver Sensitivity -100 dBm
Dean Starkey | 0061038897 52 Performance XBee Pro 802.15.4
Configuration API or AT
Frequency Band 2.4 GHz
The Arduino utilises a single hardware UART which is used for either programming
the board or serial communication to a PC. An important component of the wireless
shield is the MICRO/USB switch. This switch controls the selection between serial
communication for software and hardware. To upload a program to the Arduino the
DIP switch is in the USB position. To communicate with the PC wirelessly the switch
is changed to the Micro position as shown in Figure 4-2.
Figure 4-2 Wireless shield UART selection switch
The XBee family of RF modules utilise the ZigBee communication protocol for data
transmission. The ZigBee protocol is based on the 802.15.4 standard for wireless
communication by IEEE which was developed for low power consumption and battery
applications. The standard specifies the access control for low data rate area networks
and the physical layer structure. This standard specifies that communication should
Dean Starkey | 0061038897 53 is 250 kbps however due to the overheads of this protocol the theoretical maximum is
only half this. ZigBee caters for mesh networking which is ideal for this application
where the distance between two points say A and B may be out of range, an
intermediate radio at point C can be used to forward a message as shown in Figure 4-3.
Figure 4-3 ZigBee mesh network example
XBee modules support both AT (transparent) and API serial interfaces. When
operating in transparent mode any data sent to the XBee is immediately sent to the
module identified by the destination address. For this mode no packet information is
required, the data is simply sent to the TX of the transmission XBee and received on
the RX of the receiving XBee. Transparent mode is generally used in point to point
communication links where data is sent to a single coordinator. In comparison API is
a more complicated option however provides sophisticated ability to transmit packets,
and allows for changes to the parameters without entering command mode which sends
the module to sleep. For this mode data must be formatted in frames with destination
and payload information. An advantage of this mode is that the end devices can enter
a sleep mode until data is ready for transmitting. For this application the AT mode of
operation has been chosen as the communication at this stage is only required between
Dean Starkey | 0061038897 54 Configuring of the XBee modules for wireless communication using AT mode requires
the setting of key fields utilising the programming software XCTU developed by Digi.
The following key fields are to be set:
Channel (CH)– This setting controls the frequency band.
Personal Area Network (ID) – The network ID in hexadecimal between 0 and 0xFFFF. Communica