Thesis by
Jonathan W. Young
In Partial Fulfillment of the Requirements for the Degree of
Doctor of Philosophy
California Institute of Technology Pasadena, California
2012
© 2012
Acknowledgements
James Locke was a critical contributor to this thesis and essentially served the role of a co-advisor for my PhD. His craft for shaping the story of science, which experiments to pursue, and how best to visualize data were skills he taught me throughout our work, and I am eternally grateful. I wish him the best as he starts his own lab, as he will make an outstanding PI.
I would like to thank Michael Elowitz profusely for many reasons. First, back in 2003 I was an out-of-work college graduate living off his girlfriend’s graduate school stipend and struggling to find work. Michael brought me into his new lab, taught me an incredible amount of microscopy, and supported me as I moved onto my MD/PhD program. During my PhD years he has provided incredible ideas for experiments, refined my scientific communication, and given me wonderful opportunities to travel and advance my career.
In no particular order, shout outs go to: Chiraj Dalal, for being an outstanding distraction at any given time. I don’t know how many total hours we spent critically thinking about things, not one of them being science. Team Playmakers, for some wonderful memories about D-league flag-football. Joe Levine, Fred Tan, and Sandy Nandagopal, for humor and being a great workout group. Michelle Shah, for 100% positive attitude, 100% of the time. Raj Kulkarni, for his invaluable wisdom with all things medical school. Adam Rosenthal, for his help in analyzing the RNAseq data. Ernie’s Al Fresco, for providing fabulous nourishment (nlunch≥500). And the rest of the Elowitz Lab, for support and
advice.
Abstract
Cells exhibit diverse and dynamic responses to stress. However, in many cases it remains unclear what the dynamics are, how they are generated, and why they are beneficial to the cell or organism. To investigate these issues we studied the General Stress Response inB. subtilis, a critical, conserved stress signaling pathway, mediated by the alternative sigma factor,σB. First, we find thatσB activates
with stochastic, frequency modulated pulses in response to energy stress. We explore the mechanism behind this striking response and find that a small, compact circuit facilitates this behavior. Second, we find thatσBactivates with a single-homogenous pulse of activity exposed to environmental stress, in contrast to energy stress dynamics. We also find that activation is rate-responsive, and show how this property may separate broad and specific regulatory modes. Lastly, we present some preliminary work toward a synthetic sigma factor activation circuit. Combined, these results present a comprehensive study ofσB activation and generate a platform by which other dynamic stress response systems can
Contents
Acknowledgements iii
Abstract iv
1 Introduction 3
2 Stochatic Pulse Regulation in Bacterial Stress Response 7
2.1 Supplemental Figures . . . 15
2.2 Supplemental Methods . . . 28
3 Rate of Environmental Change Determines Stress Response Specificity in Bacteria 43 3.1 Introduction . . . 43
3.2 Results . . . 45
3.3 Discussion . . . 50
3.4 Supplemental Figures . . . 53
3.5 Methods . . . 57
4 Transplanting a Non-native Sigma Factor Circuit 61 4.1 Introduction . . . 61
4.2 Results . . . 62
4.3 Conclusions . . . 65
4.4 Methods . . . 66
Chapter 1
Introduction
Signaling systems are a critical organized unit of biology. Defined in basic terms, a signaling system is composed of cellular materials that allow a cell to respond and adapt to changing environmental or intracellular conditions. Systems are composed of the basic building tools of cells, proteins and genes. Proteins sense environmental changes, transduce them into intracellular signals, and respond and change the cellular state. In addition to using proteins, an overwhelming part of cellular response involves changes to gene expression. Cells may activate or repress genes, or a combination of both. Often, this regulation is the key determinant in signaling function. When faced with exposure to antibiotics, bacteria may increase the expression of the antibiotic transporter in an attempt to reduce antibiotic concentrations within the cell (Nikaido, 2009). In contrast, a decrease in pluripotency gene expression may accompany stem-cells exposure to differentiation signals (Loh et al., 2006; Ivanova et al., 2006). These examples serve as a small subset of the total influence of signaling systems. In fact, I argue its near impossible for some cellular response to not rely on some signaling system, as if the response comes ethereally from outside the cell. There may be cell responses we dont understand, but a basic assumption is that some factor, whether it is protein or some other molecule, mediates that response.
connec-for dramatic effect.
Many of early experiments left large gaps in our understanding of these systems. Conventional genetic methods for studying cell responses, such as mutational and knockout studies, often cannot detect important quantitative relationships within the signaling pathway, such as the strength of interactions. Furthermore, many biologic assays historically have compared cell outputs at static time-points, unable to capture dynamic information. Even when measuring responses over time, common population based assays destroy cells, precluding response data in the same cell over time.
Technological advancements, such as the development of non-destructive in-vivo labeling agents such as fluorescent proteins, have allowed researchers make progress in these arenas (Shimomura et al., 1962; Chalfie et al., 1994). Our lab has used these tools extensively in the past decade and made key contributions in understanding important stress and developmental signaling pathways. This thesis serves to extend this effort, and focuses on critical, general, and quantitative questions facing all pathways. One, what are the dynamic single-cell responses of pathways? Cells act as individuals and analyzing responses at this level may deepen our understand of how a particular pathway operates. Second, how does signaling circuit architecture contribute to these dynamics? We can use a combination of genetic tools, including circuit rewiring to probe how precisely components come together to produce a behavior. Quantitative modeling of circuits can give us predictions, which can then be experimentally tested. Lastly, what function do these dynamics confer to the cell?
Previous studies have addressed some of these questions in diverse systems. In yeast, Cai and Dalal Cai et al. (2008) discovered that a transcription factor, Crz1, responsible for the cellular response to Calcium exposure, translocated to the nucleus from the cytoplasm in bursts. These bursts were frequency modulated (FM), in that Crz1 burst frequency increased as the level of Calcium increased. The authors showed the this type of regulation permitted proportional control over gene expression, something otherwise difficult to achieve in eukaryotic systems. However, the mechanism by which FM could be achieved by this signaling system was still unknown.
the master regulator of competence, ComK, was shown to activate excitably, resulting in a pulse of activity. This transient activation was shown, through mathematical modeling and experiments, to result from an interaction of positive and negative feedback loops. Whether other such systems use similar strategies to generate transient activity were open questions.
To further develop our understanding of dynamic gene expression systems, we focused our studies on a critical signaling pathway ofBacillus subtilis, which centers around the control of an alternative sigma factor,σB (Hecker et al., 2007). Sigma factors are a key subunit of bacterial RNA polymerase,
the final piece of a protein complex that allows the polymerase to bind to promoter regions and initiate transcription. Different sigma factors bind distinct promoter consensus sequences and each has a specific group of genes that they are responsible for regulating (Gruber and Gross, 2003). In all bacteria, a house-keeping sigma factor controls the expression of basal metabolic and necessary proteins for cell growth and division. Alternative sigma factors, those outside of the house-keeping sigma factors, are responsible for controlling responses to environmental stress. Each species of bacteria contain different number of alternative sigma factors and it is thought that the diversity of sigmas reflects the diversity of conditions and environment the bacteria experience. For example, obligate intracellular pathogens such as Mycoplasma genitalium grow in environments buffered by the host, and only contain a single sigma factor. In contrast, soil bacterium, such asB. subtilis, face a variety of quickly changing environmental conditions and must be poised to adapt. At present, researchers have identified at least 14 different sigma factors inB. subtilis. This number seems impressive, until one considersStreptomyces coelicolor, another soil dwelling organism known to have at least 60 sigma factors!
It seems perplexing that the bacteria would use sigma factors, when it seems like transcription factors, regulatory proteins that also control transcription, could easily supplant the need for this additional layer of regulation. Why couldn’t a cell use a transcription factor where a sigma factor is used? This question, seemingly fundamental to how and why sigma factors have developed, remains unasked in the literature.
would activate gene expression, but are regulated and sequestered by complex means, so accessibility to the RNA polymerase is prevented. For many sigma factors, including σB, a unique anti-sigma
factor exists and binds to the sigma and prevents transcriptional activation(Osterberg et al., 2011). Under activating conditions, events cause the eventual dissociation of the anti-sigma factor from the sigma factor, which then allows association of RNA polymerase and gene production. The conventional thought about this sequestration mechanism is that it allows release of sigma factor without additional transcription, which may enable rapid responses to environmental insults.
Its worthwhile to ask though, within this sigma/anti-sigma factor framework, whether there are other possible reasons for using sigma factors. Could it be that the cell uses the sigma factor platform to develop novel gene regulatory mechanisms and modes, quickly and easily to suit circumstances? The work in this thesis serves to support this idea. Further chapters will reveal thatσB uses a simple
signaling architecture that yields rich dynamics and interesting outputs to control its large downstream regulon. In Chapter 2, we uncover that σB activates under energy stress using pulses of activation, that increase in frequency with increasing stress. The mechanism behind this response, including how the signaling circuit contributes to the response, is discussed at length. In Chapter 3, we explore how σB activates under physical stress, and describe how the response magnitude is proportional
Chapter 2
Stochatic Pulse Regulation in
Bacterial Stress Response
Gene regulatory circuits exhibit significant fluctuations, (‘noise’), in their components (Raj and van Oudenaarden, 2008; Rosenfeld et al., 2005)1. Noise can play a functional role in some systems (Eldar
et al., 2009), generating necessary phenotypic diversity Losick and Desplan (2008), and allowing al-ternative regulatory strategies (Cai et al., 2008). However, it remains unclear how genetic circuits use noise to control cellular behaviors. Here we show howσB, the regulator of general stress response in
B. subtilis(Hecker et al., 2007; Haldenwang and Losick, 1979; Igoshin et al., 2007), controls its targets using a noise-dependent pulse frequency modulation system (figure 2.1A).
In prokaryotes, alternative sigma factors form a part of the RNA polymerase holoenzyme, directing it to key regulons, which control distinct regulatory programs (Gruber and Gross, 2003). σBis found in gram-positive bacteria, and impacts pathogenicity inListeria monocytogenesandStaphyloccous aureus (Kazmierczak et al., 2003; Lorenz et al., 2008). InB. subtilis, σB activates over 150 target genes in
response to diverse stresses (Hecker and Volker, 1998; Hecker et al., 2007). σB is kept inactive by its
anti-sigma factor RsbW, and is activated by the anti-anti-sigma factor RsbV, which can be reversibly phosphorylated (see figure 2.1B-C for regulatory interactions). To analyze σB activation dynamics,
we constructed reporter strains incorporating a yellow fluorescent reporter (yfp) forσB activity (figure 2.1B), and used quantitative time-lapse microscopy to followσB activation in individual cells (Locke and Elowitz, 2009). To quantify σB activity in movies, we computed the P
sigB promoter activity,
defined as the rate of production of YFP (figure 2.5A and supplementary).
P V W YFP YFP σB W W σB V σ
B P
romot
er A
ctivit
y (au)
Energy stress (+MPA)
V W V P σB V W Time Sig nal I nput Sy st em O uput
D
E
Low Input Low Frequency High Input High Frequency0 10 20 30 40 50 60
0
Energy stress input, MPA (µg/mL)
Pulse F req (1/hour)
F
σB ON State OFF State 0 10 20 30 40 500 200 400 600
Time (Minutes)
Pulses per c
ell c
ycle
Pulse Amplitude (au)
20 30 40 50 60 70 80
0 0.1 0.2 5 0 10 20 40 60 MPA (µg/mL)
t=0 min 105 210 315
420 525 630 735
PsigB
G
H
0 10 20 30 40 50 60
0 10 2.0 1.5 1.0 0.5 20 30 30 40 40 0 Pulse A mplitude (au) D ur ation (hrs)
Energy stress input, MPA (µg/mL) 0.2
[image:12.612.122.542.56.420.2]0.1
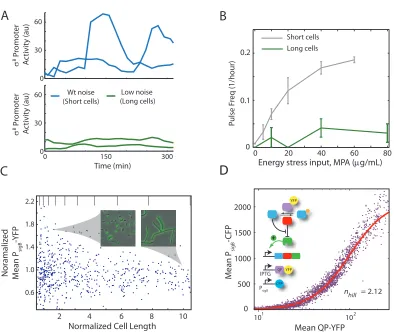
Figure 2.1: Energy stress modulates the frequency of stochastic pulses of σB activation. (A) In a
Frequency Modulated (FM) system, a low or high constant input signal (black line) results in low or high frequency of stochastic pulses, respectively (blue line). (B) σB can be inhibited by
anti-sigma factor, RsbW (W, red), which can in turn be inhibited by the anti-anti-anti-sigma factor RsbV (V, blue). UninhibitedσB activates its own operon. RsbV phosphorylation is controlled by the RsbQP phosphatase complex (QP, purple) and the RsbW kinase activity. (C) Partner switching controls
σB activity. When RsbV is phosphorylated (off), σB is inactive, bound to RsbW. Under energy stress RsbV is dephosphorylated (on) and binds to RsbW, releasingσBto activate endogeneous target genes and a yfp reporter (yellow). (D) Filmstrip ofσB activation at 60 µg/mL MPA. Heterogeneous
expression levels of PsigB -YFP reflect pulsing activity. (E) Promoter activity of the PsigB -YFP
reporter pulses in individual lineages (colored solid lines), and its mean and standard deviation across all lineages in 4 movies (dashed line and shaded area, respectively). (F,G) MPA concentration strongly modulates the mean frequency, whilst more weakly modulating the mean amplitude and duration, of pulses. (H) Pulse amplitude histograms for varying levels of MPA. In (F-H), each data point represents statistics from four microcolonies, acquired on two different days.
2.9). Increasing MPA concentration caused a strong increase in pulse frequency, with weaker increases in mean pulse amplitude and duration (figure 2.1E, 2.10), showing thatσB is regulated predominantly
by frequency modulation (FM) in response to energy stress (figure 2.1A). Pulse amplitudes exhibited broad and monotonically increasing variability with increasing MPA, with coefficients of variation ranging from 0.16 to 0.70 (figure 2.1F). Together, these results provoke the question of how FM pulse regulation is implemented by theσB regulation circuit.
In principle, pulses could be generated in two qualitatively distinct ways: They could arise through amplification of an inherently stochastic underlying process Hodgkin1952JP, Suel2006N). Alternatively, they could result from a limit cycle oscillator whose dynamics become erratic due to noise (Elowitz and Leibler, 2000). Systematically reducing cellular noise would distinguish between these possibilities, eliminating pulses in the first case, but making them more regular in the second case.
To modulate the amplitude of noise in cells, we created strains which could be induced to grow into long multi-nucleoid filaments by controlling expression of FtsW, a cell division protein necessary for septation. These cells exhibit similar mean expression levels of cellular components (figure 2.11) but reduced fluctuations (Suel et al., 2007), allowing us to test how reduced noise affects pulse frequency. In time-lapse movies, we observed a systematic decline in pulse frequency in noise-reduced (long) cells across a range of energy stress levels (2.2A, 2.12), which was also consistent with reduced cell-cell variability inσB activity in liquid conditions (2.2B). This reduction in pulse frequency did not reflect
reduced sensitivity to MPA, which had a similar effect on growth rate in long and short cells (figure 2.12). Together, these results rule out limit cycle models and suggest a noise-dependent mechanism for pulse generation.
How, then, does the σB circuit amplify noise to initiate discrete pulses of σB activity? To
ad-dress this question we analyzed the response ofσB to increased expression of each circuit component.
Up-regulation of kinase (RsbW) and phosphatase (RsbQP) expression had much stronger (opposite) effects on σB activity compared to up-regulation of RsbV (figure 2.13). This result is interesting
phos-M ean P sigB -CFP 102 101 0 500 1000 1500 2000 hill
n = 2.12
Mean QP-YFP IPTG QP
YFP
YFP
PsigB CFP
D
Normalized Cell Length
Nor amaliz ed M ean P sigB -Y FP 150 Time (min) 0 300 Low noise (Long cells) Wt noise (Short cells) 60 30 0 30 0 σ
B P
romot er Ac tivit y (au) σ
B P
romot er Ac tivit y (au)
C
2 4 6 8 10
0.6 1.0 1.4 1.8 2.2 0 0 0.1 0.2
40 60 80
20 Long cells Short cells
D
Energy stress input, MPA (µg/mL)Pulse F
[image:14.612.134.528.66.398.2]req (1/hour)
Figure 2.2: Pulsing is noise-dependent and involves an ultrasensitive phospho-switch. (A)σB activity
traces from two cell lineages, in a conditional ftsW strain in which septation was normal (short cells, top) or inhibited (long cells, bottom) at 40µg/mL MPA. (B) Pulse frequency in long cells (green) is strongly reduced compared to short cells (gray, replotted for comparison from figure 2.5F). Error bars, mean±SEM (C) Static variability in PsigB -YFP expression decreases with increasing cell length (cf.
figure 2.12). Equal number of cells (represented by dots) are plotted in each log-spaced bin (delimited by gray vertical lines). Inset: overlay of phase contrast and PsigB-YFP expression (green) at different
cell lengths. Note greater σB variability in short cells. (D) σB expression is ultrasensitive to QP phosphatase levels. Each dot represents the mean QP-YFP level and PsigB -CFP level of one cell,
using the strain shown schematically. Red line is a Hill function with Hill coefficientnH = 2.12 (95%
CI,nH = 2.09-2.15). See supplementary for strain details.
phatase and kinase operate at saturation (Goldbeter and Koshland, 1981; Melen et al., 2005; Cheng et al., 2009). We found thatσBactivity exhibited an ultrasensitive response to inducible phosphatase
concentration (2.2C, 2.14), with an effective Hill coefficient of 2.12 (95% CI, nH=2.09-2.15). Similar
results were also observed with the RsbTU phosphatase (figure 2.15). Moreover, this ultrasensitivity was not due to the transcriptional feedback loop. It could be observed in an ‘open-loop’ strain, in which operon expression was inducible and independent of σB (figure 2.16). In this strain,
shifted the switching point to higher phosphatase expression levels (figure 2.17). This ultrasensitive phospho-switch could activate σB in response to fluctuations in the phosphatase/kinase ratio and
thereby initiate pulses.
How are σB pulses further amplified and subsequently terminated? σB activates its own operon (rsbV-rsbW-sigB). This feedback loop could increaseσBactivity, due to the activating effects of RsbV andσB, or it could repressσB activity, due to increased production of RsbW. We hypothesized that
the phospho-switch sets a threshold between activating (phosphatase dominant) and repressing (kinase dominant) feedback regimes. As long as phosphatase activity exceeds kinase activity, activation of the operon increases freeσB (positive feedback). However, this also increases production of RsbW kinase.
When kinase activity approaches that of the phosphatase, increased operon expression will cause RsbW levels to cross the threshold, shutting off activation (negative feedback). Thus, autoregulation could result in a ‘mixed’ feedback loop, providing a compact mechanism to first amplify and then terminate a pulse (Ray and Igoshin, 2010).
To test this hypothesis, we constructed an open-loop strain and quantified the change in σB
activity in response to a step increase in operon expression. In these experiments, we first established a basal level of phosphatase activity in cells and subsequently induced a step, of varying size, in
σB operon expression (2.3A). We observed a striking transition between two qualitatively different
responses: At lower operon induction levels, the system produced a sustained response, while at higher induction levels, it exhibited a pulse (figure 2.3B). These results are consistent with the mixed feedback model: Initially, increased operon induction produces moreσB, which is active due to the high levels of phosphatase, engaging the postitive feedback loop. For lower (sub-threshold) operon induction levels, RsbW levels never exceed phosphatase levels, so the system remains on indefinitely (2.3A, dashed). In contrast, at higher induction levels (supra-threshold), RsbW activity eventually crosses the threshold set by the phosphatase, and thereby shuts the system off, resulting in a pulse (2.3A, solid). Indeed, RsbW dominated other operon components at steady-state, suppressing σB
-1 100
101 10 2 0 150 300 0 20 40 60 80 A K A K Time (M in)
Add IPTG
Open Loop Minimal Model experimental system IPTG Xylose P p p output Phospha tase A ctivit y (thr eshold) Oper on Expr ession σ
B A
ctivit
y
t
Add xylose
t = -1 hours Start movie t = 0 hours
Add IPTG t = 2 hours
Phospha tase A ctivit y (thr eshold) Oper on Expr ession σ
B A
ctivit y t
D
Sub-threshold P A TU TU V V V W W σB σB Sy st em O utput ( σB P
romot
er A
ctivit
y (au)
VWB operon promot
er
activity (au)
10
AK operon transcr
iption
rate (µM/min)
Time (M in) Sy st em O utput (unphor yla ted A )
E
10-4 10
-3 10-2
[image:16.612.120.542.62.331.2]10-1 150 300 0 1 2 Induce operon 0
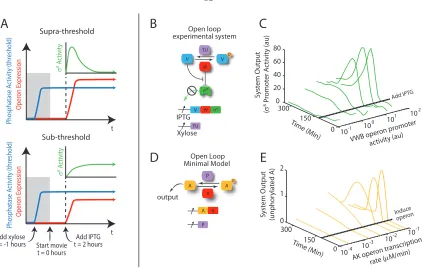
Figure 2.3: A mixed transcriptional feedback loop amplifies and terminates pulses. (A) Schematic diagram of supra- and sub-threshold protocols. Prior to time-lapse acquisition (gray shaded region), phosphatase is induced to a constant level by addition of xylose (see strain diagram in B). After the start of acquisition, IPTG is added to inducersbVWBto levels that exceed (top) or do not exceed (bottom) the level of phosphatase. This results in pulsed (top) or sustained (bottom)σBactivity dynamics. (B)
An ‘Open-loop’ strain allows independent control of σB operon and phosphatase (RsbTU, to avoid
energy stress inputs) expression by IPTG and xylose, respectively. (C)σB promoter activity exhibits
a transition between sub- and supra-threshold behaviors. Each trace shows the mean PsigB promoter
activity (YFP production rate) averaged over 4 colonies. The promoter activity of the IPTG-inducible
σB operon (x-axis) was estimated using a separate strain containing a similar IPTG-inducible yfp
reporter. Two repeat movies showed similar behaviors. (D) A minimal mathematical model of the open-loop σB network. In this model, an unphosphorylated activator, A, directly activates target
genes (see supplementary modeling section). (E) The minimal model reproduces the main features of the experimental data (C).
after the initiating fluctuation, as confirmed experimentally (figure 2.18). A minimal mathematical model of the circuit exhibited qualitatively similar behavior (figure 2.3C). This mechanism for pulse initiation, amplification, and termination is summarized in 2.4A,B.
These results provoke a final question: how can the cell modulate the frequency of pulses in this system? Systematic changes in the activity of either kinase or phosphatase could modulate the likelihood of threshold-crossing events, and thereby control pulse frequency. We first examined the distribution of RsbQP expression levels, using a PrsbQP-rsbQP-YFP protein fusion that complements
(independently determined) ultrasensitive response function (2.2C). These results suggest that stress increases σB pulse frequency by increasing the distribution of RsbQP expression levels, and thereby
increasing the frequency with which RsbQP fluctuations cross the threshold set by RsbW (2.4C). Note that these results do not rule out the complementary possibility, suggested previously (Alper et al., 1994), that some energy stresses may activateσB by reducing kinase activity.
To show that this mechanism is indeed sufficient to enable frequency modulation, we rewired the endogeneous circuit, replacing RsbQP with an inducible, constitutively active RsbTU phosphatase complex that unaffected by energy stress (2.4D, inset). The rewired system exhibited stochastic pulsing in response to RsbTU expression (figure 2.21, 2.22 and movie S2). Furthermore, we observed an increased frequency of pulsing in response to increased RsbTU phosphatase expression (2.4E), with weaker effects on pulse amplitude and duration (figure 2.24). These results, qualitatively similar to those observed in wild-type cells under energy stress, also match an extended mathematical model that includes the wild-type transcriptional feedback (gray dashed lines in 2.4E-F, figure 2.23, figure 2.24 and supplementary text). Thus, modulation of phosphatase expression is sufficient to recapitulate FM pulsing, and no special property of the RsbQP phosphatase is required.
FM pulsing can be implemented by a strikingly simple circuit of three genes (rsbW,rsbV,sigB), with input from a phosphatase complex. This system provides a fundamental signal processing capa-bility to bacterial cells, enabling them to convert steady “DC” inputs into pulsatile, predominantly “AC” outputs. Noise plays a key functional role in this signal processing system (Eldar et al., 2009). TheσB circuit conserves its core architecture in diverse bacteria (Hecker et al., 2007), and other al-ternative sigma factors similarly feature both post-translational regulation by anti-sigma factors and autoregulatory feedback. Thus, related stochastic pulse modulation schemes are likely employed more generally in bacteria (Gruber and Gross, 2003). The relatively slow timescale of σB pulses (figure
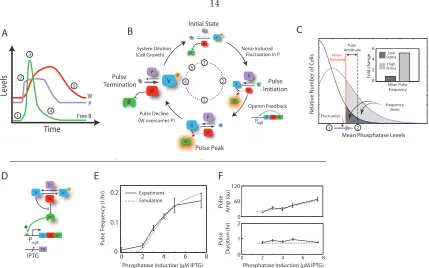
D W P Free B Time 5 4 2 3 1 Pulse Amplitude Frequency (Area) 0 Fold change Mean Pulse Frequency 2 4 6 Low Stress High Stress
Mean Phosphatase Levels
Rela
tiv
e Number of C
ells ThresholdKinase
V W V P IPTG TU σB
V W σB
PsigB TU Noise Induced W V W V P P V W P P V Pulse Initiation Pulse Termination Pulse Decline System Dilution (Cell Growth) Operon Feedback W V P Pulse Peak
Fluctuation in P
(W overcomes P) PsigB V W B B B B P V 1 2 3 4 5 1 2 Fluctuation B E F
Phosphatase Induction (µM IPTG) Phosphatase Induction (µM IPTG)
Pulse F
requenc
y (1/hr) Pulse
A mp (au) Pulse D ur ation (hr)
0 2 4 6 8
0 0.1 0.2
0 2 4 6 8
[image:18.612.114.543.56.324.2]Experiment Simulation 0 1 2 60 0 120 Lev els
Figure 2.4: Mechanism of FM pulse control. (A) Schematic time-course of phosphatase RsbQP (de-noted P, purple), free σB (B, green), and kinase (W, red) during a pulse cycle. (B) Stages of pulse
generation. The relative concentration of each component is indicated schematically by size (compare to A). Circled numbers indicate specific stages: (1) Initial state: system components are present at low levels, and RsbV is mostly phosphorylated since kinase activities exceed phosphatase activities. A threshold-crossing upward fluctuation in RsbQP level can dephosphorylate VP, leading to pulse ini-tiation. (2) Initiation: Activation ofσB (indicated by glowing halo) leads to up-regulation of operon components. (3) Pulse peak: σB activity peaks just before RsbW kinase activity exceeds phosphatase activity. (4) Termination: Re-phosphorylation of RsbV shuts the system off. (5) Dilution: Compo-nent levels reset to the original state. (C) Threshold-crossing fluctuations enable FM. Fluctuations in phosphatase level (purple arrow from state 1 to 2) can cross the Kinase threshold (red line) to initiate pulses. Pulse amplitude is determined by the difference between phosphatase and kinase ac-tivities after the fluctuation (distance between dashed gray and solid red lines) and pulse frequency is determined by the fraction of the phosphatase distribution above the threshold (shaded areas), which differ for low and high stress (dark and light gray, respectively). (D) In the re-wired input strain, the energy stress phosphatase RsbQP is replaced by an IPTG-inducible, constitutively active RsbTU phosphatase (supplementary). (E) In this strain, pulse frequency increases with phosphatase induc-tion, while amplitude and duration are more weakly affected (F). These results are consistent with the corresponding model, hand-fit to these data (gray dashed lines). Each data point represents statistics from two colonies. Two repeat datasets showed similar trends. Due to the small number of pulses at 0µM IPTG, these data are omitted from (F).
and costs ofσB activation dynamically. It will be interesting to see whether other dynamic encoding
A
B
C
75 150 225 300 375
PsigB -Y FP P romot er A ctivit y
150 300 450 600 750
Time (min) Time (min)
[image:19.612.119.541.99.326.2]Cell L ength (au) PsigB -Y FP P romot er Ac tivit y (au) PsigB -Y FP M ean (au) 0 0 20 40 60 150 250 10 30 30 50
Figure 2.5: σB activity pulses under energy stress. (A) Example of cell lineage trace from a P
sigB-YFP
reporter strain (JJB240, see strain list) exposed to 60µg/mL MPA showing promoter activity (middle) calculated from the mean fluorescence (top) and the cell length (bottom). Alternating light/dark regions represent different cell cycles. (B-C) Cells also pulse under energy stress due to nutrient limitation / stationary phase. (B) Film strip of a time-lapse movie strain JJB240 grown on a LB/20 conditioned media pad mimicking stationary phase. Cells were grown to OD 1.8 and the resulting conditioned media was filtered from cells and made into low-melt agarose pads. Cells were then imaged on these conditioned pads (as described in supplementary methods). Colony images start from 450 min after the start of time-lapse to illustrate σB pulsing activity. (C) Cell lineage traces showing PsigB
-YFP promoter activity from movie described in (B), where t=0 min corresponds to the beginning of the filmstrip. For clarity, every 8th cell trace is shown.
wt ∆U
0 400 800 1200
QP ∆
∆ QP∆U
40 µg/mL MPA 0 µg/mL MPA
M
ean P
sigB
-Y
FP (au)
Figure 2.6: MPA induces σB activation through the RsbQP phosphatase. Wild-type (JJB213) and rsbU (JJB240) strains, where the environmental stress phosphatase is deleted, strongly activate σB
[image:19.612.226.435.500.644.2]0 0.2 0.4 0.6 0.8 1 0
10 20 30
0 0.2 0.4 0.6 0.8 1 0
10 20 30
% number of tr
ials
% number of tr
ials
P(pulse|parent pulse) P(pulse|sister pulse) Twin probability (measured vs expected) Parent-child probability
(measured vs expected)
A
B
Measured
[image:20.612.153.508.411.612.2]probability probabilityMeasured
Figure 2.7: Pulse characteristics indicate σB pulses are stochastic. (A) The probability of pulses in
generation n+1 is independent of the presence of pulses in generation n. The frequency of instances where a parent and subsequent child pulsed (green line) was compared to a bootstrapped model (histogram) where parent/child pulses were randomized. (B) Pulse probability is nearly independent of the presence of pulses in sister cells. Green line indicates measured probability and can be compared to expected probabilities in a bootstrap model where sister cell pulses are randomized. For further descriptions of statistical methods, see Supplemental Methods.
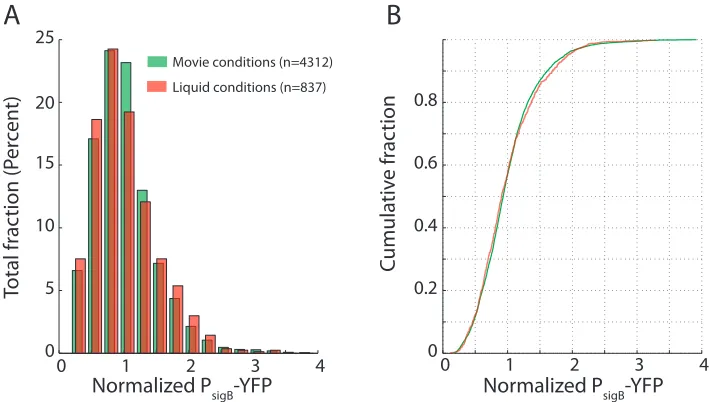
0 1 2 3 4
0 5 10 15 20
Movie conditions (n=4312) Liquid conditions (n=837)
25
0 1 2 3 4
0 0.2 0.4 0.6 0.8
A
B
Normalized P
sigB-YFP
Total fr
ac
tion (P
er
cen
t)
Cumula
tiv
e fr
ac
tion
Normalized P
sigB-YFP
Figure 2.8: σBactivity distributions exhibit similar variability in movies and liquid culture. (A) Mean
single-cell PsigB-YFP levels (shown in green) from strain JJB240 were extracted from individual frames
0 500 1000 1500 2000 2500 0
600 1200
= 0.639 PsigB CFP vs PyflA YFP
0 500 1000 1500 2000 2500
0 500 1000 1500
= 0.800
PsigB CFP vs PsigB YFP
0 500 1000 1500 2000 2500
0 500 1000 1500
= 0.708 PsigB CFP vs Pctc YFP
0 500 1000 1500 2000 2500 0
1000 2000
= 0.740 PsigB CFP vs Pcmp YFP
0 500 1000 1500 2000 2500
0 500 1000
= 0.717 PsigB CFP vs PcsbB YFP
0 500 1000 1500 2000 2500
0 600 1200
R2 = 0.815 PsigB CFP vs PgspA YFP
0 500 1000 1500 2000 2500
0 500 1000
= 0.076 PsigB CFP vs PsigA RFP
0 500 1000 1500 2000 2500
0 1000 2000
= 0.711 PsigB CFP vs PgsiB YFP
[image:21.612.119.542.163.533.2]R2 R2 R2 R2 R2 R2 R2 RFP CFP CFP CFP CFP CFP CFP CFP CFP YF P YF P YF P YF P YF P YF P
Figure 2.9: σB target genes are highly correlated at the single cell level. An independent YFP
transcriptional reporter of σB activity was integrated into the sacAlocus of an amyE::P
sigB-3Xcfp
ppsB::PsigA-mCherry reporter strain (JJB556-JJB572). Snapshots of gene expression were taken after
growth in SMM liquid culture under 40 µg/mL MPA energy stress for 90 min. (Top left) PsigA
-mCherry vs PsigB-3XCFP. In this control, no correlation is observed between σB and a constitutive
σA promoter. (B) (Top middle) P
sigB-YFP vs PsigB-CFP. In this ‘intrinsic noise’ strain, YFP and
CFP are values are highly correlated (high correlation coefficient (R2)) showing that the variation in
expression at the PsigB promoter is due to global changes inσB activity. (Other plots) DifferentσB
MPA 0 µg/ml MPA 5 µg/ml MPA 10 µg/ml
MPA 20 µg/ml MPA 40 µg/ml MPA 60 µg/ml
Time (min) Time (min)
Time (min)
P
sigB-Y
FP P
romot
er A
ctivit
y
0 100 200 300
0 20 40 60 80 100 120
0 100 200 300
0 20 40 60 80 100 120
0 200 400 600
0 20 40 60 80 100 120
0 200 400 600 800
0 20 40 60 80 100 120
0 200 400 600 800
0 20 40 60 80 100 120
0 200 400 600 800
[image:22.612.156.506.104.315.2]0 20 40 60 80 100 120
Figure 2.10: PsigB-YFP promoter activity traces of individual cell lineages from movies acquired at
various MPA concentrations. Cell lineage promoter activity traces of single movies from each MPA exposure. Pulse analysis of multiple movies comprise the data found in 2.1D-H in the main text. Every 8th cell trace is shown for clarity. For full time-lapse microscopy methods, see supplementary.
A
B
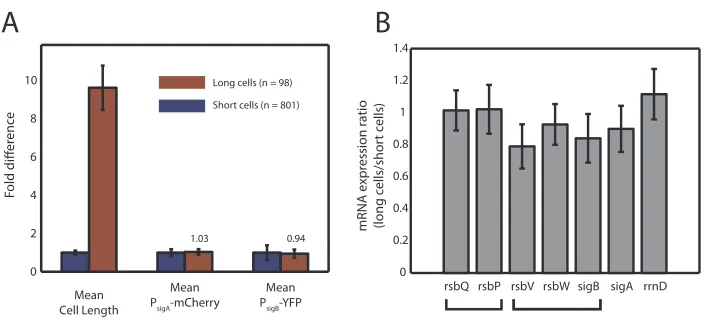
rsbQ rsbP rsbV rsbW sigB sigA rrnD 0 0.2 0.4 0.6 0.8 1 1.2 1.4 mRNA e xpr ession r atio (long c ells/shor t c ells) Fold diff er enc e 0 2 4 6 8 10 Mean Cell Length Mean
PsigA-mCherry PMeansigB-YFP
Short cells (n = 801) Long cells (n = 98)
0.94 1.03
Figure 2.11: RNA expression is consistent with fluorescent cell measurements in filamented cells. (A) Using strain JJB712, long filamented cells (red bars) show similar mean expression of PsigA-mCherry
and PsigB-YFP compared to wild-type cells (blue bars, each normalized to 1), despite 10-fold longer
mean cell length. Standard deviations are shown on bar plots (red bars are ratios to the wild-type values). (B) Histograms showing mRNA expression ratio of selected genes in long cells versus short cells, relative to mCherry expression, whose expression per cell volume was found to be constant (see A). Housekeeping andσB network components are expressed similarly in short cells versus long cells.
[image:22.612.155.508.437.597.2]0 200 400 600 800 0 20 40 60 80 100 120
0 200 400 600
0 20 40 60 80 100 120
0 200 400 600
0 20 40 60 80 100 120
MPA 20 µg/ml MPA 40 µg/ml
MPA 80 µg/ml
Time (min)
Time (min)
Time (min)
P
sigB-Y
FP P
romot
er A
ctivit
y
0 100 200 300 400
0 20 40 60 80 100 120
0 100 200 300 400
0 20 40 60 80 100 120
MPA Conc (µg/mL)
Normalized Cell Length
Nor maliz ed M ean Expr ession
2 4 6 8 10 0 20 40 60 80 0 0.5 0.4 0.8 1 1.5
PQP-3xYFP
PsigA-mCh
2 4 6 8 10 0
0.1 0.2 0.3 0.4
Normalized Cell Length
Coefficien
t of V
ar ia tion Nor maliz ed Gr owth Ra te (1/L•dL/dt )
PsigB-YFP Long cells
Normal-length cells
PsigA-mCh
MPA 0 µg/ml MPA 10 µg/ml
A
B
C
[image:23.612.116.543.184.488.2]D
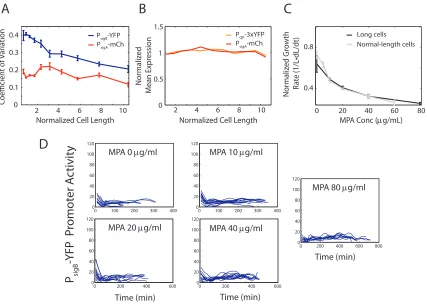
Figure 2.12: Reduced noise lowers PsigB-YFP variability and reduces pulsing without changing QP
phosphatase levels. (A) Plot of coefficient of variation of PsigB-YFP activity (blue trace) or constitutive
PsigA-mCherry reporter (red trace) versus normalized cell length in conditional ftsWfilament strain
(JJB712). At longer cell lengthsσB-YFP variability becomes comparable to that of the constitutive
σA reporter due to a reduction in pulse frequency. (B) A reporter of phosphatase expression (orange
A
C
B
102
102
101 103 101 102 103
103
102 103
wt AmyE W V QP
W VW VWB
IPTG
? ::AmyE Phyperspank
Induction Level (au) Induction Level (au)
M
ean
PsigB
-Y
FP (au)
M
ean
PsigB
-Y
FP (au)
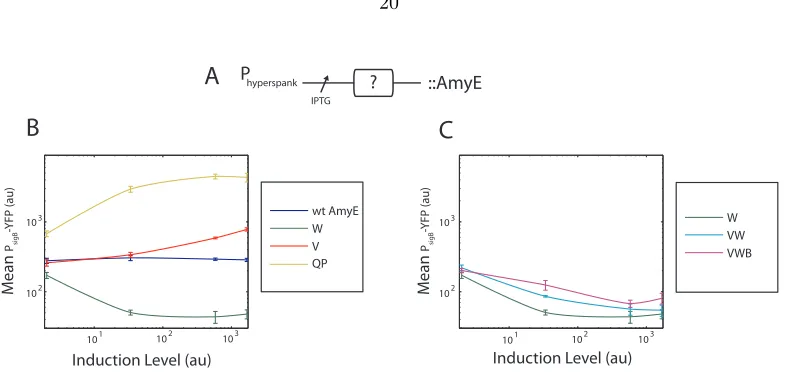
Figure 2.13: Ectopic expression of σB circuit components reveals sensitivity to phosphatase and
ki-nase levels. (A) Diagram of genetic construct (for more details, see strain list). Each gene or gene combination (indicated by “X”) was placed under the control of Phyperspank, a strong IPTG-inducible
promoter and integrated into theamyElocus. (B) Overexpression of RsbW, RsbV, RsbQP reveal that
σB activity is most sensitive to kinase and phosphatase levels. Static snapshots of σB activity were
taken 90 min after induction with various concentrations of IPTG. (C) RsbW exhibits a dominant negative effect over other operon components. Expression of fractional operon constructs containing RsbW alone, RsbVW, or RsbVWB were chromosomally integrated into theσB-YFP reporter strain.
[image:24.612.134.529.58.247.2]Despite the positive effects of RsbV andσB itself, inducing full operon RsbVWB repressed the system to almost the same level as expressing RsbW alone. In (B) and (C), induction level was measured by taking the mean expression of Phyperspank-yfp (JJB432) at the same IPTG inducing concentrations.
M
ean P
sigB
-CFP
Mean Phosphatase Level (au)
100 200 300
[image:25.612.170.487.406.572.2]0 0 1000 2000 3000 RsbQP-YFP QP-YFP fit RsbTU-YFP RsbTU-YFP fit
Figure 2.15: σB Activity is ultrasensitive to phosphatase expression. The yfp gene was fused to the
C-terminus end of the rsbQP or rsbTU operon in the absence of other RsbV phosphatases. Dots represent individual cells where QP-yfp (black) or TU-yfp (green) was expressed to different levels and
σB activity was measured using a P
sigB-CFP reporter via microscope snapshots. Hill fit (green and
blue solid lines) estimate the Hill coefficient as 2.12 (95% CI,nH=2.09-2.15) for QP-yfp and 2.62 (95%
CI,nH=2.54-2.69) for TU-yfp. Data for QP-yfp here is shown in 2.2D and is repeated for comparison
to TU-yfp.
A
B
0 50 100 150 200 250 0 0.2 0.4 0.6 Experiment SimulationnH = 3.0
nH = 2.0
nH = 1.1
M
ean P
sigB
-CFP (au)
O
utput A (au)
0 50 100 150 0 0.2 0.4 0.6
Mean TU-YFP (au) Phosphatase level
n = 3.1
n = 2.4
n = 1.1H H
H 0 µM IPTG
20 µM IPTG 50 µM IPTG
High Operon Mid Operon Low Operon
0 50 100 150 200 250 300 350 0
50 100 150 200 250 300
2% xylose 0% xylose
Mean QP-YFP (au)
M
ean P
sigB
-CFP (au)
IPTG QP
YFP
YFP
PsigB CFP
V V
W QP
B p
∆
QP
∆
RU
Xylose W
A
B
Figure 2.17: Balance between kinase and phosphatase sets threshold for σB activation. A) Strain
JJB819 allows inducible control of both the kinase RsbW and phosphatase QP-YFP. In this experi-ment, first additional RsbW was induced by adding 2% Xylose. 2h later QP-YFP was then induced to varying levels by adding IPTG. 2h later snapshots of the resulting sigB expression were taken. B) Upregulation of RsbW shifts the threshold for σB activation to higher levels of phosphatase. Cells
with upregulated RsbW (2% Xylose, green line), require more QP-YFP expression to activate σB
Add xylose
t = -1 hours Start movie
t = 0 hours
Add IPTG t = 2 hours
Phospha tase A ctivit y (thr eshold) Oper on Expr ession σ
B A
ctivit
y
t
A
Low Phosphatase ThresholdPhospha tase A ctivit y (thr eshold) Oper on Expr
ession Bσ
A
ctivit
y
t High Phosphatase Threshold
0 20 40 60 80 100 120
0 10 20 30 40 50
Phosphatase Level (AU)
[image:27.612.152.502.126.534.2]Pulse A
mplitude
(P
romot
er A
ctivit
y, A
U)
B
Figure 2.18: Pulse amplitude is proportional to phosphatase threshold. (A) Schematic of experimental protocol (modified from 2.3, see open loop experiment description in Supplemental Methods). In order to test whetherσB pulse amplitude increases with higher phosphatase threshold level, we preinduced
the phosphatase RsbTU in strain JJB578 by adding xylose to varying levels (0%, 0.2%, 0.4%, 0.6%, 1.0%, 2.0% Xylose). After phosphatase had reached steady state levels, we then fully induced the
σB operon (1 mM IPTG) and measured the resulting P
sigB-YFP activity via timelapse. (B) Pulse
amplitude is proportional to the phosphatase threshold. Phosphatase level is estimated from the fluorescence values of a Psweet-YFP reporter induced to the same level of xylose as the open loop strain.
σB promoter activity is calculated from the mean fluorescence across the colony. Pulse amplitude for
Normalized PsigB-CFP Total fr ac tion (P er cen t) Cumula tiv e fr ac tion
Normalized PsigB-CFP
0 1 2
0 4 8 12 16
0 1 2 3
0 0.2 0.4 0.6 0.8 1
Wildtype QP (n=894) ∆QP amyE::PQP-QPyfp (n=885)
A
B
Figure 2.19: Expression of QP-yfp complements a QP deletion. (A) Expression of the phosphatase fusion protein QP-yfp from its endogenous promoter in the amyE locus (JJB739) produces similar mean-normalizedσB activity distributions compared to wild-type QP (JJB781) upon treatment with 40µg/mL MPA (blue and green respectively). MPA led to a foldσB activation in JJB739 similiar to wildtype QP (5.0 versus 7.1). (B) Cumulative distribution plots of the data shown in (A). A KS test showed that the differences between the distributions are not significant (p = 0.94).
A
B
C
% T otal cells % T otal cells
100 101 102
0 400 800 1200
0 40 80 120
0 5 10 15
0 400 800 1200
0 5 10 15
Mean
QP-YFP (au) Mean PsigB-CFP (au)
M
ean P
sigB
-CFP (au)
Mean QP-YFP (au)
Fold Change
Mean PsigB-CFP (au)
Mean QP-YFP (au)
MPA 0 µg/mL MPA 40 µg/mL
0 2 4 6
CV 0.27 Mean 40.3
[image:28.612.170.487.89.297.2]CV 0.42 Mean 294.0
Figure 2.20: Pulse initiation is due to variability in phosphatase levels. (A) Under energy stress, the fold change in meanσB activity is greater than the change in phosphatase QP levels. Strain JJB739
was grown in SMM and exposed to 0 or 40µg/ml MPA for 180 minutes. The fold change measurement used non-stressed cells (green) as a reference, and was calculated for the stressed condition (blue) using two experiments. Standard error is shown on bar plots. (B) Histograms showing greater variation (measured by CV) of PsigB-CFP (bottom) compared to RsbQP-YFP levels (top). (C) Scatter plot
of RsbQP-YFP vs PsigB-CFP from the same data as found in (B). Solid red line represents the Hill
function fit representing relationship between the overexpression of QP-YFP and PsigB-CFP as found
0.4 0.6 0.8 1.0 1.2 1.5
Pulse Amplitude (au)
Pulse F
requenc
y (hr
-1)
1
2
3
4
5
0
0.02
0.04
0.06
0.08
[image:29.612.190.470.109.325.2]Phosphatase Level(au)
Figure 2.21: Closed-loop model recapitulates broad pulse amplitude distributions with monotonic decreasing frequency. Pulse statistics were collected from 250 repeats of a 20000 minute numerical simulation , at each phosphatase level. Simulated curves agree with experimental results (compare to figure 2.1H).
A
B
PsigB
-Y
FP
Pr
omot
er A
ctivit
y
Time (Minutes)
.
0 100 200 300
0 50 100 150 200 250 300 350
Figure 2.22: σB-YFP pulses can be induced by expression of constitutive phosphatase. (A) Film strip
of time-lapse movie of PsigB-YFP activity for phosphatase induction strain (JJB643), induced with
7.5 mM IPTG. B) Individual lineage traces (colored lines) showing promoter activity of the PsigB
[image:29.612.123.543.471.623.2]Mean PsigB-YFP (AU)
50 100 150 200 0.4
0.8 1.2 1.6
Coefficien
t of V
ar
ia
tion
Closed Loop strain Open Loop strain
0 100 200 300 0
50 100 150 200 250 300 350
Pr
omot
er A
ctivit
y
Pr
omot
er A
ctivit
y
Time (minutes) Time (minutes) 0 100 200 300
0 50 100 150 200 250 300
Figure 2.23: Effects of feedback on pulsing in the rewired input strain. (A) Variability inσB activity
is much reduced in the open loop strain, compared to the closed loop strain. Movies of the open loop strain (strain JJB578) were acquired using the following protocol. First the σB operon was
induced with 10 mM IPTG, and then 90 min. later the phosphatase RsbTU was induced with varying concentrations of xylose (0, 0.2, 0.4, 0.6, 1.0, 2.0%),. The meanσB level across the entire movie was
extracted, and the coefficient of variation (CV) calculated (green stars). Similarly, we computed mean
σB levels and CV from the closed loop strain movies (black stars, see also 2.4). The open loop strain
A
B
A K
A P
A K
P
AP Closed loop model
P
500 1000 1500 2000 2500
0 1 2 3
500 1000 1500 2000 2500
0 1 2 3
500 1000 1500 2000 2500
2 3 4 5 6
Phospha
tase (P)
Ac
tiv
e A (
A
)
Kinase (K
)
[image:31.612.163.502.223.479.2]Time (min)
Figure 2.24: Closed-loop model shows pulsing behavior with noisy phophatase levels. A minimal closed-loop model of theσB system (see supplementary methods), where the inducible phosphatase
levels fluctuate through time, gives rise toσB pulses and frequency, amplitude, and duration responses
Plasmid construction. All plasmids were cloned using E.coli strain Dh5α and a combination of standard molecular cloning techniques and non-ligase dependent cloning using Clontech In-Fusion Advantage PCR Cloning kits. Plasmid constructs were integrated intoB. subtilischromosomal regions via double crossover using standard techniques. The following list provides a description of each plasmid constructed, with details on integration position/cassette and selection marker given at the beginning. Note that all plasmids below replicate inE. colibut not inB. subtilis.
Plasmid list
1. ppsb::PtrpE-mCherry ErmR - This plasmid was used to provide uniform expression of mCherry
from a σA-dependent promoter, enabling automatic image segmentation (cell identification) in
time-lapse movie analysis. A minimal σA promoter was used from the trpE gene and cloned
into a vector with ppsb homology regions. The original integration vector was a gift from A. Eldar (Eldar et al., 2009). For some strains, the selection marker was subsequently changed, in B. subtilis, to either KanR or PhleoR.
2. sacA::PsigB-yfp CmR- The promoter immediately upstream of RsbV, containing a well-characterized
σB promoter, was cloned into the EcoRI/BamHI sites of AEC127 (Eldar et al., 2009), yielding
a Venus (YFP) reporter forσB activity.
3. amyE::Phyperspank-X SpectR - Where X = rsbW, rsbV, rsbQP, rsbVW, rsbVWB, yfp. The
coding region of each single gene or combination, along with a 5’ transcriptional terminator, was cloned behind the Phyperspank IPTG-inducible promoter in plasmid pDR-111 (gift of D. Rudner,
Harvard).
4. amyE::Pspac-Y SpectR- Where Y = rsbQP-yfp, rsbTU-yfp, yfp. The Pspacpromoter is also
con-trolled by IPTG, but promoter leakiness (basal expression) is less than Phyperspank (D. Rudner,
Harvard). This reduced leakiness allowed modulation of low levels of phosphatase.
5. amyE::Psweet-TU SpectR. The rsbTU coding region was cloned into pdr160 (gift of D. Rudner,
6. amyE::Psweet-yfp SpectR. Originally pdr160 (a kind gift of D. Rudner). The yfp gene was cloned
into this plasmid in order to compare expression levels between the different inducible promoters.
7. amyE:: 3xCFP SpectR. We constructed an integration plasmid based on pDL30 in which 3 separate copies of cfp, each with its own RBS were constructed with a multiple cloning site preceding the first cfp.
8. amyE::PsigB-3xCFP SpectR. This alternative σB reporter, containing three tandem copies of
the CFP fluorescent protein gene, was used in combination with yfp reporters of different genes.
9. sacA::cfp CmR- An integration vector where cfp replaced the yfp gene from AEC127.
10. sacA:: PsigB -cfp CmR - The same upstream promoter of RsbV (as in plasmid (2) above) was
cloned into plasmid (9), providing a CFP reporter forσB activity integrated in thesacAlocus.
11. amyE::PQP-QP-yfp SpectR - A derivative of the original plasmid (3), where Phyperspank was
removed and replaced with the QP gene along with the upstream coding region of this operon.
12. sacA::X-yfp CmR - Where X = P
yf la, Pyf hN, Pcmp, Pctc, Pgsib, PcsbB, PgspA. The promoters
immediately upstream of various target genes of σB, were cloned into the EcoRI/BamHI sites
of AEC127 (Eldar et al., 2009), yielding Venus (YFP) reporters for each of these downstream targets ofσB.
13. thrC:: Psweet-RsbW ErmR- We constructed an integration plasmid where the xylose
repres-sor and the promoter responsive to xylR (Psweet) from pdr160 (see above) was subcloned into
pDG1664 (or ECE117 from the BGSC). The gene RsbW was then subcloned into this plasmid.
B. subtilisstrains. Strains used were in the PB2 genetic background, except where noted. Antibiotic
JJB730, the construction procedure is listed as “JJB461 (selection on Tet)→JJB635 (selection on Erm)→JJB176,” meaning, “the genomic DNA of JJB635 was prepared and transformed into JJB176
1 PB2 trp2C (this genotype omitted in derived strains, below)
2 JJB174 PB2; ppsb::PtrpE-mCh neoR Plasmid (1) above PY79 PB2.
Antibiotic cassette switched from ErmR to
NeoR
3 JJB176 PB2; ppsb::PtrpE-mChPhleoR Plasmid (1) above PY79 PB2.
Antibiotic cassette switched from ErmR to
PhleoR
Negative control for snapshots
4 JJB213 JJB176; sacA::PsigB-yfpCmR Plasmid (2) above JJB176
5 JJB240 JJB174; delRsbU Plasmid (2) above JJB174 PB494 [3] 1D-H, S(1-4), S6
6 JJB256 JJB213; sigB:: SpectR BGSC1A790 JJB213
7 JJB332 JJB240; amyE::Phyperspank-rsbV SpectR Plasmid (3, RsbV) above JJB240 S9 8 JJB334 JJB240; amyE::Phyperspank-rsbW SpectR Plasmid (3, RsbW) above JJB240 S9 9 JJB367 JJB240; amyE::PsigB-3Xcfp SpectR Plasmid(8) JJB240
10 JJB413 JJB240; amyE::Phyperspank-rsbQP SpectR Plasmid (3, RsbQP) above JJB240 S9 11 JJB415 JJB240; amyE::Phyperspank-rsbVW SpectR Plasmid (3, RsbVW) above JJB240 S9 12 JJB423 JJB240; amyE::Phyperspank-rsbVWB SpectR Plasmid (3, RsbVWB) above JJB240 S9 13 JJB432 JJB176; amyE::Phyperspank-yfp SpectR Plasmid (3, yfp) above JJB176 S9 (induction
level)
14 JJB434 JJB176; amyE::Pspac-yfpspectR Plasmid (4, yfp) above JJB176 15 JJB461 JJB240; rsbQP::TetR ΔrsbQP TetR recombination at the rsbQP
locus JJB240
S2
16 JJB467 JJB461; rsbU::TetR; P
spac-rsbVWBX ErmR JJB469 JJB461 (with ErmR selection) 17 JJB469 JJB176; rsbU::TetR; P
spac-rsbVWBX ErmR ΔrsbU TetR recombination at the RsbU
locus PB212 [4] JJB176
18 JJB503 JJB176; amyE:: Psweet-yfp SpectR Plasmid(6) above JJB176
19 JJB578 JJB467; amyE:: Psweet-TU SpectR Plasmid(6) above JJB467 3B-C, S14, S19 20 JJB556 JJB367; sacA::PyflA-yfp CmR Plasmid(12,Pyfla-yfp) JJB556 S5
21 JJB559 JJB367; sacA::PyfhN-yfp CmR Plasmid(12,PyfhN- yfp) JJB556 S5 22 JJB564 JJB367; sacA::PctC-yfp CmR Plasmid(12,Pctc- yfp) JJB556 S5 23 JJB563 JJB367; sacA::PgsiB-yfp CmR Plasmid(12,PgsiB- yfp) JJB556 S5 24 JJB565 JJB367; sacA::PgspA-yfp CmR Plasmid(12,PgspA- yfp) JJB556 S5 25 JJB572 JJB367; sacA::PsigB-yfp CmR Plasmid(12,PsigB- yfp) JJB556 S5 26 JJB629 JJB213; rsbQP::TetR JJB461 JJB213 (with TetR selection) S2 27 JJB635 JJB176; RsbR-U::ErmR ΔrsbRU ErmR recombination at the rsbRU
locus
28 JJB637 JJB635; rsbQP::TetR JJB461 JJB635 (with TetR selection)
29 JJB643 JJB637; amyE::Pspac-rsbTU SpectR Plasmid (4, RsbTU) above JJB637 4D-F, S18, S19 30 JJB675 PY79; amyE:: Pspank-ftsW SpectR;
ftsW::TetR ; ppsb::Ptrpe-mCh NeoR
JJB174 sub-strain of Fili-SOG from Suel [5]
31 JJB676 JJB675; sacA::PsigB-yfp CmR Plasmid (2) above JJB675
32 JJB712 JJB676; rsbR-U::ErmR JJB635(selection on Erm) JJB676 2A-C, S7, S8 33 JJB730 JJB176; rsbR-U::ErmR; rsbQP::TetR JJB461 (selection on Tet) JJB635
(selection on Erm) JJB176
34 JJB733 JJB730; sacA::PsigB-cfp CmR Plasmid(10) above JJB730
35 JJB736 JJB733; amyE:: Pspac-rsbTU-yfp SpectR Plasmid(4,TU-yfp) JJB733 S11 36 JJB737 JJB733; amyE::Pspac-rsbQP-yfp SpectR Plasmid(4,QP-yfp) JJB733 2D, S11 37 JJB739 JJB733;amyE::PrsbQP-rsbQP-yfp SpectR Plasmid(11) JJB733 S15, S16 38 JJB746 JJB710; rsbQP::TetR;; sacA::P
sigB-cfp CmR JJB461 (selection on Tet) Plasmid(10)
above JJB176
39 JJB749 JJB746; Psweet-rsbTU-yfp SpectR; RsbU::
TetR; Pspac-rsbVWBX ErmR
Plasmid(4,TU-yfp) JJB469 (selection on Erm) JJB746
S12
40 JJB780 JJB174; Pspac-rsbQP-yfp;sacA:: PsigB-cfp
CmR; delRsbU; Plasmid(4,QP-yfp)
sacA:: PsigB-cfp CmR
JJB176PB494 [3]
41 JJB781 JJB176; sacA::PsigB-cfp CmR; rsbR-U::ErmR JJB635(selection on Erm)
Plasmid(10)JJB176
S15
42 JJB819 JJB780; Psweet-rsbW ErmR; rsbQP::TetR; JJB461 (selection on Tet)
plasmid(13)JJB780
S13
bulb to allow verification of cell focus and cell shape. Temperature control was achieved using an enclosed microscope chamber (Nikon) attached to a temperature sensitive heat exchanger set to 37◦C. All experiments used a Phase 100x Plan Apo (NA 1.4) objective, except for experiments involving filamentous cells, which used a 60x Plan Apo (NA 1.4) objective. Chroma filter sets used were as follows: #41027 (mCh), #41028 (YFP), and #31044v2 (CFP).
Sample Preparation. Between days, relative lamp intensity levels were monitored by taking an image of fluorescent beads and measuring their mean intensity. Exposure times were then adjusted to keep per exposure light levels constant between experiments. For snapshots, cells were spotted on 1.5% low melt agarose in PBS and imaged. Images were then analyzed via custom MATLAB software, where mean cell intensities were background corrected using strain JJB176, which has mCherry expression for segmentation, but lacks YFP or CFP expression. For most time-lapse movies (unless otherwise specified), larger 1.5% low melt agarose pads were prepared by pipetting 1 mL of media/agarose solution and allowed to solidify between two 22 x 22mm coverglass (no. 1). A 6 mm biopsy punch cut the larger pad into smaller uniform sized pads, to which 2.25 µL of culture diluted to OD 0.01 was pipetted. This protocol tended to give consistent and well-separated densities on the pad, ideal for time-lapse conditions. Prepared pads were then enclosed in coverglass bottom dishes (Willco #HBSt-5040) and sealed with parafilm or grease to prevent evaporation.
Growth Conditions
Media. SMM is derived from Spizizen’s minimal media (Spizizen, 1958), which uses 0.5% glucose as the carbon source and tryptophan (50 µg/mL) as an amino-acid supplement. Mycophenolic acid (MPA) was dissolved in DMSO and diluted 1000 fold into working concentrations in liquid and pad conditions. IPTG and xylose were dissolved in H2O and diluted 1000 fold and 12.5 fold respectively into working concentrations. Concentrations of 0.1% DMSO were not found to affect cell growth or
σB activity.
back into SMM to an OD of 0.01. After regrowing to OD 0.1 at 37◦C , the culture volume was split and varying concentrations of MPA (MP Biomedicals cat #194172), dissolved in 1000 fold DMSO concentrate, were added to separate cultures. After 2 hours of MPA exposure, cells were imaged as described above.
Time-lapse microscopy: Protocol was similar to liquid snapshot protocol above, except when cells regrew to OD 0.1, cells were then spotted on SMM 1.5% low melt agarose pads containing various concentrations of MPA. MPA pads were prepared by taking 1 mL of the SMM/agarose mixture and adding it to 1 µL of various MPA stock concentrations. After allowing cells to equilibrate after 2-3 hours, time-lapse acquisition was started.
Closed-loop sensitivity measurements (figure 2.2C and 2.15)
Cells were prepared similarly to previous experiments. Upon regrowth to OD 0.1 in SMM, culture volume was split and varying levels of IPTG (0, 10, 20, 30, 40, 50, 1000µM) were added to separate cultures. After 90 minutes of growth, cells were spotted on PBS 1.5% agarose pads and imaged. MATLAB software was used to generate the composite scatter plot (figure 2.2C), and fit it to a standard Hill function equation.
Open-loop experiment (figure 2.3)
Upon regrowth to OD 0.1 in SMM, cells were spotted on SMM pads. Xylose was pipetted on the tops (non-cell side) of the 6mm pads to give a saturating concentration of xylose (2%). Time-lapse acquisition was started ˜1 hour after exposure to xylose. After microcolonies reached the size of ˜8 cells (˜2h), the lid to the Willco dish was removed and varying levels of IPTG (0, 6, 15, 30, 60, 1000
µM) were pipetted on to separate pads. Time-lapse acquisition was then continued.
Closed-loop experiment (figure 2.4)
stocks in SMM minimal media + 1 mM IPTG in order to maintain FtsW expression. Cells were then diluted back into SMM + 1 mM IPTG to an OD of 0.01. After regrowth to OD 0.1, cells were washed with several exchanges of SMM without IPTG, and the resulting cultures was re-diluted to OD 0.025 with either 0 or 1000µM IPTG. Cells were allowed to grow to an OD of 0.25 before harvesting. RNA from 1 mL of culture was extracted using the Qiagen RNeasy Protect Bacteria Mini Kit(#74524), using 5 mg/mL lysozyme for cell lysis.
0.5 ug of RNA was reverse transcribed using the Biorad iScript One-Step RT-PCR Kit for Probes. Quantitative PCR was performed on a BioRad CFX96 Real Time System using 1/1000th of the cDNA reaction, single gene qPCR primer/probe mixtures from IDT (see table below), and BioRad SsoFast Probes Supermix, in a final volume of 20µL. Each gene for each biological replicate was analyzed in triplicate and averaged to obtain the C(t) value for each gene.
Gene expression was measured relative to mCherry, whose mean fluorescence per cell was measured to be consistent between long and short cells (see figure 2.11A). An additional housekeeping gene (rrnD) was also included for comparison and yielded qualitatively similar results. To compute the ratio of long cell to short cell gene expression, each long cell biological replicate (9 total across three days) was compared to the mean short cell expression for each day. These 9 points were averaged and error was calculated for each gene and plotted (see figure 2.11B).
Immunoblot Analysis (figure 2.14). Strain JJB737 was grown at 37◦C in LB to OD600 of 0.2. The culture was divided into two equal volumes, and exposed to either 0 or 1 mM IPTG. After 30 minutes of further growth, cells were pelleted by centrifugation at 3,000 x g for 10 minutes at 25◦C. Proteins were extracted by detergent lysis, using Thermo Scientific Y-PER Yeast Protein Extraction Reagent (Product No. 78991) according to the manufacturer’s instructions. To prevent degradation of proteins, protease inhibitors (Thermo Scientific Halt Protease Inhibitor Cocktail, EDTA-Free, Product No. 87785) were added to the samples. Total protein concentrations were determined by a BCA Protein Assay (Thermo Scientific Pierce BCA Protein Assay Kit, Product No. 23227).
Table 2.1: Quantitative PCR primer/probe sequences
Gene Forward Primer Reverse Primer Probe
mCherry CAG GTT TCT TGG CTT TGT ACG
AAA AGA CGA TGG GTT GGG AG
HEX - AT GTA TCC GGA AGA TGG TGC GCT G
rrnD GCC CTT TGT TCT
GTC CAT TG
ACC CTT GAT CTT AGT TGC CAG
HEX- CG TCA TCC CCA CCT TCC TCC G
rsbQ AAG AAC ATC CTG
GGC ATA GC
GTT CGG GAC ATT CAG ATT TGC
FAM- CG CGC ATA TG ACC TGA ATC GTT ACC A
rsbP TGC CGT GCT ATA
TCA ATC TCG
TCT CAG CCC CGT TAA AGT TAT G
FAM- TG TGA AGG TG CCG GTC CAA TTC
rsbV CCT TCA AGC CTG
TAA TGT CAA AC
TGC CTG AAA GAT GTC AGC TAC
FAM- AA ACG CCC A A TCC GGT ACT GTC C
rsbW CAT TAA ATA TAG
ACC GAG CCC TCC
TTA GAG GTT ATT GTG GCG GAT G
FAM- TG ATC AAC TG TGT GCG AAG GTG TGT
sigB TCT GAA AGG ACA
TGA AGC ACG
AAG CCT TAT CCG TTG ACC AC
FAM- AG GAC GGA TA TGA GCG GGT CAA C
sigA AGA TCA AGG AAC
AGC ATA CCG
GAA ATC GCC TAC GCT CAA AAG
FAM- AG TAT CGC AA AAC GGT ATG TCG GAC G
V constant for 1 hour. After performing electrophoresis, proteins were transferred to nitrocellulose membranes (0.2 µm) by dry blotting using an iBlot Gel Transfer Device (Invitrogen, Product No. IB1001). The blotted membranes were soaked in freshly prepared blocking reagent, which comprised of TBST (20 mM Tris base, 137 mM sodium chloride, 0.1% (v/v) Tween 20, pH 7.6), 5% nonfat dry milk, and 2% BSA, for 1 hour at room temperature with constant agitation. The blots were then incubated in a 1:10000 dilution of anti-RsbQ in fresh blocking solution for 2 h with agitation. The RsbQ polyclonal antibody was a gift of CW Price (Brody et al., 2001). After washing in TBST 3 times for 10 min each time, the blots were incubated with a 1:2000 dilution of the secondary antibody (ECL Rabbit IgG, HRP-Linked Whole Ab from donkey, Product No. NA934-100UL) in fresh blocking solution for 1 hour. The blots were then washed in TBST 3 times for 5 min each time, followed by a 30 minutes final wash. SuperSignal West Pico Chemiluminescent Substrate (Thermo Scientific, Product No. 34077) was used for horseradish peroxidase detection according to the manufacturer’s instructions. Protein bands were visualized on a VersaDoc gel imaging system (Bio-Rad Laboratories).
Isoelectric focusing was carried out in a glass tube of inner diameter 2.3 mm using 2% pH 3.5-10 mix4L Servalytes, (Serva, Heidelberg, Germany) for 9600 volt-hrs. Oneµg of an IEF internal standard, tropomyosin, was added to the sample. This protein migrates as a doublet with lower polypeptide spot of MW 33,000 and pI 5.2. The enclosed tube gel pH gradient plot for this set of Servalytes was determined with a surface pH electrode.
After equilibration for 10 min in Buffer ‘O’ (10% glycerol, 50 mM dithiothreitol, 2.3% SDS and 0.0625 M tris, pH 6.8), each tube gel was sealed to the top of a stacking gel that overlaid a 10% acrylamide slab gel (0.75 mm thick). SDS slab gel electrophoresis was carried out for about 4 hrs at 15 mA/gel. After slab gel electrophoresis, the gel was placed in transfer buffer (10mM Caps, pH 11.0, 10% methanol) and transblotted onto a PVDF membrane overnight at 200 mA and approximately 100 volts/ two gels.
The PVDF membranes were destained with 100% methanol, rinsed with TBST and blocked as described above. The membranes were incubated overnight at 4◦C in a 1:50 dilution of anti-RsbV in fresh blocking solution with constant agitation. The RsbV monoclonal antibody was a gift of WG Haldenwang (described in Dufour and Haldenwang (1994)). The secondary antibody was used at a 1:2000 dilution (ECL Mouse IgG, HRP-Linked Whole Ab from sheep, Product No. NXA931). SuperSignal West Pico Chemiluminescent Substrate was used for detection as described above.
Statistical Sampling. To understand whether a relationship existed between pulsing in sister and parent-child cells, only cell-lineages that successfully divided into two continuous daughter cells were sampled and analyzed for pulses. In these lineages, it was not required that a pulse was present. ‘Twin’ pulses occurred if at least one pulse occurred in both daughter cells of each cell lineage, where a ‘parent-child’ pulse occurred if a pulse occurred in at least one of the daughter cells of a parent who also pulsed.
For parent-child pulses, expected value distributions were created by randomizing both whether a parent pulsed, and whether at least one child pulsed, using measured pulse frequencies in each of these populations. As in the sister-cell analysis, 50000 trials were performed.
Quantitative Analysis. Quantitative movie analysis used custom image analysis code in MATLAB, similar to that previously described (Rosenfeld et al., 2005). Briefly, we segmented fluorescence images of the PtrpE-mCherry constitutive reporter using edge detection to identify individual cells. Segmented
cells were tracked semi-automatically from frame to frame on the basis of position and orientation. Fluorescence was defined as the sum of pixel intensities within the area of the cell. Calculation of promoter activity, and analysis of pulse statistics, were carried out using custom MATLAB code, described below.
Promoter Activity Definition. Promoter activity is defined as the rate of protein production. We extract this quantity from time-lapse data by considering the production, degradation, photobleaching, and dilution rates of the fluorescent protein. Fluorescent protein production occurs at a rate P(t). We combine all the degradation, dilution, and photobleaching processes into a first-order effective degradation rate constant, denotedγ. Thus, production rate of a Fluorescent protein,F, is given by:
dF(t)
dt =P(t)−γF(t)
To solve forP(t)requires differentiating the total fluorescenceF(t), but this process is sensitive to cell segmentation errors. To circumvent this problem, we rewrite the cell’s total fluorescence F(t)in terms of is its mean fluorescence,M(t)multiplied by its area, A(t):
F(t) =A(t)M(t)
F(t) =L(t)M(t)
Where we suppress the constant width value Wo. Replacing F(t)in promoter activity definition
with this term, and using the differentiation chain rule we obtain:
˜
P = P(t)
L(t) = (µ(t) +γ)M(t) + dM(t)
dt
Where we defineµ(t) = dL
dt as the cell’s instantaneous growth rate. ˜P = P
L can be interpreted as
the production rate per chromosomal equivalent, allowing comparison of production rate throughout all points in the cell cycle. To avoid unphysical negative values of promoter activity due to bleachin