Faculty of Health, Engineering & Sciences
Energy Efficiency Improvement in Coal Fired Power Plant
through Operational Optimisation
A dissertation submitted by
Jason Lang
in fulfilment of the requirements of
ENG4112 Research Project
towards the degree of
Bachelor of Electrical Electronic Engineering
Abstract
Energy consumption is a significant cost to all business with the countries large industrial
plants consuming 75 % of all energy produced in Australia. This cost is not only a
finan-cial burden but it has an environmental cost. The energy consumption within coal-fired
power stations that is directly associated with generation is called auxiliary power.
Ap-proximately 10 % of all power produced is used to drive power stations internal auxiliary
power needs. It is the auxiliary power consumption at Tarong Power Station that is the
focus of this dissertation.
This dissertation first seeks to understand the stations energy consumption through a
comprehensive review of auxiliary power issues worldwide and the creation of control
system tracking logic. The next stage of the dissertation then models that consumption
in MATLAB and finally proposes ways in which to reduce that consumption without
capital investment.
The auxiliary power consumption within Tarong Power Station is recorded by two energy
meters per unit on the main high voltage unit transformer feeds. The energy consumed is
then reported each week as a percentage of unit generation. It is at this high level that the
consumption is currently understood. This project has created energy tracking logic in the
unit control system, a Siemens T3000 installation, to provide additional usage knowledge.
A number of MATLAB models have been produced. The first of these reproduces the
energy usage map of a running unit. The final Simulink model allows modification of the
major component loading to trial energy reduction options. Using this model a reduction
of 10 % at low loads has been achieved. The accuracy of the energy tracking logic and
models created is proven to be within 2 % of the field energy metering.
This dissertation has concluded that meaningful energy efficiency improvement can be
Faculty of Health, Engineering & Sciences
ENG4111/2 Research Project
Limitations of Use
The Council of the University of Southern Queensland, its Faculty of Health, Engineering
& Sciences, and the staff of the University of Southern Queensland, do not accept any
responsibility for the truth, accuracy or completeness of material contained within or
associated with this dissertation.
Persons using all or any part of this material do so at their own risk, and not at the risk of
the Council of the University of Southern Queensland, its Faculty of Health, Engineering
& Sciences or the staff of the University of Southern Queensland.
This dissertation reports an educational exercise and has no purpose or validity beyond
this exercise. The sole purpose of the course pair entitled “Research Project” is to
con-tribute to the overall education within the student’s chosen degree program. This
doc-ument, the associated hardware, software, drawings, and other material set out in the
associated appendices should not be used for any other purpose: if they are so used, it is
entirely at the risk of the user.
Dean
Certification of Dissertation
I certify that the ideas, designs and experimental work, results, analyses and conclusions
set out in this dissertation are entirely my own effort, except where otherwise indicated
and acknowledged.
I further certify that the work is original and has not been previously submitted for
assessment in any other course or institution, except where specifically stated.
Jason Lang
I would like to make the following acknowledgements;
Stanwell Corporation and in particular David Janes, Jan Potgieter, Les Airs, and Malcolm
Westaway.
USQ and in particular Catherine Hills.
My wife and daughter; Steph and Caitlin Lang.
Without their support and assistance this project would not have became a reality.
Abstract i
Acknowledgments iv
List of Figures xi
List of Tables xv
Acronyms & Abbreviations xviii
Chapter 1 Introduction 1
1.1 Project Outline . . . 2
1.1.1 Aims . . . 3
1.1.2 Objectives . . . 3
1.1.3 Scope . . . 4
1.2 Overview of the Dissertation . . . 5
1.3 Conclusion . . . 5
CONTENTS vii
2.1 History . . . 6
2.2 Production Costs . . . 7
2.3 Electricity Generation Process . . . 10
2.4 Unit Energy Requirements - Auxiliary Consumption . . . 14
2.5 Energy Monitoring . . . 16
2.6 Control System . . . 19
2.7 Conclusion . . . 20
Chapter 3 Literature Review 21 3.1 Auxiliary Power Usage and Reduction . . . 21
3.2 Power Calculations . . . 32
3.2.1 Average or Real Power . . . 33
3.2.2 Power Factor . . . 34
3.2.3 Apparent Power . . . 35
3.2.4 Reactive Power . . . 35
3.2.5 Power Triangle . . . 36
3.2.6 Wattmeters/Watthour Meters . . . 37
3.3 Practical Industrial Power Measurement . . . 37
3.4 Standards . . . 40
3.5 Control Optimisation . . . 40
3.6 Power Station Modelling . . . 41
Chapter 4 Methodology 46
4.1 Selection . . . 46
4.2 Initial Data Gathering . . . 49
4.2.1 Drawings . . . 50
4.2.2 Operation and Maintenance Manuals . . . 52
4.2.3 Energy Metering Data . . . 52
4.2.4 T3000 . . . 53
4.2.5 Plant Performance Reports . . . 54
4.3 T3000 Energy Tracking Logic Creation . . . 55
4.4 MATLAB Models Creation . . . 59
4.4.1 Conceptional MATLAB Script Creation . . . 61
4.4.2 SIMULINK Auxiliary Power Model Creation . . . 63
4.4.3 SIMULINK Auxiliary Position Model Creation . . . 70
4.4.4 SIMULINK Auxiliary Process Model Creation . . . 71
4.4.5 Model Comparison Data . . . 74
4.5 Conclusion . . . 74
Chapter 5 Results and Data Analysis 77 5.1 Performance Reports Data . . . 77
5.2 T3000 Daily Auxiliary Total Data . . . 79
5.3 MATLAB Model Output Data . . . 83
CONTENTS ix
5.3.2 SIMULINK Auxiliary Position Model . . . 86
5.3.3 SIMULINK Auxiliary Process Model . . . 89
5.4 Overall Auxiliary Energy Usage . . . 92
5.5 Other Data . . . 94
5.6 Data Shortcomings . . . 97
5.7 Conclusion . . . 98
Chapter 6 Proposed Options of Energy Reduction 99 6.1 Induced Draft Fans . . . 100
6.2 Forced Draft Fans . . . 104
6.3 Primary Air Fans . . . 106
6.4 Circulating Water Pumps . . . 108
6.5 Condensate Extraction Pumps . . . 111
6.6 Boiler Feed Pumps . . . 112
6.7 Reduction Options Summary . . . 115
6.8 Entire Unit - Optimum Solution . . . 117
6.8.1 Low Risk . . . 117
6.8.2 Medium Risk . . . 119
6.8.3 High Risk . . . 120
6.8.4 Reduction Summary . . . 121
Chapter 7 Conclusion and Further Work 125
7.1 Project Conclusions . . . 125
7.2 Future Work . . . 128
7.3 Conclusion . . . 130
Bibliography 131
Appendix A Project Specification 134
Appendix B Conceptual MATLAB Auxiliary Calculation Script 136
Appendix C Unit Auxiliary Power Consumption Simulink Model - Power
Model 143
Appendix D Unit Auxiliary Power Consumption Simulink Model -
Posi-tion Model 151
Appendix E Unit Auxiliary Power Consumption Simulink Model - Process
Model 159
Appendix F Process Information Management System (PIMS) Extracted
Data 167
Appendix G Located Drawing Data 169
Appendix H Energy Metering Manual Data 170
Appendix I Stanwell Corporation Energy Reductions Recommendations
List of Figures
2.1 Monthly Report is a Snapshot of the Data Produced to Track Unit
Perfor-mance (Sands & Blake 2015). . . 9
2.2 Unit 4 T3000 Overview - Screen Capture from Tarong Power Station DCS (Siemens 2015). . . 12
2.3 Unit 1 Distribution Overview (Hitachi 2003). . . 17
2.4 Station Ancillary Distribution Overview (Hitachi 2003). . . 18
3.1 Typical Auxiliary Loads in Coal Fired Power Plant (EPRI 2011). . . 23
3.2 Typical Auxiliary Loads and their Breakdown of Usage in Coal Fired Power Plant (EPRI 2011). . . 25
3.3 210MW Coal Fired Power Plant Cycle (Mandi, Rajasheker, Udaykumar & Yaragatti 2012). . . 26
3.4 Auxiliary Power Consumption Against Load Factor in Coal Fired Power Plant (Mandi et al. 2012). . . 27
3.5 The Power Triangle relates Apparent, Reactive and Average Power with Power Factor (Boylestad 2003). . . 36
4.1 Initial Test Real Power Calculation Logic - Screen Capture from Tarong
Power Station DCS (Siemens 2015). . . 57
4.2 Unit 4 A Unit Transformer Energy Tracking Logic - Screen Capture from
Tarong Power Station DCS (Siemens 2015). . . 58
4.3 Unit 4 A and C Energy Tracking Logic - Screen Capture from Tarong
Power Station DCS (Siemens 2015). . . 60
4.4 Initial SIMULINK model of Induced Draft Fan - Basic Concept Version. . 64
4.5 Initial SIMULINK model of Induced Draft Fan - Lookup Table Concept
Version. . . 65
4.6 Auxiliary SIMULINK Model - Power Version of Full Unit - A Bus Common
Calculations. . . 66
4.7 Auxiliary SIMULINK Model - Power Version of Full Unit - A Bus Load
Calculations. . . 68
4.8 Auxiliary SIMULINK Model - Position Version of Full Unit - A Bus Load
Calculations. . . 72
4.9 Auxiliary SIMULINK Model - Process Version of Full Unit - A Bus Load
Calculations . . . 75
5.1 A Comparison of the Typical Auxiliary Load Distribution in Coal Fired
Power Plant to the Average Tarong Auxiliary Load (EPRI 2011). . . 81
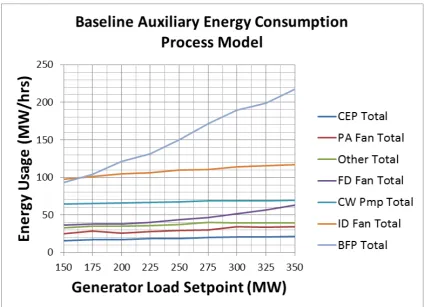
5.2 Tarong Power Station Baseline Auxiliary Energy Consumption - Power
Model Plant Totals. . . 84
5.3 Tarong Power Station Baseline Auxiliary Energy Consumption - Position
Model Plant Totals. . . 87
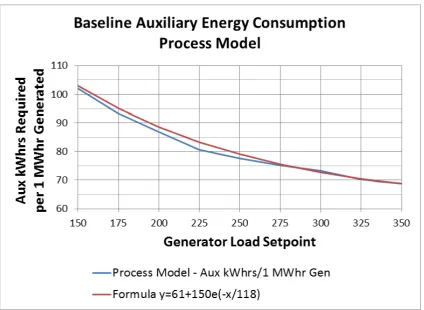
5.4 Tarong Power Station Baseline Auxiliary Energy Consumption - Process
LIST OF FIGURES xiii
5.5 Tarong Power Station Baseline Auxiliary Energy Consumption - Process
Model versus Formula. . . 93
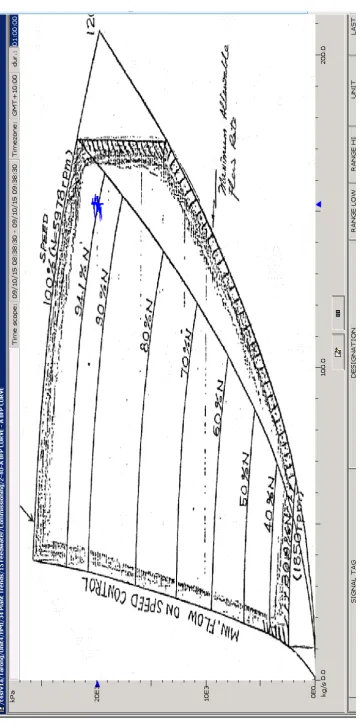
5.6 A Boiler Feed Pump Curve with the Pump Loading Shown in Realtime
-Unit 4A BFP 350MW (Siemens 2015). . . 95
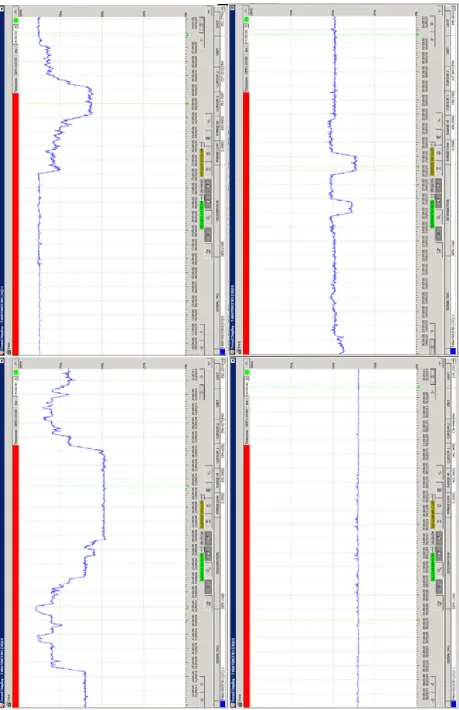
5.7 Load Profiles of Unit 4 Tarong Power Station. Top Left, 365MW-190MW.
Top Right, 365MW-220MW. Bottom Left, 140MW. Bottom Right,
140-200MW (Siemens 2015). . . 96
6.1 Air and Gas System Components - Tarong Power Station (Siemens 2015). 101
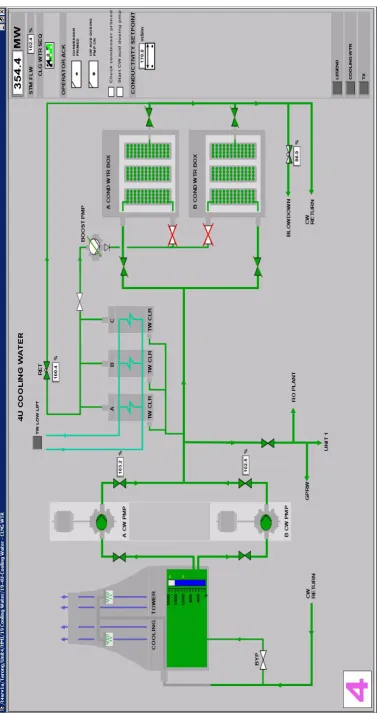
6.2 Circulating Water System Components - Tarong Power Station (Siemens
2015). . . 109
6.3 Boiler Feed Pump System Components - Tarong Power Station (Siemens
2015). . . 113
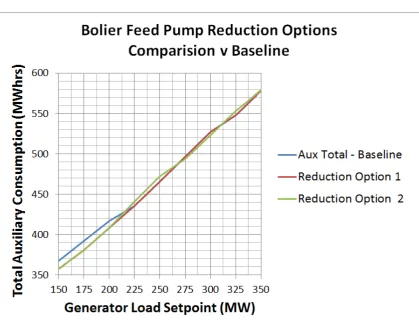
6.4 Boiler Feed Pump Plant Area - Process Model versus Reduction Options . 116
6.5 Full Unit Auxiliary Energy Consumption Comparison No 1 - Baseline
ver-sus Risk Reduction Options. . . 122
6.6 Full Unit Auxiliary Energy Consumption Comparison No 2 - Baseline
ver-sus Risk Reduction Options. . . 123
C.1 Unit Auxiliary Power Consumption Simulink Model - Power Model Part 1 144
C.2 Unit Auxiliary Power Consumption Simulink Model - Power Model Part 2 145
C.3 Unit Auxiliary Power Consumption Simulink Model - Power Model Part 3 146
C.4 Unit Auxiliary Power Consumption Simulink Model - Power Model Part 4 147
C.5 Unit Auxiliary Power Consumption Simulink Model - Power Model Part 5 148
C.6 Unit Auxiliary Power Consumption Simulink Model - Power Model Part 6 149
D.1 Unit Auxiliary Power Consumption Simulink Model - Position Model Part 1152
D.2 Unit Auxiliary Power Consumption Simulink Model - Position Model Part 2153
D.3 Unit Auxiliary Power Consumption Simulink Model - Position Model Part 3154
D.4 Unit Auxiliary Power Consumption Simulink Model - Position Model Part 4155
D.5 Unit Auxiliary Power Consumption Simulink Model - Position Model Part 5156
D.6 Unit Auxiliary Power Consumption Simulink Model - Position Model Part 6157
D.7 Unit Auxiliary Power Consumption Simulink Model - Position Model Part 7158
E.1 Unit Auxiliary Power Consumption Simulink Model - Process Model Part 1 160
E.2 Unit Auxiliary Power Consumption Simulink Model - Process Model Part 2 161
E.3 Unit Auxiliary Power Consumption Simulink Model - Process Model Part 3 162
E.4 Unit Auxiliary Power Consumption Simulink Model - Process Model Part 4 163
E.5 Unit Auxiliary Power Consumption Simulink Model - Process Model Part 5 164
E.6 Unit Auxiliary Power Consumption Simulink Model - Process Model Part 6 165
E.7 Unit Auxiliary Power Consumption Simulink Model - Process Model Part 7 166
F.1 Example of PIMS Data Extracted for the 7th of July 2015 (Siemens 2015) 168
H.1 List of Energy Meters Installed at Tarong Power Station (Godsmark 2001) 171
H.2 Drawing of Typical Energy Meter Installation at Tarong Power Station
(Godsmark 2001) . . . 172
H.3 Example of Typical Energy Meter PLC Registers and Functions (Godsmark
2001) . . . 173
LIST OF FIGURES xv
2.1 Cost Contribution of Major Factors to the Cost of Producing 1 MW (Breda
2014). . . 7
2.2 Major Drives as summarised from Hitachi Operations and Maintenance
Manuals (Hitachi 2003). . . 16
3.1 Auxiliary Energy Usage Figures in Percentage by Unit for the Last 10
Months (Sands & Blake 2015). . . 24
3.2 A Sample of Auxiliary Energy Consumption figures from Around the World.
(EPRI 2011) (Mandi et al. 2012) (Boveri 2015) (Sands & Blake 2015) . . 24
4.1 Auxiliary Load - Detail of all Loads that Contribute to the Auxiliary Power
Consumption of the Unit (Alstrom 1981). Note N/A (Not Available) Power
Factors were Unable to be Located. . . 51
4.2 Auxiliary Energy Usage Figures Comparison between Plant Energy Meter,
Tracking Logic and the MATLAB Script Output. Totals are in MW/hr
and the Percentage Error in Presented in Brackets. . . 61
4.3 MATLAB Script Output - Auxiliary Energy Usage Figures at the 13 Load
Points. . . 62
4.4 Auxiliary Energy Usage Figures Comparison between the MATLAB Script
Output and the Power Based Model Output at 190 MW. Totals are in
LIST OF TABLES xvii
4.5 Assessment of Auxiliary Load Drive Elements, Plant Configuration and
there Capacity for Load Share. . . 70
4.6 Auxiliary Loads and their Identified Process Measurement. . . 73
4.7 Auxiliary Energy Usage Figures Comparison between the Three SIMULINK
Models at 190MW. Totals are in MWhrs. . . 74
5.1 Auxiliary Energy Usage Figures - Unit 4 for the Last 10 Months (Sands &
Blake 2015) . . . 78
5.2 Auxiliary Energy Usage Figures in MWhrs - Pulverisers - Output from
T3000 Energy Tracking Logic Daily Totals. . . 80
5.3 Unit 4 Auxiliary Energy Usage Figures in MWhrs All Plant Areas
-Output from T3000 Energy Tracking Logic Daily Totals. . . 82
5.4 Auxiliary Energy Usage Figures in MWhrs - Plant Area Totals from SIMULINK
Power Model. . . 83
5.5 Auxiliary Energy Usage Figures per Drive in MWhrs - Output from SIMULINK
Power Model. . . 85
5.6 Auxiliary Energy Usage Figures in MWhrs - Plant Area Totals from SIMULINK
Position Model. . . 86
5.7 Auxiliary Energy Usage Figures per Drive in MWhrs - Output from SIMULINK
Position Model. . . 88
5.8 Auxiliary Energy Usage Figures in MWhrs - Plant Area Totals from SIMULINK
Process Model. . . 89
5.9 Auxiliary Energy Usage Figures per Drive in MWhrs - Output from SIMULINK
Process Model. . . 91
6.1 MATLAB Process Model Output - Induced Draft Fan System Energy
Us-age Figures at 9 Load Points to be used as a Baseline. Generator Load Set
6.2 MATLAB Process Model Output - Induced Draft Fan System Energy
Us-age Figures at 9 Load Points after Reduction Option 1 Implemented.
Gen-erator Load Set Point in MW and Energy Totals in MWhrs. . . 102
6.3 MATLAB Process Model Output - Induced Draft Fan System Energy
Us-age Figures at 9 Load Points after Reduction Option 2 Implemented.
Gen-erator Load Set Point in MW and Energy Totals in MWhrs. . . 103
6.4 MATLAB Process Model Output - Induced Draft Fan System Energy
Us-age Figures at 9 Load Points after Reduction Option 3 Implemented.
Gen-erator Load Set Point in MW and Energy Totals in MWhrs. . . 103
6.5 MATLAB Process Model Output - Forced Draft Fan System Energy Usage
Figures at 9 Load Points to be used as a Baseline. Generator Load Set Point
in MW and Energy Totals in MWhrs. . . 104
6.6 MATLAB Process Model Output - Forced Draft Fan System Energy Usage
Figures at 9 Load Points after Reduction Option 1. Generator Load Set
Point in MW and Energy Totals in MWhrs. . . 105
6.7 MATLAB Process Model Output - Forced Draft Fan System Energy Usage
Figures at 9 Load Points after Reduction Option 2. Generator Load Set
Point in MW and Energy Totals in MWhrs. . . 106
6.8 MATLAB Process Model Output - Primary Air Fan System Energy Usage
Figures at 9 Load Points to be used as a Baseline. Generator Load Set
Point in MW and Energy Totals in MWhrs. . . 106
6.9 MATLAB Process Model Output - Primary Air Fan System Energy Usage
Figures at 9 Load Points after Implementation of Option 1. Generator
Load Set Point in MW and Energy Totals in MWhrs. . . 107
6.10 MATLAB Process Model Output - Primary Air Fan System Energy Usage
Figures at 9 Load Points after Implementation of Option 2. Generator
LIST OF TABLES xix
6.11 MATLAB Process Model Output - Circulating Water System Energy Usage
Figures at 9 Load Points to be used as a Baseline. Generator Load Set Point
in MW and Energy Totals in MWhrs. . . 110
6.12 MATLAB Process Model Output - Circulating Water System Energy Usage
Figures at 9 Load Points after Option 1 Implemented. Generator Load Set
Point in MW and Energy Totals in MWhrs . . . 110
6.13 MATLAB Process Model Output - Circulating Water System Energy Usage
Figures at 9 Load Points after Option 2 Implemented. Generator Load Set
Point in MW and Energy Totals in MW/hr . . . 111
6.14 MATLAB Process Model Output - Condensate Extraction System Energy
Usage Figures at 9 Load Points to be used as a Baseline. Generator Load
Set Point in MW and Energy Totals in MWhrs. . . 112
6.15 MATLAB Process Model Output - Boiler Feed Pump System Energy Usage
Figures at 9 Load Points to be used as a Baseline. Generator Load Set Point
in MW and Energy Totals in MWhrs. . . 112
6.16 MATLAB Process Model Output - Boiler Feed Pump System Energy Usage
Figures at 9 Load Points after Option 1 Implemented. Generator Load Set
Point in MW and Energy Totals in MWhrs. . . 114
6.17 MATLAB Process Model Output - Boiler Feed Pump System Energy Usage
Figures at 9 Load Points after Option 2 Implemented. Generator Load Set
Point in MW and Energy Totals in MWhrs. . . 115
6.18 Impact of Reduction Options in Each Plant Area at Different Generator
Load Set Points in MW - Resulting Impact Presented as a Percentage. . . 117
6.19 Impact of Reduction Options on the Overall Auxiliary Energy
Consump-tion at Different Generator Load Set Points in MW - Resulting Impact
Presented as a Percentage. . . 118
6.20 MATLAB Process Model Output - Full Unit Auxiliary Energy Usage
Base-line Figures at 9 Load Points. Generator Load Set Point in MW and Energy
6.21 MATLAB Process Model Output - Full Unit Energy Usage Figures at 9
Load Points after Low Risk Options are Implemented. Generator Load Set
Point in MW and Energy Totals in MWhrs. . . 119
6.22 MATLAB Process Model Output - Full Unit Energy Usage Figures at 9
Load Points after Low and Medium Risk Options are Implemented.
Gen-erator Load Set Point in MW and Energy Totals in MWhrs. . . 120
6.23 MATLAB Process Model Output - Full Unit Energy Usage Figures at 9
Load Points after Low, Medium and High Risk Options are Implemented.
Generator Load Set Point in MW and Energy Totals in MWhrs. . . 121
G.1 A Sample of Drawings Located during the Data Gathering Stage (Hitachi
Acronyms & Abbreviations
AEMO Australian Electricity Market Operator
AP Automation Processor
ASD Adjustable Speed Drives
AVR Automatic Voltage Regulation
BFP Boiler Feed Pump
CEP Condensate Extraction Pump
CPU Central Processing Unit
CT Current Transformer
CW Circulating Water
DA Deaerator
DC Direct Current
DCS Distributed Control System
DF Displacement Power Factor
DOL Direct on Line
EPRI Electric Power Research Institute
ESP Electrostatic Precipitator
FD Forced Draft
FIFO First In First Out
GOC Government Owned Corporation
GT Gas Turbine
HMI Human Machine Interface
HP High Pressure
HP6 HP heater 6
hr Hour
HV High Voltage
I&C Instrumentation and Control
ID Induced Draft
IEEE Institute of Electrical and Electronics Engineers
I/O Inputs/Outputs
MV Medium Voltage
IP Intermediate Pressure
JSEA Job Safety and Environmental Analysis
kW Kilowatt
LP Low Pressure
MV Medium Voltage
MW Megawatt
MWhr Megawatt hour
NGERS National Greenhouse Energy Reporting Scheme
NOX Nitrite Oxide
PID Proportional Integral Derivative
P&ID Process and Instrumentation Drawing
PA Primary Air
PF Pulverised Fuel
PF Power Factor
PIMS Process Information Management Solutions
PLC Programmable Logic Controllers
QEC Queensland Electricity Commission
SCADA Supervisory Control and Data Acquisition
SISO Single Input Single Output
Stanwell Stanwell Corporation
Tarong Tarong Power Station
THD Total Harmonic Distortion
Chapter 1
Introduction
This chapter aims to introduce the project, its drivers, its key aims, objectives and how
they are proposed to be achieved.
In an ever more energy hungry austere world the way in which energy is produced and
consumed is under constant scrutiny. Every Megawatt (MW) produced in a coal fired
power station consumes valuable finite resources, coal and oil. The production of
electric-ity emits pollution into the atmosphere leaving an indelible footprint on the landscape
and atmosphere. This carbon footprint, as it is known, that the Tarong Power Station
(TPS) leaves is larger than most energy consumers in Australia. TPS is ranked in the
top ten Australian polluters and as such is always under pressure to improve its
envi-ronmental performance. TPS is run by Stanwell Corporation (Stanwell), a Government
Owned Corporation (GOC). As such it is owned by the people of Queensland and while
environmental performance is important so is financial stainability. Couple these two
factors with global downturns, market oversupply and low price in the electricity market
you have a business that is always actively looking to reduce costs. Time and energy
is spent to improve fuel burn returns, reduce water usage, implement reduced manning
practices, improve market share and reduce the cost of maintenance work. One of the
last major cost influences, auxiliary power consumption, has only been lightly touched on
during the recent stakeholder driven cost reduction exercises. It is this cost of internal
1.1
Project Outline
This section outlines some further detail on the issue of auxiliary power consumption
to give context to the project direction. It will also detail the projects aims, scope and
objectives.
Auxiliary energy consumption is a large contributor to the cost of power production.
Within Tarong Power Station it is not fully understood, that is, it is understood to a basic
level. It is known that of the energy produced at TPS approximately 10 % is required to
run in house auxiliaries and therefore cannot be exported for sale. This auxiliary energy
usage is a significant cost to the business and adds to the cost of producing one MW of
electricity. This auxiliary power usage is metered on each unit and is reported on each
month. If a unit has an increased energy usage at the end of the month not only is it
accepted and unchallenged but there is no easy way to understand the underlying cause.
Therefore there is no way to prevent a future high energy usage occurrence of the same
nature. Since the usage is metered at a high level, unit level, there is also no reasonable
way to assess the usage and implement changes to the plant to reduce the usage. It can
also be noted that the energy usage whilst visible is generally lost in the other concerns
of the station.
The major contributors to the auxiliary energy consumption are already broadly known
and loosely understood. It is the plants large high voltage (HV) motors which consume
a huge amount of electricity to produce the motive forces required by the electricity
generation process. Reducing this consumption via major plant upgrade would require
enormous capital investment and plant redesign. Further to this it is widely accepted that
the current level of unit energy consumption, as part of the designed efficiency figure, is
the minimum achievable usage. It is essentially viewed as unavoidable byproduct of the
process requirements. The plant was designed in the mid 1970’s with a strong reliability
focus. To ensure high plant availability the plant design included many redundant and
oversized drives. The station was also designed to be a base load 350 MW unit. The
energy consumption across the full load range of the plant was not the primary focus of
the design phase of the station. Peak efficiency at 350 MW was the primary aim of the
1.1 Project Outline 3
1.1.1 Aims
The questions that this project seeks to address are two stage, firstly can the auxiliary
energy consumption of unit at Tarong Power Station be fully understood? Secondly can
this energy usage be reduced solely through control optimisation? That is to reduce the
auxiliary energy consumption without capital investment and solely by control system
logic modification. This leads to the creation of the aims of this project. The first
primary project aim is to better understand the auxiliary energy consumption at Tarong
Power Station. Once understood the second primary aim of reducing the usage through
control optimisation can be addressed.
In building the tools to understand the stations auxiliary usage the project will create
valuable data in T3000. The created logic will be able to monitor and report on usage
for the project and into the future. This had led to a secondary aim of leaving in place
lasting a energy information source.
These aims are summarised here for reference.
Primary Aim 1 To understand the auxiliary consumption within Tarong Power Sta-tions 350 MW coal fired units;
Primary Aim 2 Identify potential control based energy reduction strategies;
Secondary Aim 1 To leave in place energy consumption information that the station
can utilise into the future.
Notes The primary aims are those that drive the project objectives. The secondary aims are those that will be achieved through the primary aims.
1.1.2 Objectives
The project objectives drive how the project aims will be achieved. This leads to the
project and the associated dissertation having four primary objectives. The first is to
understand the associated project topics more deeply and uncover any existing work that
can be used to assist the completion of this project. This will be achieved through a wide
ranging literature review. The next two objectives will be to model the auxiliary energy
the T3000 Distributed Control System (DCS). Using this model and T3000 data the final
primary objective is to propose control changes to reduce the internal electrical energy
consumed to produce electricity. Proposed changes will be implemented in the MATLAB
model to confirm the energy impact. The secondary objectives of this project are to
utilise the T3000 simulator and the TPS generating plant to implement the proposed
control changes. The achievement of these secondary objectives will depend heavily on
the outcomes of the first stages and the risk assessment of any proposed changes. These
secondary aims are an extension to the primary stated objectives and will be proven
theoretically if implementation is not possible.
Primary Objective 1 Complete a literature review of issues pertinent to the project;
Primary Objective 2 Create a SIMULINK model, in MATLAB, of the energy profile of a single unit;
Primary Objective 3 Create energy tracking logic in the T3000 Digital Control
Sys-tem;
Primary Objective 4 Identify potential control based energy reduction strategies and
propose changes to the operational plant;
Secondary Objective 1 Trial energy reduction options on the T3000 Unit simulator;
Secondary Objective 2 Implement energy reduction strategy on an operational Unit.
Note Primary objectives are those that drive this project and the secondary objectives are extension tasks if time and plant risk assessment permit.
1.1.3 Scope
The scope of this project is limited to the Unit Auxiliary energy usage. Specifically
the energy usage on the 350 MW coal fired units location at Tarong Power Station,
Queensland, Australia. The Power Station Ancillary energy usage ie Coal Handling Plant,
Tarong North, Administration areas and Meandu mine energy usage is excluded from this
1.2 Overview of the Dissertation 5
1.2
Overview of the Dissertation
This dissertation is organised as follows:
Preface has a list of abbreviations that will be used throughout the dissertation;
Chapter 1 is an introduction to the problem of auxiliary energy usage in coal fired power
stations;
Chapter 2 is a background information on the various facets of this project;
Chapter 3 is a discussion of the existing knowledge on the dissertation topic and is presented through discussion of existing literature;
Chapter 4 discusses the methods utilised in the completion of this project;
Chapter 5 presents the results of the created T3000 logic and MATLAB models;
Chapter 6 analyses and evaluates the data collected from all sources;
Chapter 7 discusses the reduction options and presents the results of these options im-plemented using the MATLAB models;
Chapter 8 concludes the dissertation with a concise presentation of the project
achieve-ments and suggests further work that could be undertaken in the area of ‘energy
modeling and reduction in the power station environment’.
1.3
Conclusion
In this chapter the project overview was explored from many perspectives to allow a
solid understanding of the drivers for this project, its aims and the final outcomes it will
produce. The next chapter will provide the background information required on auxiliary
power usage within Tarong Power Station to allow the reader the basis on which to better
Background - Tarong Power
Station
This chapter is to provide background information that relates to the topic. The majority
of the information within this chapter is a summary of the Operations and Maintenance
manuals for the Tarong Power Station plant (Hitachi 2003). Further detail is based on the
experience of the project author Jason Lang who has 20 years experience in the electricity
generation industry (Lang 2015).
2.1
History
This section outlines the brief history of Tarong Power Station from construction through
to current day.
Tarong Power Station construction started in 1979 after it was commissioned to be built
as part of 10 coal fired units in Queensland by then Queensland Premier Sir Joh
Bjelke-Peterson. Tarong had four 350 MW units fully commissioned by November 1986 with Unit
1 in full operation during 1981. These units were designed to be base load for Queensland
for 25 years. The units design efficiency was 28 % at 350 MW and were installed with
the best technology available at the time (Brady 1996) (Thiess 2015).
Move forward to the modern day, Tarong is past its design life and there have been
2.2 Production Costs 7
been built, the industry is partly deregulated and gas is now a significant factor in the
marketplace. Tarong has established itself in the middle of the Australian Electricity
Market Operator (AEMO) trading dispatch order of merit. The Queensland electricity
market has been depressed with state load reducing, an oversupply and solar all impacting
price and load profiles. To extend the station life and to remain a competitive force Tarong
Power Station has undergone a major capital works program. These include a full control
systems refit, field device upgrade, burner front upgrade to low Nitrite Oxide (NOX),
major turbine refurbishment program and generator rewinds (Australia 2015).
The half-life refit work has significantly improved the underlying long term life on the plant
but has only slightly improved the efficiency factor. TPS is also no longer a base load
station with the plant being regularly requested to load ramp. This mode of operation is
outside of the original plant design specification and therefore not the most efficient plant
operation. To return to base load the overall cost to produce one MW of energy needs to
be reduced to allow the plant to be bid in lower in the market dispatch order.
2.2
Production Costs
This section outlines the cost of producing one MW of electricity at TPS. The cost of
this electricity production process has many contributing factors. Tarong Power Station’s
major contributing factors are the cost of fuel, water, overhaul maintenance, auxiliary
energy consumption, ancillary energy consumption and fixed overheads. The estimate of
the breakdown of the cost contributions to each MW are shown in table 2.1.
Cost Contributor Contribution
Fuel 30 %
Water 30 %
Overhaul Maintenance 20 %
Auxiliary Energy Usage 15 %
Ancillary Energy Usage 4 %
Fixed Overheads 1 %
Table 2.1: Cost Contribution of Major Factors to the Cost of Producing 1 MW (Breda 2014).
reduced. However the amount of fuel and water consumed can be reduced through
effi-cient practices. Overhaul costs are strongly linked to long term asset strategy which are
locked down by multiple year strategy. Moves to reduce this overhaul cost are possible
but hold a high level of risk to plant performance and reliability. Auxiliary energy usage
costs are those directly associated with the energy required to generate power. This power
usage is wide spread from control system power requirements, through to High Voltage
Drives and generator excitation. This cost is considered to be fixed during the initial
design process but is monitored. Ancillary energy usage costs are those associated with
common processes like coal handling plant, air compression, demineralised water
produc-tion, chemical plants and water distribution. The fixed costs are those support items
that a company generating electricity requires. All manner of costs make up this factor
including head office, payroll, market and trading, procurement, operations, maintenance,
and engineering. These fixed costs are a small percentage of the overall cost of 1 MW but
are relatively easily influenced by plant management. They are therefore under constant
scrutiny and downward pressure (Economy 2013).
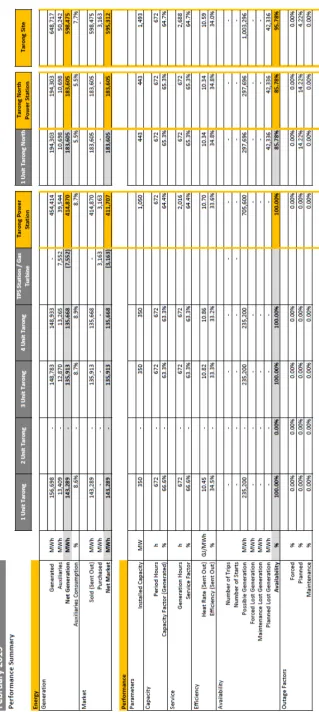
Key parameters are reported on each month to track the items that affect the amount
and cost of the saleable product, in this case electricity exported to the grid. These key
parameters align with the key cost contributors above. Figure 2.1 is a sample of the data
presented in monthly reports.
The data shows, per unit, the energy and performance results for the month. While they
are all impacted by the unit load profile they also indicate other unit qualities which are
explored briefly below. Megawatt hours (MWhr) produced or generated energy exported
is metered at the 275 kV level as the power is leaving the unit transformer to meet the
grid. Auxiliary energy usage is a measure of the electricity used to produce the MWhrs
exported in the month. It is metered at the unit 20 kV to 6.6 kV transformers that feed
the majority of energy consuming devices on the units. Capacity factor is an indication of
how the plant is loaded in relation to its full capacity. Efficiency and heat rate shows how
effectively the coal consumed is utilised. It is a combination of many factors including coal
quality, ash content, moisture content, mill grind quality, air leakage etc. Availability is
the measure, in percentage, of the amount of time the unit is available to meet the
demands of the market. Availability is impacted by breakdowns, plant trips and outages.
Solid long term maintenance practices and underlying plant design influence this figure.
Opera-2.2 Production Costs 9
Figure 2.1: Monthly Report is a Snapshot of the Data Produced to Track Unit Performance
tors (AEMO). The unit load, its available capacity and metered energy is communicated
in real time to AEMO. The station transformer’s usage is measured and read by Ergon
Energy and Stanwell is billed for its use. The station transformer energy is used to run the
ancillary services of the station like administration buildings, coal handling plant drives,
air compression and water treatment. The station boards also link to each unit to assist
in unit start-up until it can sustain its own load. Tarong also has a 15 MW Gas Turbine
(GT) connected to the station switchboards which is used for start-up power during black
start operations. This is a situation when the state grid is unable to supply the station
power. The GT can also be used to generate back to the grid. All metering is audited
and certified by a third party at routine intervals to ensure transparency.
2.3
Electricity Generation Process
This section outlines the power generation process or what is known as the cycle. The
Tarong Power Station is a closed cycle regeneration sub critical thermal unit utilising coal
as its primary fuel source. The cycle consists primarily of 11 major components. A broad
understanding of these components will assist to better understand the future discussion
this project will undertake.
Cooling Water Cycle: Used to convert the steam back to condensate once it has
passed through the low pressure turbine, heat absorbed is removed by the associated
cooling towers.
Condensate and Feedwater System: Collects the condensate and transports it through
the heater stages to the boiler drum;
Steam Cycle: This cycle converts the preheated feedwater to steam and superheats it to precise pressure and temperature require by the turbine. The steam cycle also
includes supplying heat to the low and high pressure heaters.
Turbine System: Produces the mechanical motive force required to drive the generator through conversion of steam energy;
Generator System: Produces power via a 6 pole generator with a stationary stator
and rotating DC field. The generator output is 20 kV which is stepped up for
2.3 Electricity Generation Process 11
Fuel System: This system supplies the fuel for the boiler flame via oil supply, coal
pulverisers and associated burner fronts.
Boiler: Produces the heat required for steam generation and consists of multiple stages
of tubing.
Air and Gas: Forced Draft, Induced Draft, Primary Air and Air Heaters all combine with dampers to supply the necessary air for the mills and boiler operation.
Control System: Servers, processors, control cabinets, field power supplies, field
de-vices, unit control desks and operator workstations that are required to monitor
and control the unit.
HV/LV Distribution; Switchboards, cabling and circuit breakers that control the
dis-tribution of electricity for the unit;
Chemical: Chemical instrumentation, wetracks, chemical dosing, and condensate pol-ishing plants required to monitor and maintain the unit cycle chemistry.
Figure 2.2 is a realtime capture of the TPS Unit 4 HMI overview page which shows the
major processes that combine to generate power in a thermal unit.
The cycle is considered closed as once the steam energy is utilised by the Low Pressure
(LP) turbine it is then recondensed and used in the cycle again. Fresh demineralised
water is only required to be added to the system to make up for losses. The paragraphs
below explain the cycle operation in more detail.
The Cooling Water, Condensate and Feedwater Cycle
Cooling water is used in the condenser to recondense the steam into water. The cooling
water picks up heat during this process; this heat is then removed by circulation through
the natural draft cooling towers. This circulation is achieved by Circulating Water (CW)
Pumps. The condensed steam is then considered condensate and is extracted from the
condenser hotwell by the Condensate Extraction Pumps (CEPs). The CEPs transport
the condensate through the gland seal condenser and three low pressure heaters. The
condensate picks up heat as it passes through each heater. This heat is supplied by
Figure 2.2: Unit 4 T3000 Overview - Screen Capture from Tarong Power Station DCS
2.3 Electricity Generation Process 13
passed through the LP heaters it arrives in heater 4 or a vessel better known as the
Deaerator (DA). It is a known as the Deaerator as part of its function is to remove any
CO2 from the condensate as it enters the vessel. The Boiler Feed Pumps (BFPs) draw
their feed water from the DA then transport it through two high pressure (HP) heaters
and economiser tubing into the boiler drum. Through this part of the cycle the water is
known as feedwater and picks up further heat. The heat for HP heater 5 (HP5) and 6
(HP6) is supplied by steam tapped off the higher temperature Intermediate Pressure (IP)
turbine stage and the cold reheat line respectively. The economiser tubing heat is supplied
by the waste heat extracted from the boiler air as it makes its way to the chimney stack.
From the boiler drum the feedwater is converted to saturated steam and enters the steam
cycle. The steam builds enthalpy as it works its way through the primary, secondary and
tertiary superheater stages to arrive at the HP turbine at 535◦C and 17 MPa. The steam drops pressure and temperature as its stored energy is imparted on the HP turbine. The
steam is then fed back into the boiler as cold reheat steam to boost the pressure and
temperature again in the reheat boiler stages. Once the temperature has reached 535◦C
and 3.8 MPa it returns as hot reheat steam to drive through the intermediate and low
pressure turbine into the condenser to complete the cycle.
The Boiler, Air and Gas Cycle
The boiler flame is supported by the fuel, air, and gas systems. The air and gas cycle
consists of two Forced Draft (FD) Fans, two Induced Draft (ID) Fans, two Primary Air
(PA) Fans, two Air Heaters, Electrostatic Precipitator (ESP) and the chimney stack. This
air and gas system supplies air to the boiler and pulverisers. The fuel system consists of
six coal pulverisers and the interconnecting pipework to take the Pulverised Fuel (PF)
to the six burner fronts. There is 3 to 5 of these 6 pulverisers in service at any point
in time depending on load requirements. The Tarong pulverisers are ball grinding mills
that grind the coal to fine dust to be transported by the 100◦C PA to the burner front. The PF enters the boiler and is lit off by either the existing flame or by gas ignition
supported oil flame. The rate of PF added supports the floating boiler flame to provide
the required heat to the boiler tubing transporting the steam. The boiler requires large
amounts of air to feed the flame and to carry away ash from the combustion process. This
air is supplied from two FD fans drawing in fresh air and two ID fans drawing air out
are located between the boiler and the stack. The ESP removes particulate matter via
attraction to plates with pulsed direct current (DC).
Minor Auxiliary Systems
There are many other smaller systems that contribute to the Tarong thermal cycle. Below
are some of the smaller systems;
Condensate Polisher: Chemically cleans the unit cycle water;
Flame Detector Cooling Fans: Supplies cooling air to burner front flame detectors;
Oil Systems: Supplies oil for bearings, hydraulic equipment and burner front ignition
needs;
Coal Feeders: Controls the feed rate of coal into pulverisers;
Stator Cooling Water: Supplies water for generator cooling.
2.4
Unit Energy Requirements - Auxiliary Consumption
This section outlines the major items of energy use within the unit cycle that are deemed
to be auxiliary. The major energy consuming devices are those associated with the major
functions of the unit. They are condensate and feedwater, fuel supply, air supply, cooling
water and generator excitation. Primarily these are large Direct on Line (DOL) 6.6 kV
motor driven devices.
The functions of the units boiler are to combine the fuel, air and heat required to sustain
combustion thus providing heat to the boiler tubing. This combustion process requires
large amounts of air which is supplied by two 2.95 MW 6.6 kV motor driven Forced Draft
Fans through an air heater into the boiler. The fuel is supplied to the boiler by coal
pulverisers or mills. Each mill is driven by a 200 kW 415 V motor to drive the grinding
table via a speed reduction gearbox. The coal is supplied into each mill via a coal feeder
driven by a smaller 4 kW variable speed motor. Once ground the coal is picked up and
transported to the boiler by the air supplied by two 0.9 MW 6.6 kV motors that drive
2.4 Unit Energy Requirements - Auxiliary Consumption 15
is cold PA. The hot and cold PA are then combined to ensure the optimal combustion
temperature is maintained. All of this air needs to be removed from the boiler at the
correct rate to ensure a vacuum is always maintained in the boiler enclosure. This is
achieved by two 4.55 MW motors that drive the Induced Draft Fans. These fans draw
air and non-combusted waste material out of the boiler through the air heater and over
the economiser tubing. The air then passes through the electrostatic precipitator, which
remove particulate matter before discharging the air out of the chimney. The boiler tubing
requires water which is converted to driving steam energy of a thermal sub critical power
plant. This boiler water is fed up to the boiler drum by pump units in two stages. During
the first stage water is extracted from the hotwell with one of two 1.1 MW 6.6 kV motor
driven condensate extraction pumps. The CEP then pushes the water through the LP
heaters into the DA. The second stage is two of the three 5.65 MW 6.6kV motor driven
boiler feed pumps deliver the feedwater at the correct rate through the economiser into
the boiler drum. The rate of feedwater is controlled by the variable speed nature of the
pump section of the BFPs. An actuated scoop element controls the oil flow inside the
fluid coupling to link the DOL motor to the pump element. Cooling water is circulated
through the condenser and out to the cooling tower for heat removal. This is achieved by
two 1.35 MW 6.6 kV motor driven circulating water pumps. The final large consumer of
energy is the generator excitation system. This system uses an excitation transformer to
reduce the 6.6 kV to 700 V AC which in turn is fed into the Automatic Voltage Regulation
(AVR) system to convert to high current DC. The current level of this DC is varied and
applied to the rotor of the generator (Hitachi 2003).
Table 2.2 is a listing of the major drives and their ratings as discussed in the section
above.
Many other smaller loads contribute to the total auxiliary power usage of a unit including
control system power supplies, flame detection cooling fans, lube oil pumps, stator cooling
water pumps, air heater drive motors, polisher booster pumps and deaerator booster
Drive Rating
Force Draft Fan 2.95 MW
Induced Draft Fan 4.55 MW
Primary Air Fan 0.9 MW
Boiler Feed Pump 5.65 MW
Circulating Water Pump 1.35 MW
Condensate Extraction Pump 1.1 MW
Automatic Voltage Regulator 1.1 MW
Table 2.2: Major Drives as summarised from Hitachi Operations and Maintenance Manuals
(Hitachi 2003).
2.5
Energy Monitoring
This section outlines the way in which energy has been and is currently monitored on the
Tarong Power Station site.
In the year 2000 the station was approaching the end of its design life. It was still part
of the Queensland Electricity Commission (QEC) and a move to a deregulated electricity
market was being proposed. As part of this change the state government was looking
at breaking up the generators to ensure they were competitive when they moved to the
market environment. This network evolution was an important step as the electricity
generators now would be treated as a business and would be required to return profit. Up
until then they had been solely government controlled and were treated as an essential
service. Being solely government owned their primary drivers were long-term availability
rather than profit. Once this breakup began Tarong Power Station ultimately became
part of Tarong Energy as a standalone business in the electricity market (Australia 2015).
Hence Tarong Energy wanted to better understand its business costs and part of this was
the need to understand its in-house electricity usage. Below is an outline of the level that
Tarong Energy and now Stanwell Corporation understand their internal energy usage. It
will start with an overview of the stations electrical distribution.
Figure 2.3 is a high level single line diagram showing the electrical distribution of a single
2.5 Energy Monitoring 17
Figure 2.3: Unit 1 Distribution Overview (Hitachi 2003).
It can be seen that the Unit 6.6 kV switchboards are fed from the step-down transformers
connected to the generator output. These are the A and B Unit Transformers and together
they supply all the major drives and auxiliarys for a single unit. The station ancillary
supplies are shown in figure 2.4. Some of the station supplies are coal handling, air
compression, administration, water treatment and ashing.
The four unit generator transformers feed into the grid and also supply their own in
house auxiliary energy requirements via 25 kV/6.6 kV step down transformers, the unit
transformers. The ancillary services common to all units are supplied by the station
transformers A and B which draw their power directly from the grid. The station
trans-former also can be linked to the unit 6.6kV switchboards to assist in unit start-up until
it can supply its own auxiliaries. Each of the four generator transformers and eight unit
transformers have an energy meter installed. It is these meters that are directly connected
to AEMO for market purposes. These meters have been updated routinely as part of the
stations network connection agreement. The then Tarong Energy implemented metering
on the major drives across one unit, Unit 4, and all primary feeds on the station
switch-boards. The approach would give them a good picture of site usage on which to base
future strategy. Some additional meters have been added to individual areas such as ash
and chemical plants loads. Administration building supplies had more metering installed
in recent years under the government reporting guidelines of the National Greenhouse
Figure 2.4: Station Ancillary Distribution Overview (Hitachi 2003).
to the station Supervisory Control and Data Acquisition (SCADA) system via local
Mo-mentum Programmable Logic Controllers (PLCs). The local PLC polls the individual
meters to retrieve the blocks of relevant data from the energy meter via RS-485. This
data includes current, voltage, power factor and running totalisers. All data retrieved is
then read out of the PLC’s by the plant data historian.
2.6
Control System
This section outlines an overview of the Tarong Power Station site control system and
some of its features that will assist this project.
The control system is central to all industrial plants. In this way Tarong is no different.
The control system allows a high level of automatic responses to the raw signal inputs from
the field. It is this automated system that enables the plant operators to oversee and run
the plant. The control system and associated data historians allows engineers to monitor,
improve and optimise the plant. Tarong is now 30 years old and is operating past its
design life. The original Hitachi control system has been upgraded to the Siemens T3000
2.6 Control System 19
run on T3000 with a project currently running to migrate the remaining plants across to
T3000.
T3000 is Siemens flagship product that allows both logic and Human Machine Interface
(HMI) creation to occur whilst the plant processes are running. Operators can continue
to monitor and control the plant while engineering staff work on the system (Ltd 2015).
It is a powerful all in one product with hundreds of individual blocks available from which
to create screens, logic and sequences. T3000 can be easily altered, optimised or expanded
up to the resource limitation of each individual Central Processing Unit (CPU).
The unit plant energy usage is the focus of this project so the T3000 structure for one
unit will now be briefly described; this description is true for all units. The unit T3000
architecture consists of a central server and two major buses. The first bus is the
automa-tion bus which looks after communicaautoma-tions between the Automaautoma-tion Processors (AP).
The second bus is the application bus which handles the communication from the plant
APs to the operator workstations and other services that requires plant data access. The
central server is a multiple slice high redundancy server that sits between the two buses
and runs the T3000 processes. There are eight APs on a unit application bus to handle
the large number of Inputs/Outputs (I/O) required to safely and affectively manage the
running the unit, around 7000 I/O in total. Each AP handles a specific area of plant to
reduce the level of inter AP communication required. For example AP 3 is Fuel and AP
1 is Turbine. There are separate high integrity I/O for Safety System control loops. An
additional virtual AP exists in the central server. In this virtual AP logic can be created
without consuming resources. At TPS the logic space that this virtual machine provides
is used to run plant performance calculation and other functions that are not directly
related to plant functionality.
Some of the I/O relate to the control and monitoring of drives. These drives are a variety
of valves, dampers, pumps and fans. The drive data that exists within T3000 is position,
status, current, voltage and power factor when available. The data from this I/O is ported
from T3000 through to the data historians. It is this drive data around auxiliary energy
2.7
Conclusion
In this chapter the background and operation of Tarong Power Station was explored.
Both a brief history and a plant overview builds a picture of the current plant status.
It demonstrates the need to understand the unit auxiliary energy consumption and the
control system tools available for use during the project. This overview of the energy
information assists in understanding the gaps that this projects outcomes aim to fill, and
the drivers behind them. The next chapter reviews the existing literature related to the
Chapter 3
Literature Review
This chapter reviews relevant literature that is key to understanding previous work that
has been completed in the field of the project. The review will focus on the outcomes of
previous work to uncover any gaps and learning that can be utilised during this project.
The standards and best practice required in the field measurements of energy calculation
inputs will also be reviewed to assess Tarong Power Stations energy practices. Power
calculations, control optimisation and power station modeling techniques round out the
chapter.
3.1
Auxiliary Power Usage and Reduction
This section reviews the knowledge base of auxiliary power usage and the ways in which
auxiliary power reduction has been approached around the world. While there are some
common themes in the approach to energy reduction, each country has developed a unique
focus. Their focus is directed by the current issues that are seen to be the top contributors
to the problem.
The first steps in any attempt to reduce power usage is to understand the energy
con-sumption within a plant. This understanding often takes the form of an energy audit. A
Chinese study of energy auditing and its coal-fired power plant application by the Jilin
Province Science and Technology Department states that the concept of energy audit is
This study continues to state the targets of energy audit are investigating problems and
weaknesses in using energy, tapping of energy-saving potential, finding rectification
mea-sures and formulating saving goals (Li, Wang, Jiang & Zhang 2009). This project, whilst
not framed as an audit, will address the shortfalls in Tarong Power stations current
lev-els of energy usage knowledge. This current lack of knowledge is a primary barrier to
achieving meaningful energy reduction at TPS.
United States of America Network Experience
The 2011 Technical Report published by Electric Power Research Institute (EPRI) (EPRI
2011) focuses on the opportunities to enhance electric energy efficiency in the production
and delivery of electricity. The pertinent sections of the report are the chapters that
focus on electricity used for power plant auxiliaries. The report is centered around power
stations in the American grid. The discussions in this paper by EPRI are significant as
the American power industry, whilst considerably larger, is at a similar evolutionary state
as Australia. The report states that 11 % of electricity produced is used in delivering
the electricity to the customer of that 40 % is consumed in power production. The figure
3.1 shows some of the typically uses of auxiliaries or so called “parasitic loads” in
ther-mal power plants. EPRI states that “These auxiliaries are designed based on maximum
performance and environmental compliance, not on minimum use of in-house electricity
use.” (EPRI 2011). It is this statement which demonstrates that past design focus leaves
room for energy improvement which will be explored by this project. The paper discusses
that many auxiliaries have an opportunity to improve on their energy consumption due
to factors such as oversized auxiliaries, use of modulating mechanical mechanisms, design
trade offs between efficiency and cost, and tuning based on a particular parameter. It
is also noted that as is the case with Tarong the auxiliary load is monitored but not
generally considered separately as there are greater efficiency opportunities possible in
the boiler and turbine plant. EPRI consider plant auxiliaries as part of heat rate and
they contribute approximately 90.8 kHJ/kWh to the overall average heat rate of 1000
kHJ/kWh. This linkage may help lift the profile at Tarong. EPRI continue to say that
this amounts to 5-10 % of total generation depending on unit size, fuel type and ambient
temperature. This is a figure that is reflected in Tarong’s monthly reports. These reports
show that between 7.3 and 10.3 percent of generated energy is consumed by in house
3.1 Auxiliary Power Usage and Reduction 23
Figure 3.1: Typical Auxiliary Loads in Coal Fired Power Plant (EPRI 2011).
Two facts that EPRI presented which are of particular relevance to the TPS situation.
The first was that the more base loaded and therefore higher capacity factor of the plant
the lower the internal usage. The second fact revealed by the figures is that age of the
plant is not as relevant as once thought. This is partly due to the additional of overall
auxiliary plant load by emission control equipment. The EPRI data is considered high
quality as it was collected over a 5 year period across 350 fossil fuel power stations.
World Comparison
The level of auxiliary energy consumption recorded in America by EPRI (EPRI 2011), of
5-10 %, is reinforced as an average level of consumption through the findings of Mandi
(Mandi et al. 2012) and India (Cornerstone 2014) in Indian power grid. Mandi reported
that within Indian sub-critical power stations, 30-500MW, an average auxiliary
consump-tion of 9.5 % existed. Mandi continued to state that this figure offers ample room for
improvement. This auxiliary energy usage level is also reflected in the recorded European
auxiliary energy consumption. ABB’s European productivity group states that between
7 and 15 % of coal-fired power generation is consumed in-house by auxiliary systems
(Boveri 2015). These figures reflect the levels recorded at Tarong Power Station in their
monthly reports (Sands & Blake 2015). Tarong’s Monthly reports over the last 12 months
Month Unit 1 Unit 2 Unit 3 Unit 4 Tarong Total
August 2015 7.7% offline 7.9% 8.0% 7.9%
July 2015 8.1% offline 7.9% 8.2% 8.1%
June 2015 8.8% offline 8.0% 8.3% 8.3%
May 2015 8.1% offline 7.3% 8.0% 7.8%
April 2015 8.1% offline 8.2% 8.2% 8.2%
March 2015 8.7% offline 8.7% 9.1% 8.8%
February 2015 8.6% offline 8.7% 8.9% 8.7%
January 2015 8.9% offline 8.9% 9.8% 9.2%
December 2014 9.0% offline 9.1% 9.3% 9.1%
November 2014 8.8% offline 10.3% 10.3% 9.7%
Table 3.1: Auxiliary Energy Usage Figures in Percentage by Unit for the Last 10 Months
(Sands & Blake 2015).
3.2 is a summary of the results uncovered from different countries. This identifies a key
point, which is that Tarong’s auxiliary energy consumption is consistent with recorded
levels of internal power usage in coal fired power stations around the world.
Location America India Europe TPS
Auxiliary Energy Usage Level 5-10 % 9.5 % 7-15 % 7.3 - 10.3 %
Table 3.2: A Sample of Auxiliary Energy Consumption figures from Around the World.
(EPRI 2011) (Mandi et al. 2012) (Boveri 2015) (Sands & Blake 2015)
Figure 3.2 shows the breakdown of the auxiliary power consumption for a typical coal fired
power plant (EPRI 2011). The EPRI figure shows that the BFP group is the primary
power consumer at approximately 37 % of the total load. The CW and ID fans make
up the next 30 %. This breakdown will be compared to the results found during this
project and will be used to drive the investigation portion of this project. The EPRI
report also presents some suggested methods for auxiliary power consumption reduction.
Its primary recommendation are the installation of adjustable speed drives (ASD) this
is also a recommendation made by ABB European Division (EPRI 2011) (Boveri 2015).
This is a major capital works investment but can, particularly at lower loads, deliver large
3.1 Auxiliary Power Usage and Reduction 25
Figure 3.2: Typical Auxiliary Loads and their Breakdown of Usage in Coal Fired Power Plant
(EPRI 2011).
this innovation to Tarong plant is outside of the scope of this project. Though it should
be noted that while drive replacement is not to be investigated by this project the idea
has merit and should be investigated by Tarong in the future. This project will instead
consider control optimisation of the high usage drives to reduce energy consumption.
Indian Network Experience
The concept of reducing the auxiliary power usage of coal fired power stations was explored
in Indian power stations by Rajasheker, Mandi, Udaykumar and Yaragatti. The focus
was how to reduce auxiliary power usage without major capital investment. Their study
was undertaken across twenty three 210 MW sub-bituminous coal fired power stations
giving a large base for data collection and comparisons (Mandi et al. 2012). The data
within the paper is closely representative of the Tarong units as the cycle, depicted in
figure 3.3, is very similar to the Tarong cycle previously outlined. This study is highly
relevant to the Tarong Power Station situation as Mandi discusses that the Indian power
stations are routinely requested by the network controller to run at sub-optimal partial
Figure 3.3: 210MW Coal Fired Power Plant Cycle (Mandi et al. 2012).
a base load station in the AEMO dispatch order of merit.
The major contributors to auxiliary power usage are the BFPs, IDs, FDs, PAs, Mills,
CW pumps and CEPs. Mandi’s work showed a strong link between plant load factor
and auxiliary power usage. Load factor is the actual running power level versus the
peak running power level expressed as a percentage. The work undertaken by Mandi
and associates show that when the plant is running at higher loads all major drives are
operating at a high load factors. This leads to the plant operating more efficiently and is
reflected in the overall reduction of auxiliary power usage (Mandi et al. 2012). The graph
in figure 3.4 is extracted from the study which shows the positive impact of load factor
on each major power contributor.
Mandi’s concludes that the auxiliary power consumption within the Indian power
gener-ation plant is on the high side compared to other developed countries and that low load
factor is a primary cause of running with higher auxiliary power usage than the benchmark
(Mandi et al. 2012). The Tarong monthly reports reflect this occurrence as when running
at higher unit loads, therefore higher load factor, TPS shows lower recorded auxiliary
power usage (Sands & Blake 2015). Mandi lists the following Indian specific factors that
affect load factor: Coal quality, lack of equipment optimisation, excess steam and water
flow, hesitation to upgrade equipment, as well as poor initial design with many oversized
3.1 Auxiliary Power Usage and Reduction 27
Figure 3.4: Auxiliary Power Consumption Against Load Factor in Coal Fired Power Plant
(Mandi et al. 2012).
the plants overall power factor. There are many reasons presented for the lower power
factor of the units across India. Mandi gives reasons like inadequate coal supply, poor
coal quality, ID fan erosion, inadequate PA supply and non-availability of mills are all
related to the low level of development in the Indian power generation industry (Mandi
et al. 2012). These factors are largely not present within Tarong Power Station. If these
do occur i.e. intermittent lower coal quality, which does occur in the form of high iron or
ash content coal, it is well prepared for and effectively managed. During these lower coal
quality periods the plant does show downgrading effects. Some other factors they discuss
are still a large concern within the Tarong plant, however it should be mentioned that they
are more quickly and effectively addressed due to the developed nature of the Queensland
electricity industry. Factors such as poor electrostatic precipitator performance (ESP),
poor condenser vacuum, air leakage in the air heater and duct system, inadequate
circu-lating water temperature and less demand in the power grid all negatively influence the
efficiency of the Tarong Power Station and Stations worldwide. Many of these factors are
also identified in the 2011 EPRI report on American power generation as negative
influ-ences on auxiliary energy usage levels (EPRI 2011). This suggests that the case Mandi
The Indian paper also presents some methods to improve plant load factor for each of the
major drive groups. Primarily Mandi focuses on health and capacity adequacy of major
auxiliaries, especially the Mills and ID fans (Mandi et al. 2012). This focus is interesting
and leaves out the major contributor to the auxiliary load and that is the BFP units.
The BFP influence and potential reduction will be explored more during this project.
The majority of energy conservation measures Mandi suggested to improve load factor
are already in place within Tarong to some extent or are not relevant due to local factors.
They are however relevant for discussion. In the paragraphs below each of the factors
discussed by Mandi are broken down by plant group. They are then reviewed for potential
relevance to this current project and Tarong in general.
Coal Pulveriser Improvement
Suggested mill group improvement factors, including improvements to coal quality, coal
grind sizing quality and raw coal sizing are all in place at Tarong. Coal quality is
contin-ually monitored but is limited by the available mine coal quality and contractual
obliga-tions. The station’s overall design is linked strongly to the station’s Meandu mine coal
characteristics. Trials of different coal quality have caused