Controllable synthesis of mesostructures from TiO
2
hollow to porous nanospheres with superior rate
performance for lithium ion batteries
†
Hao Ren,aJiajia Sun,aRanbo Yu,*aMei Yang,bLin Gu,cPorun Liu,dHuijun Zhao,d David Kisailuseand Dan Wangbd
Uniform TiO2nanospheres from hollow, core–shell and mesoporous structures have been synthesized using quasi-nano-sized carbonaceous spheres as templates. The TiO2 nanospheres formed after calcination at 400 C are composed of 7 nm nanoparticles and the shells of the hollow TiO2 nanospheres are as thin as a single layer of nanoparticles. The ultrafine nanoparticles endow the hollow and mesoporous TiO2 nanospheres with short lithium ion diffusion paths leading to high discharge specific capacities of 211.9 and 196.0 mA h g1at a current rate of 1 C (167.5 mA g1) after 100 cycles, and especially superior discharge specific capacities of 125.9 and 113.4 mA h g1at a high current rate of up to 20 C. The hollow and mesoporous TiO2nanospheres also show superior cycling stability with long-term discharge capacities of 103.0 and 110.2 mA h g1, respectively, even after 3000 cycles at a current rate of 20 C.
Introduction
Lithium-ion batteries (LIBs) are one of the most promising and widely used technologies because of their safety, stable cycle life and low cost.1 Due to the great demand for high capacity
LIBs, potential candidates have been intensively studied for decades.2–5 Recently, transition metal oxides such as Fe
2O3,
Co3O4, Mn2O3, CuO and NiO have been introduced as anodes
and show higher capacities.6–14 However, since these anode
materials are used at low discharge voltages (below 1 V vs. Li+/Li), they suffer from the formation of an unstable solid electrolyte interface (SEI)lm on the electrode surface, which affects their safety.15,16Recently, with the blossom of electric
vehicles, highly powered and safer anodes are necessary.17In
view of this, anode materials like Li4Ti5O12and TiO2with high
discharge voltages under which the electrolyte is stable are of great interest.18–20
TiO2 is widely applied in many elds including
environ-mental remediation, sensing and energy applications.21–24As an anode material for LIBs, it has a high discharge voltage (up to 1 V) which can prevent the formation of a SEIlm. In addition, the volume expansion during lithiation and delithiation processes is3%, which reduces strain and permits a stable morphology resulting in a long cycle life.25Moreover, TiO2is
abundant, environmentally friendly and chemically stable. However, the limited specic capacity and poor cycling perfor-mance of TiO2 resulting from the low ionic and electrical
conductivities have obstructed its practical use.26–28An effective
way to decrease the lithium ion diffusion path lengths is to use nanosized TiO2particles. Thus, the mean diffusion time of the
lithium ions in electrode materials could be strongly decreased in nanoparticles according to the following formula:Teq¼L2/D
(Teq: mean diffusion time, L: diffusion length, D: diffusion
coefficient).29,30 Unfortunately, in practical applications, the aggregation of nanoparticles during the charge/discharge processes will lead to another challenge.31 In order to solve
these problems, purposely designed hierarchical
meso-structures such as hierarchical microspheres, hollow
micro-spheres and core–shell hollow microspheres have been
proposed and synthesized. These micro-sized particles can provide good structural stability while nanoparticles can enhance the interfacial contact area and shorten the transition path of the lithium ions and electrons.32–35We have successfully a
Department of Physical Chemistry, School of Metallurgical and Ecological Engineering, University of Science & Technology Beijing, No. 30, Xueyuan Road, Haidian District, Beijing 100083, P. R. China. E-mail: ranboyu@ustb.edu.cn
bNational Key Laboratory of Biochemical Engineering, Institute of Process Engineering,
Chinese Academy of Sciences, No. 1, Bei Er Tiao, Zhongguancun, Beijing 100190, P. R. China
cLaboratory for Advanced Materials & Electron Microscopy, Beijing National
Laboratory for Condensed Matter Physics, Institute of Physics, Chinese Academy of Sciences, Beijing 100190, P. R. China
d
Centre for Clean Environment and Energy, Gold Coast Campus, Griffith University, Southport, Queensland 4222, Australia
eDepartment of Chemical and Environmental Engineering, University of California,
Riverside, CA 92521, USA
†Electronic supplementary information (ESI) available: Experimental section, thermogravimetric heating curves, SEM micrographs, additional TEM micrographs, Raman spectra, N2 adsorption–desorption results, EIS aer 3
cycles at a current of 1 C and a summary of the cycling performance at various charge/discharge current densities are included. See DOI: 10.1039/c5sc03203b
Cite this:Chem. Sci., 2016,7, 793
Received 27th August 2015 Accepted 23rd October 2015
DOI: 10.1039/c5sc03203b
www.rsc.org/chemicalscience
Science
EDGE ARTICLE
Open Access Article. Published on 26 October 2015. Downloaded on 16/06/2017 02:29:47.
This article is licensed under a
Creative Commons Attribution 3.0 Unported Licence.
designed and fabricated mesostructured multi-shelled Fe2O3
and TiO2 hollow spheres which can improve the specic
capacity, and have demonstrated that thin shelled micro-spheres show a better performance compared to thick shelled spheres.7,36 To our knowledge, no reports focus on very thin
shelled hollow spheres. Moreover, the nanoparticles of the multi-shelled TiO2 hollow microspheres are currently larger
than 20 nm.36We anticipate that smaller sized nanoparticles are
more favorable for shorter lithium ion diffusion times, thus leading to a better rate performance.
Herein we have successfully prepared TiO2 hollow
nano-spheres (TiO2-HNSs) with much thinner shells composed of
nanoparticles as small as about 7 nm using a quasi-nano-sized carbonaceous sphere template method. The shell of the TiO2
-HNSs was found to be as thin as a single layer of nanoparticles. By tuning the precursor absorbance and calcination processes, TiO2 mesoporous nanospheres (TiO2-PNSs) have also been
fabricated. These kinds of nanospheres show superior perfor-mance, especially at high charge/discharge current rates. This results from their hollow and porous structures, which can provide easy charge transfer routes during lithiation and deli-thiation processes.
Results and discussion
In order to decrease the nanoparticle size in the TiO2-HNSs and
TiO2-PNSs, the calcination temperature could be decreased.37,38
However, the micro-sized carbonaceous microspheres with
diameters of around 3 mm synthesized using sucrose as
a precursor could not be easily decomposed at such low temperatures aer adsorbing the Ti source (Fig. S1†). Thus, much smaller quasi-nano-sized carbonaceous spheres (CNSs) with an average diameter of approximately 260 nm were synthesizedviaa hydrothermal process with glucose instead of sucrose as the precursor,39,40which easily decompose at 400C (Fig. S1 and S2†). Based on previous work,36,40 a 3 M TiCl4
aqueous solution was used as the precursor since smaller sized Ti-coordinated cations can be formed and they are more easily adsorbed by the negatively charged carbonaceous spheres. By systematically controlling the adsorption time of the Ti source and controlling the calcination process to regulate the
combustion kinetics and diffusion dynamics (see Fig. 1 and Table S1†), we are able to tune the mesostructures of the resulting products. Essentially, aer leaving the CNSs in a 3 M TiCl4 aqueous solution for 6 h, the as-soaked CNSs were
calcined at 400C for 4 h at a heating rate of 10C min1to
remove the CNS templates. During the CNS removal process, the Ti source radially diffuses from the outside to the inside of the CNSs until they coalesce to form a shell. In fact, controlling the time for the precursor adsorption onto and within the CNSs signicantly affected the resulting structures. In the CNSs soaked for 6 h, TiO2-HNSs were formed (Fig. 1a and 2a), which is
ascribed to the scarce but opportune adsorbance of the Ti precursor. However, at reduced times (i.e., 4 h) nearly-collapsed hollow nanospheres (Fig. S3a†) formed due to a reduced adsorbance, which was conrmed by thermogravimetric (TG) analysis (Fig. S1†). In contrast, increasing the soaking time to 12 h in a 3 M TiCl4aqueous solution increased the adsorbance of
TiCl4onto and within the CNSs (Fig. S1†). Under these
condi-tions, following calcination treatment at 400 C for 4 h at a heating rate of 10C min1, the excess Ti source remaining
aer forming a shell would promote the formation of a core inside the shell during the decomposition of the as-soaked CNSs, yielding TiO2core–shell nanospheres (Fig. 1b and S3b†).
If the calcination heating rate of the CNSs soaked for 12 h was decreased to 1C min1, the decomposition rate of the CNSs was reduced and the Ti source would slowly shrink and aggre-gate continuously with the CNS templates until TiO2-PNSs were
eventually formed (Fig. 1c and 2b). It's reasonable that the CNSs soaked for 6 h could lead to porous nanospheres with loosely aggregated nanoparticles (TiO2-PNS-LS) since the adsorbance of
the Ti source was reduced (Fig. 1d, S1, S3c and S3d†). Moreover,
Fig. 1 Schematic diagram of the controllable synthesis for each
product. (a) TiO2-HNS; (b) TiO2-core–shell; (c) TiO2-PNS; (d) TiO2 -PNS-LS; (e) TiO2-HNS-500 and (f) TiO2-PNS-500.
Fig. 2 TEM micrographs of (a) TiO2-HNSs and (b) TiO2-PNSs. (c)
Spherical aberration corrected TEM micrograph of the TiO2-HNS shell, and (d) XRD patterns of TiO2-HNSs and TiO2-PNSs.
Open Access Article. Published on 26 October 2015. Downloaded on 16/06/2017 02:29:47.
This article is licensed under a
[image:2.595.308.548.447.691.2] [image:2.595.46.288.562.690.2]TiO2 hollow nanospheres and porous nanospheres composed
of about 15 nm sized nanoparticles (termed TiO2-HNS-500 and
TiO2-PNS-500, respectively) were also prepared using the
same conditions as those for the TiO2-HNSs and TiO2-PNSs,
respectively, with the exception of modifying the calcination temperature to 500C (Fig. 1e, f, S4a and S4b†). The larger particle size is attributed to the higher calcination tempera-ture yielding grain growth resulting in thicker shells in the TiO2-HNS-500 specimen compared to the TiO2-HNS samples.
The TiO2-HNS and TiO2-PNS structures are conrmed by
TEM micrographs in Fig. 2a and b. Both these two kinds of nanospheres are uniform with a diameter of about 80 nm and are composed of about 7 nm sized nanoparticles (Fig. S5†). The shell of the TiO2-HNSs is only as thin as about 7 nm conrmed
further using the spherical aberration corrected TEM images as shown in Fig. 2c, which means that the shell is composed of only a single layer of nanoparticles. The SEM micrographs in Fig. S6a and b†further show that both the TiO2-HNSs and the
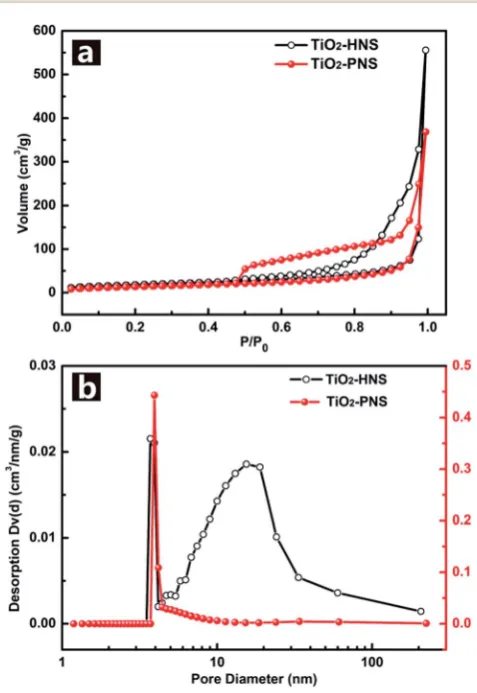
TiO2-PNSs are uniformly dispersed. The specic surface areas
and pore size distributions are investigated using N2
adsorp-tion/desorption analysis and shown in Fig. 3a and b. The TiO2
-HNSs have a higher specic surface area of 65.8 m2 g1than
that of 51.3 m2g1for the TiO2-PNSs. Moreover, the size of the
mesopores in the TiO2-PNSs is about 4 nm while the TiO2-HNSs
have more much larger pores around 20 nm as well as a few pores around 4 nm. The effects of calcination heating rate and temperature on the mesoporous structures have also been investigated as shown in Fig. S7,† which demonstrates that a high heating rate results in large pores and a high calcination temperature would destroy the pores.
High resolution TEM (HRTEM) micrographs in the insets of Fig. 2a and b reveal the lattices of the TiO2-HNSs and TiO2-PNSs,
which correspond to the {100} plane of anatase.41The
crystal-linities of both the TiO2-HNSs and TiO2-PNSs were analyzed
using X-ray powder diffraction (XRD), which conrmed the presence of crystallized anatase (JCPDS card no. 21-1272, space group: I41/amd, a ¼ 3.7845 A,˚ c ¼ 9.5143 ˚A) (Fig. 2d). The crystallite diameters of the TiO2-HNSs and TiO2-PNSs were
calculated to be 7.3 nm and 7.1 nm, respectively, using the Scherrer formula.42Raman spectra were used to further identify the composition of the TiO2-HNSs and TiO2-PNSs as shown in
Fig. S8.†The Raman lines at around 144, 197 and 639 cm1can
be assigned as the Egmodes of anatase TiO2. The Raman line at
around 399 cm1is assigned to the B
1gmode of anatase and the
Raman line at around 519 cm1 is assigned to the A
1g or B1g
mode of anatase.43,44No other Raman lines are observed, which
means that the samples are pure anatase. The XRD patterns of TiO2-HNS-500 and TiO2-PNS-500 samples demonstrate that
trace rutile is formed besides the main anatase phase as shown in Fig. S9†and the sizes of nanoparticles are calculated to be 16.1 nm and 15.2 nm, respectively, which is attributed to the higher calcination temperature. The small nanoparticles in the TiO2-HNSs and TiO2-PNSs are believed to be effective in the
high charge/discharge current rate performance in anodes for LIBs as previously described.
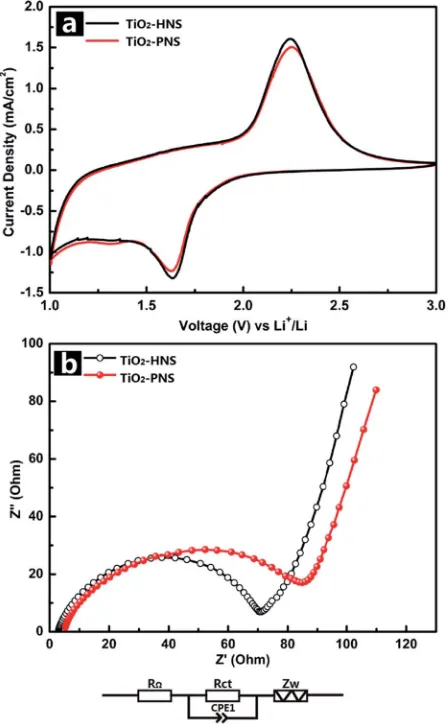
The electrochemical behaviors of the TiO2-HNS and TiO2
-PNS electrodes were measured using cyclic voltammetry (CV) at a scan rate of 1 mV s1 between 1.0 V and 3.0 V (Fig. 4a).
Apparent anodic and cathodic peaks are observed in both electrodes at about 2.2 V and 1.7 V, which is in agreement with the previous literature.45Slight peaks below 1.5 V are also found
for both the samples, which can be attributed to an irreversible capacity loss.46The TiO
2-HNSs show a higher current density
than that of the TiO2-PNSs manifested by a higher level charge
separation and electrochemical conductivity.34 The Nyquist plots for the samples in Fig. 4b show a single semicircle in the high frequency region corresponding to the charge-transfer resistance (Rct) and a sloping straight line in the low frequency
range corresponding to solid-state diffusion of lithium (Zw).47,48
TheRctof the TiO2-HNSs is smaller than that of the TiO2-PNSs,
suggesting that the charge transfer for the former occurs prior to that of the latter. This may be ascribed to a higher specic surface area that enables greater contact with the electrolyte and larger pores around 20 nm (besides the 4 nm small pores), which may facilitate better electrolyte transport and strain release compared to that in the TiO2-PNSs (Fig. 3a, b and Table
S2†). It is thus predicted that the performance of the TiO2-HNSs
as anodes for LIBs would be enhanced.
Standard TiO2/Li half-cells were used to measure the lithium
storage properties of the TiO2-HNSs and TiO2-PNSs as anodes.
Fig. 3 (a) Nitrogen adsorption/desorption isotherms and (b) Barret–
Joyner–Halenda (BJH) pore-size distribution curves of the TiO2-HNSs and TiO2-PNSs.
Open Access Article. Published on 26 October 2015. Downloaded on 16/06/2017 02:29:47.
This article is licensed under a
[image:3.595.48.287.346.693.2]Fig. 5a displays the rst charge–discharge voltage proles of the samples at a current rate of 1 C (167.5 mA g1) between
1.0 V and 3.0 V. The potential falls to a plateau of 1.7 V quickly and then gradually declines to the cut-offpotential of 1.0 V, consistent with previous literature.49,50 An initial discharge
capacity of 295.2 mA h g1 and charge capacity of 228.2 mA h g1 are achieved for the TiO2-HNSs, resulting in
a coulombic efficiency of 77.3%. The TiO2-PNSs exhibit an
initial discharge capacity of 256.3 mA h g1and charge capacity of 195.9 mA h g1, leading to a coulombic efficiency of 76.4%. The slightly lower coulombic efficiency is ascribed to the irre-versible capacity loss, corroborating the CV measurement. Fig. 5b shows the cycling performance of the TiO2-HNSs and
TiO2-PNSs at a current rate of 1 C between 1.0 V and 3.0 V for
100 cycles. Aer 100 cycles, the TiO2-HNSs show a higher
capacity than the TiO2-PNSs (211.9 mA h g1vs.196.0 mA h g1).
The higher capacity of the TiO2-HNSs is ascribed to the higher
specic surface area, which can lead to more surface lithium storage51(Table S2†). Although demonstrating a slightly lower
capacity, the TiO2-PNSs show a capacity retention of 92.8% with
respect to the reversible specic capacities aer 100 cycles, which is higher than that of the TiO2-HNSs (86.9%). This results
from the very thin shell of the TiO2-HNSs, which is composed of
only a single layer of nanoparticles and can fracture due to volume expansion during the charge and discharge processes (as seen in the TEM micrographs aer 100 cycles, Fig. S10†). However, the TiO2-PNSs still maintain an unchanged stable
structure leading to outstanding cycling performance, signi -cantly better than that of commercial TiO2 Degussa P25.36
Moreover, the mass energy density of the TiO2-PNSs would be
higher because of their more effective volumetric occupation compared to the TiO2-HNSs.
Considering the importance of the potential for high rate applications, the cycling performance of the TiO2-HNSs and
TiO2-PNSs at various charge and discharge current rates was
measured. As shown in Fig. 6a, the capacity drops slowly as the current rate is increased up to 20 C (approximately 3 min for a charge or discharge process) from 1 C. A capacity of 125.9 mA h g1for the TiO2-HNSs and 113.4 mA h g1for the TiO2-PNSs
can be achieved even at a high current rate of 20 C. A high discharge capacity of 205.4 mA h g1 for the TiO2-HNSs and
Fig. 4 (a) Cyclic voltammetry profiles of the TiO2-HNSs and TiO2
-PNSs at a scan rate of 1 mV s1between 1.0 V and 3.0 V for thefirst cycle, and (b) electrochemical impedance spectra (EIS) of the TiO2 -HNSs and TiO2-PNSs (RU: external resistance, Rct: charge transfer resistance, CPE1: constant phase element,Zw: Warburg impedance).
Fig. 5 (a) Initial charge–discharge voltage profiles and (b) cycling
performance of the TiO2-HNSs and TiO2-PNS at a current rate of 1 C between 1.0 and 3.0 V.
Open Access Article. Published on 26 October 2015. Downloaded on 16/06/2017 02:29:47.
This article is licensed under a
[image:4.595.311.547.48.400.2] [image:4.595.56.280.51.413.2]190.1 mA h g1for the TiO
2-PNSs can still be achieved when the
current rate is reduced back to 1 C. The high discharge capac-ities at various current rates are summarized in Table S3†and are presented in Fig. 6b. This superior rate performance can be attributed to the special stable structures andne particle sizes, which lead to very short lithium ion diffusion lengths and electron pathways during the lithium insertion and expulsion.30,31,52
In comparison, the rate performance of the TiO2-HNS-500
and TiO2-PNS-500 samples composed of larger nanoparticles
was also measured as shown in Fig. S11† and the data are summarized in Table S3.†At a current rate of 1 C, the TiO2
-HNS-500 sample shows a discharge capacity of 172.5 mA h g1while the TiO2-PNS-500 sample shows a discharge capacity of 145.7
mA h g1. Discharge capacities of 65.4 and 54.7 mA h g1for the TiO2-HNS-500 and TiO2-PNS-500 samples, respectively, are
achieved at a high current rate of 20 C. The capacities at 20 C are only 37.91% and 37.54% of the capacities at 1 C for the TiO2
-HNS-500 and TiO2-PNS-500 samples, respectively, which
are much lower than the results of 59.47% and 58.20% for the TiO2-HNSs and TiO2-PNSs, respectively. This results from the
smaller nanoparticles in the TiO2-HNS and TiO2-PNS
speci-mens, which could decrease the lithium ion diffusion lengths and shorten the electron pathways during the charge and discharge processes.52
The long-term cycling performance of the TiO2-HNSs and
TiO2-PNSs at a high current rate of 20 C has also been
demon-strated (Fig. 6c). Even aer 3000 cycles, the TiO2-HNSs and TiO2
-PNSs still maintain high discharge capacities of 103.0 mA h g1 and 110.2 mA h g1, respectively, with high retentions of 80.97% and 95.2% compared to the highest discharge capac-ities around the 116thcycle, respectively. The TiO
2-PNSs show
a signicantly lower capacity loss because of their more stable structure than that of the TiO2-HNSs. The superior long-term
cycling performance endows these nanospheres with great potential for application.
Conclusions
In summary, uniform TiO2 hollow and mesoporous
nano-spheres composed of ultrasmall nanoparticles were successfully fabricated using quasi-nano-sized carbonaceous spheres with a diameter of 260 nm as templates. The hollow and mesoporous structures could be controlled by controlling the heating rate of the calcination process and the adsorbance of TiCl4. When
measured as anodes for LIBs, both TiO2 hollow and
meso-porous nanospheres show good cycling performance, high specic capacity and high current rate performance. High specic capacities of 211.9 and 196.0 mA h g1are achieved for TiO2hollow and mesoporous nanospheres at a current rate of 1
C aer 100 cycles. Even at a high current rate of 20 C, they can still retain high specic capacities of 125.9 and 113.4 mA h g1.
TiO2hollow and mesoporous nanospheres demonstrate
long-term discharge capacities of 103.0 and 110.2 mA h g1 aer 3000 cycles at 20 C. The superior performance especially at high current rates is ascribed to the stable porous structures composed of ultrasmall nanoparticles, which enhance the interfacial contact area with the electrolyte and contribute to much shorter lithium ion diffusion lengths and electron
transfer pathways. These TiO2 nanospheres have a great
potential to be used for safe and high charge/discharge current rate devices.
Acknowledgements
We are grateful fornancial support from the National Natural Science Foundation of China (no. 21031005, 21271021, 51202248, 51472025, 51572261), and National Science Fund for Distinguished Young Scholars (no. 21325105).
Notes and references
1 M. Yoshio, R. J. Brodd and A. Kozawa,Lithium-Ion Batteries. Science and Technologies, Springer, New York, 2009.
2 Y. G. Wang, H. Q. Li, P. He, E. Hosono and H. S. Zhou, Nanoscale, 2010,2, 1294–1305.
3 H. Kim, M. Seo, M. Park and J. Cho,Angew. Chem., Int. Ed., 2010,49, 2146–2149.
4 L. Bazin, S. Mitra, P. L. Taberna, P. Poizot, M. Gressier, M. J. Menu, A. Barnab´e, P. Simon and J. M. Tarascon, J. Power Sources, 2009,188, 578–582.
5 X. L. Huang, D. Xu, S. Yuan, D. L. Ma, S. Wang, H. Y. Zheng and X. B. Zhang,Adv. Mater., 2014,26, 7264–7270.
6 P. Poizot, S. Laruelle, S. Grugeon, L. Dupont and J. M. Tarascon,Nature, 2000,407, 496–499.
7 S. M. Xu, C. M. Hessel, H. Ren, R. B. Yu, Q. Jin, M. Yang and D. Wang,Energy Environ. Sci., 2014,7, 632–637.
Fig. 6 (a) Cycling performance at various charge–discharge current
rates of the TiO2-HNSs and TiO2-PNSs between 1.0 and 3.0 V. (b) Statistics of the discharge specific capacities at various current rates according to the rate performance in (a). (Each discharge capacity summarized here is the last cycle of each current rate.) (c) Long-term cycling performance of the TiO2-HNSs and TiO2-PNSs at a high current rate of 20 C for 3000 cycles.
Open Access Article. Published on 26 October 2015. Downloaded on 16/06/2017 02:29:47.
This article is licensed under a
[image:5.595.48.288.50.233.2]8 K. Z. Cao, L. F. Jiao, H. Q. Liu, Y. C. Liu, Y. J. Wang, Z. P. Guo and H. T. Yuan,Adv. Energy Mater., 2014,5, 201401421, DOI: 10.1002/aenm.201401421.
9 M. Du, C. H. Xu, J. Sun and L. Gao,J. Mater. Chem. A, 2013,1, 7154–7158.
10 X. D. Xu, R. G. Cao, S. Jeong and J. Cho,Nano Lett., 2012,12, 4988–4991.
11 J. Y. Wang, N. L. Yang, H. J. Tang, Z. H. Dong, Q. Jin, M. Yang, D. Kisailus, H. J. Zhao, Z. Y. Tang and D. Wang, Angew. Chem., 2013,125, 6545–6548.
12 K. Z. Cao, L. F. Jiao, H. Xu, H. Q. Liu, H. Y. Kang, Y. Zhao, Y. C. Liu, Y. J. Wang and H. T. Yuan, Adv. Sci., 2015, 1500185, DOI: 10.1002/advs.201500185.
13 S. Yuan, X. L. Huang, D. L. Ma, H. G. Wang, F. Z. Meng and X. B. Zhang,Adv. Mater., 2014,26, 2273–2279.
14 Z. C. Bai, Z. C. Ju, C. L. Guo, Y. T. Qian, B. Tang and S. L. Xiong,Nanoscale, 2014,6, 3268–3273.
15 B. Scrosati and J. Garche,J. Power Sources, 2010,195, 2419– 2430.
16 M. Y. Nie, D. P. Abraham, Y. J. Chen, A. Bose and B. L. Lucht, J. Phys. Chem. C, 2013,117, 13403–13412.
17 S. Goriparti, E. Miele, F. D. Angelis, E. D. Fabrizio, R. P. Zaccaria and C. Capiglia,J. Power Sources, 2014,257, 421–443.
18 Z. H. Chen, I. Belharouak, Y. K. Sun and K. Amine, Adv. Funct. Mater., 2013,23, 959–969.
19 J. Liu, K. P. Song, P. A. van Aken, J. Maier and Y. Yu,Nano Lett., 2014,14, 2597–2603.
20 H. G. Jung, S. W. Oh, J. Ce, N. Jayaprakash and Y. K. Sun, Electrochem. Commun., 2009,11, 756–759.
21 J. Du, X. Y. Lai, N. L. Yang, J. Zhai, D. Kisailus, F. B. Su, D. Wang and L. Jiang,ACS Nano, 2011,5, 590–596.
22 O. K. Varghese, D. W. Gong, M. Paulose, K. G. Ong, E. C. Dickey and C. A. Grimes,Adv. Mater., 2003,15, 624–627. 23 N. L. Yang, Y. Y. Liu, H. Wen, Z. Y. Tang, H. J. Zhao, Y. L. Li
and D. Wang,ACS Nano, 2013,7, 1504–1512.
24 J. Du, J. Qi, D. Wang and Z. Y. Tang,Energy Environ. Sci., 2012,5, 6914–6918.
25 M. Wagemaker, G. J. Kearley, A. A. van Well, H. Mutka and F. M. Mulder,J. Am. Chem. Soc., 2003,125, 840–848. 26 F. Gligor and S. W. de Leeuw,Solid State Ionics, 2006,177,
2741–2746.
27 G. Q. Zhang, H. B. Wu, T. Song, U. Paik and X. W. Lou, Angew. Chem., Int. Ed., 2014,53, 12590–12593.
28 J. P. Wang, Y. Bai, M. Y. Wu, J. Yin and W. F. Zhang,J. Power Sources, 2009,191, 614–618.
29 Q. F. Zhang, E. Uchaker, S. L. Candelaria and G. Z. Cao, Chem. Soc. Rev., 2013,42, 3127–3171.
30 P. G. Bruce, B. Scrosati and J. M. Tarascon,Angew. Chem., Int. Ed., 2008,47, 2930–2946.
31 Y. G. Guo, J. S. Hu and L. J. Wan,Adv. Mater., 2008,20, 2878– 2887.
32 T. B. Lan, Y. B. Liu, J. Dou, Z. S. Hong and M. D. Wei,J. Mater. Chem. A, 2014,2, 1102–1106.
33 Z. Y. Wang, L. Zhou and X. W. Lou,Adv. Mater., 2012,24, 1903–1911.
34 S. Yoon and A. Manthiram,J. Phys. Chem. C, 2011,115, 9410– 9416.
35 J. Qi, X. Y. Lai, J. Y. Wang, H. J. Tang, H. Ren, Y. Yang, Q. Jin, L. J. Zhang, R. B. Yu, G. H. Ma, Z. G. Su, H. J. Zhao and D. Wang,Chem. Soc. Rev., 2015,44, 6749–6773.
36 H. Ren, R. B. Yu, J. Y. Wang, Q. Jin, M. Yang, D. Mao and D. Wang,Nano Lett., 2014,14, 6679–6684.
37 J. W. Kang, D. H. Kim, V. Mathew, J. S. Lim, J. H. Gim and J. Kim,J. Electrochem. Soc., 2011,158, A59–A62.
38 X. M. Sun and Y. D. Li,Angew. Chem., Int. Ed., 2004,43, 3827– 3831.
39 X. Y. Lai, J. Li, B. A. Korgel, Z. H. Dong, Z. M. Li, F. B. Su, J. Du and D. Wang,Angew. Chem., 2011,123, 2790–2793. 40 V. D. Hildenbrand, H. Fuess, G. Pfaffand P. Reynders, Z.
Physiol. Chem., 1996,194, 139–150.
41 Q. J. Xiang, J. G. Yu, W. G. Wang and M. Jaroniec,Chem. Commun., 2011,47, 6906–6908.
42 N. M. Kinsinger, A. Dudchenko, A. Wong and D. Kisailus, ACS Appl. Mater. Interfaces, 2013,5, 6247–6254.
43 H. Q. Liu, K. Z. Cao, X. H. Xu, L. F. Jiao, Y. J. Wang and H. T. Yuan,ACS Appl. Mater. Interfaces, 2015,7, 11239–11245. 44 X. X. Xue, W. Ji, Z. Mao, H. J. Mao, Y. Wang, X. Wang, W. D. Ruan, B. Zhao and J. R. Lombardi,J. Phys. Chem. C, 2012,116, 8792–8797.
45 J. Wang, Y. K. Zhou, Y. Y. Hu, R. O’Hayre and Z. P. Shao,J. Phys. Chem. C, 2011,115, 2529–2536.
46 H. B. Wu, X. W. Lou and H. H. Hng,Chem.–Eur. J., 2012,18, 3132–3135.
47 H. Han, T. Song, E. K. Lee, A. Devadoss, Y. Jeon, J. Ha, Y. C. Chung, Y. M. Choi, Y. G. Jung and U. Paik,ACS Nano, 2012,6, 8308–8315.
48 R. W. Mo, Z. Y. Lei, K. N. Sun and D. Rooney,Adv. Mater., 2014,26, 2084–2088.
49 S. Ding, J. S. Chen, D. Luan, F. Y. C. Boey, S. Madhavi and X. W. Lou,Chem. Commun., 2011,47, 5780–5782.
50 Z. Q. Wang, L. Xiang, H. Xu, Y. Yang, Y. J. Cui, H. G. Pan, Z. Y. Wang, B. L. Chen and G. D. Qian,J. Mater. Chem. A, 2014,2, 12571–12575.
51 A. G. Dylla, G. Henkelman and K. J. Stevenson,Acc. Chem. Res., 2013,46, 1104–1112.
52 J. Wang, J. Polleux, J. Lim and B. Dunn,J. Phys. Chem. C, 2007,111, 14925–14931.
Open Access Article. Published on 26 October 2015. Downloaded on 16/06/2017 02:29:47.
This article is licensed under a