University of Southern Queensland School of Mechanical and Electrical Engineering
Demand Management Storage Project (DMSP) –
An Application of Grid Scale Battery Energy Storage Systems
Dissertation submitted by Jennifer Jiang
In fulfilment of the requirements of
ENG4111 and ENG4112 Research Project
Towards the degree of
BACHOLAR OF ENGINEERING (POWER)
ABSTRACT
Grid scale BESS (battery energy storage system) has been identified as one of the key technologies in the utility network of the future. There are significant benefits associated with their ability to store energy. This study aims to use economic models to evaluate grid scale BESS benefits and to sum them up into value propositions.
DMSP project is planning to install one of the largest BESS systems at a 22kV distribution feeder in Australia. According to (Eyer & Corey, 2010) guide, energy storage systems could have 17 electric grid related applications which across 5 categories: electrical supply, ancillary services, grid system, end user/utility customer and renewable integration. Among all the applications, DMSP project focuses on two major applications: using grid scale BESS for energy time-shift and feeder construction deferral applications.
In order to quantify the economic feasibility of the DMSP BESS system, studies were done to analyse the distribution system, energy market and BESS system. Two data models had been created to quantify the two BESS applications with the factors such as energy prices, feeder load data and battery parameters. With the data models, methods were found out about how to simulate electrical and economic performance of the battery energy storage system and quantify these performances into market value.
The simulation results had been presented and analysed in the document. From the simulation, it concluded that economic feasibility of BESS energy time-shift application is depended on active level of energy market and also the BESS system cost; Feeder construction deferral application can bring significant benefits if the feeder upgrade construction costs are high.
Further in the research an optimal battery control scheme was developed using the forward dynamic programming approach. Based on the data models, this scheme provided the optimal battery control strategy to achieve the maximum benefits from BESS application.
LIMITATION OF USE
University of Southern Queensland Faculty of Health, Engineering and Sciences
ENG4111/ENG4112 Research Project
Limitations of Use
The Council of the University of Southern Queensland, its Faculty of Health, Engineering & Sciences, and the staff of the University of Southern Queensland, do not accept any responsibility for the truth, accuracy or completeness of material contained within or associated with this dissertation.
Persons using all or any part of this material do so at their own risk, and not at the risk of the Council of the University of Southern Queensland, its Faculty of Health, Engineering & Sciences or the staff of the University of Southern Queensland.
CERTIFICATION OF DISSERTATION
University of Southern Queensland Faculty of Health, Engineering and Sciences
ENG4111/ENG4112 Research Project
Certification of Dissertation
I certify that the ideas, designs and experimental work, results, analyses and conclusions set out in this dissertation are entirely my own effort, except where otherwise indicated and acknowledged.
I further certify that the work is original and has not been previously submitted for assessment in any other course or institution, except where specifically stated.
ACKNOWLEDGMENTS
I would like to acknowledge and thank:
• Associate Professor Tony Ahfock – Faculty of Health, Engineering and Science, USQ.
• My colleagues at Powercor/Citipower, with special mention of Mrs Ming Yang.
• My husband Wei and son Daniel.
Jennifer Jiang
University of Southern Queensland
TABLE OF CONTENTS
Page
ABSTRACT ... ii
LIMITATION OF USE ... iii
CERTIFICATION OF DISSERTATION ... iv
ACKNOWLEDGMENTS ... v
TABLE OF CONTENTS ... vi
LIST OF TABLES ... ix
LIST OF FIGURES ... x
1. INTRODUCTION ... 12
1.1. Research Scope ... 12
1.2. Research Objectives ... 14
1.3. Summary of Thesis ... 15
2. LITERATURE REVIEW ... 17
2.1. Battery Technologies and Battery Energy Storage System ... 18
2.1.1. Introduction ... 18
2.1.2. Battery Technologies ... 21
2.1.3. Battery Energy Storage Applications ... 23
2.2. BESS Economic Benefits ... 26
2.2.1. Introduction ... 26
2.2.2. BESS for Electric Energy Time-Shift ... 27
2.2.3. Feeder Construction Deferral ... 28
2.2.5. BESS Charge/Discharge Strategies... 32
3. DMSP PROJECT - STUDY OF BESS APPLICATION IN DISTRIBUTION SYSTEM ... 34
3.1. Introduction ... 34
3.2. DMSP System Components and Specification ... 35
3.2.1. 22kV Switchgear ... 35
3.2.2. Transformer ... 37
3.2.3. Power Conversion System ... 38
3.2.4. Battery System ... 39
3.2.5. Battery Management System ... 41
3.3. DMSP System Control Mode ... 42
3.3.1. Scheduled Mode ... 42
3.3.2. Peak Shaving Mode ... 42
4. BESS SYSTEM MODELLING ... 44
4.1. Introduction ... 44
4.2. BESS Economic Analysis Principles ... 45
4.2.1. BESS System Cost Modelling ... 45
4.2.2. Present Worth Factor ... 46
4.2.3. BESS System Payback Period ... 47
4.3. BESS Application Modelling ... 48
4.3.1. Electric Energy Time-Shift Model ... 48
4.3.2. Feeder Construction Deferral Model ... 51
4.4. Forward Dynamic Programming Approach ... 54
4.4.1. Introduction ... 54
5. SYSTEM SIMULATION & RESULTS ... 57
5.1. Introduction ... 57
5.2. Simulation using HOMER Modelling ... 58
5.2.1. Data Used for HOMER Simulation ... 58
5.2.2. Simulation for Energy Time-Shift ... 61
5.2.3. Simulation for Feeder Construction Deferral ... 65
5.2.4. Some Further Investigations ... 69
5.3. Optimal Battery Control Method ... 72
6. Conclusion ... 77
6.1. Conclusions ... 77
6.2. Suggestions for Future Works ... 78
APPENDIX A: ENG4111/4112 Research Project Specification ... 80
APPENDIX B: OPTIMAL BATTERY CONTROL MATLAB CODE ... 81
LIST OF TABLES
Table 2.1: Electricity Generation in Australia (IEA, 2012) ... 19
Table 2.2: Five Categories of Energy Storage Applications ... 23
Table 3.1: Estimated energy at risk for the studied zone substation (POWERCOR, 2014) ... 34
Table 3.2: DMSP 22kV Switchgear Specifications ... 36
Table 3.3: DMSP Step-up/Step-down Transformer Specifications (manufacture data)... 37
Table 3.4 DMSP Power Conversion System Specification (manufacture data) ... 38
Table 3.5: Battery System Specification (manufacture data) ... 39
Table 3.6: Battery System Power Delivery Capacity ... 40
Table 3.7: Battery System Maximum Long Term Recharge Power ... 40
Table 3.8: Battery Cell Specification (manufacture data) ... 40
Table 5.1: Three spot price datasets details ... 58
Table 5.2: Feeder Construction Deferral Cost Comparison Case 1-3 ... 69
Table 5.3: Feeder Construction Deferral Cost Comparison Case 1-3 with Half BESS Costs ... 70
LIST OF FIGURES
Figure Page
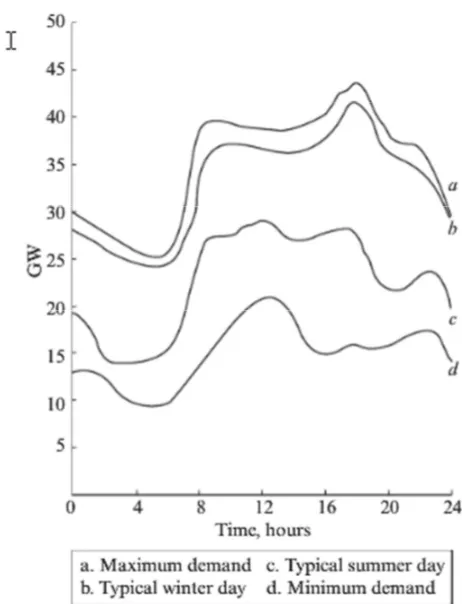
Figure 2-1: Summer and winter demand on a typical system, including
days of maximum and minimum demand
(TER-GAZARIAN, A., 2011) ... 20
Figure 2-2: A simple electric energy time-shift strategy (MOSELEY, P.T. and Garche, J., 2014) ... 32
Figure 3-1: DMSP System Connection Diagram ... 35
Figure 3-2: DMSP Lithium polymer battery discharge curve (PERRY, B., 2012) ... 41
Figure 4-1: Spot Market Supply and Demand Curves ... 48
Figure 4-2: A Typical Spot Price Daily Curve ... 49
Figure 4-3: A Yearly 3 Phase 15min Average Peak Load Curve ... 51
Figure 4-4: Feeder Peak Load Curve Dropped with 2MW BESS Installed ... 52
Figure 4-5: An Example of Dynamic Programming for the Least Cost Path (graph from internet) ... 54
Figure 4-6: Battery Storage System Charging/Discharge Routine Network ... 55
Figure 5-1: Power Price Graphs for Case 1-3 ... 59
Figure 5-2: Whole Year 15 minutes Average Power Curve ... 60
Figure 5-3: Load Monthly Averages ... 60
Figure 5-5: Energy Purchased vs. Energy Sold in Application Case 1-3 (kW) ... 63
Figure 5-6: Battery System Energy Content Case 1-3 ... 64
Figure 5-8: Feeder Upgrading HOMER Schematic ... 65
Figure 5-9: Upgraded Feeder Cost Summary Case 1-3 ... 66
Figure 5-10: Feeder Construction Deferral HOMER Schematic ... 67
Figure 5-11: Feeder Construction Deferral Model Search Space Setting ... 68
Figure 5-12: Feeder Construction Deferral Cost Summary Case 1-3 ... 69
Figure 5-13: Battery Round Trip Efficiency vs. Battery Benefit ... 70
Figure 5-14: HOMER Battery Charge/Discharge Routine (16/02/2014-17/02/2014) ... 72
Figure 5-15: Flow Chart for the Optimal Battery Control Scheme ... 73
Figure 5-16: Spot Prices Data from 16/02/2014 to 17/02/2014 ... 74
Figure 5-17: Parameter Input Dialog for Optimal Battery Control ... 75
1.
INTRODUCTION
1.1.Research Scope
Battery energy storage systems (BESS) based on rechargeable/secondary batteries are not a new technologies introduced to the electricity distribution network. They were widely used before AC network becoming the main power supply system at the turn of 20th centuries, where generating stations would often shut down overnight, with lead acid accumulators supplying the residual loads on the DC networks (BAKER, J. and Collinson, A., 1999). But grid scale utility battery storage has been uncommon until fairly recent time because before the systems had disadvantages of low energy densities, small power capacity, high maintenance costs, a short cycle life and a limited discharge capability (CHEN, H. et al., 2000).
With the new developments of battery technologies, there are great improvements of battery energy storage system on both the physical forms and system functions. Today there are significant benefits associated with BESS systems. They not only provide construction flexibility and environmental benefits, but also offer a number of important operating benefits to the electricity utility with their system ability of controllable energy storage and energy releasing. Grid scale BESS system has attracted a lot of interests from electricity industry and been identified as one of the important technologies for the utility network of the future. Within less than 50 years, BESS technology has been adopted in many electrical applications including peak shaving/load shifting through targeted demand management, renewable integration through two way power flows capability, frequency regulation, reactive power support and voltage stability support etc.
Grid scale battery energy storage system displays economic potentials for applying on the electricity network. Battery energy storage system (BESS) commonly contains battery system and battery power conversion system which is generally initiated with the comparable large amount of investment especially for grid scale BESS. From finance point of view, an economic analysis is essential to exam the potential benefits of battery energy storage system. The analysis will exhibit the economic feasibility of BESS systems in grid scale applications. However, due to the differences in BESS system design and complexity of distribution network and electricity market environment, these benefits are hard to be quantified. A general economic analysis method and model needs to be further studied.
been planned to install at the distribution feeder with 2.5MVA / 2MW / 2MWh battery capacity. This system is targeted to achieve:
1) Energy time-shift: energy arbitrage from power price difference between off-peak times and on-peak times;
2) Feeder construction deferment: use BESS system to bring down the feeder peak load demand level through peak shaving at the point of connection to the utility distribution system to provide feeder construction deferment.
The key focuses of the research with this case application lies on several aspects:
1) What benefits can be brought by battery storage systems (BESS) impacted on distribution network;
2) How to quantify the impacts of a BESS system using mathematical models;
3) How to simulate the BESS system operation to demonstration the potential benefits.
1.2.Research Objectives
In order to quantify the economic feasibility of the BESS system applications, the data models need to be created to reflect the distribution system, energy market and BESS system. With the data models, methods need to be found out about how to simulate electrical and economic performance of the battery energy storage system and quantify these performances into market value.
The objectives of this thesis can be summarized as following:
1. Investigate the applications of battery energy storage system (BESS) on distribution network and analyse their impacts.
2. Explore the parameters and mathematic models of BESS systems energy time-shift and feeder construction deferral applications and evaluate their potential economic benefits.
1.3.Summary of Thesis
This thesis contains total six chapters.
The first chapter gives an introduction relevant to the objectives of this thesis. A brief explanation is given for the background and motives of the study.
Chapter two provides the literature review of previous researches which are related to the thesis’s objectives. It will cover previous researches about the area of BESS applications, BESS economic analysis and BESS operation simulation. In this chapter, two major applications are reviewed along with the economical beneficial analysis overviews and battery control strategy discussion.
DMSP project’s details are provided in chapter three. In this chapter, a general description will be given for system setting of the BESS system installed by DMSP project. The specifications and parameters of BESS system are provided including the information for system primary equipment such as 22kV switchgear, transformer, power conversion system, battery system and system secondary parts such as battery management system. Further in this chapter, the potential applications for a BESS system are discussed. The focus of DMSP project lies on two major applications which are energy time-shift and distribution construction deferral.
In the chapter four, the BESS system economic analysis principles are first introduced. The analysis principles include BESS system cost modelling, benefit present worth factor and BESS system investment payback period. The chapter also describes the mathematic models used for the economic analysis of the two major applications of BESS system: energy time-shift and feeder construction deferral with the essential parameters. The chapter also present the BESS system control method based on the forward dynamic programming algorithm which address optimum operation to maximum the benefits of both applications.
2.
LITERATURE REVIEW
2.1.Battery Technologies and Battery Energy Storage System
2.1.1. Introduction
Energy storage system uses devices to convert and store exceeded energy for future usages. During the process, energy transforms from one form to another form which is suitable for storage in the particular physical media. Nowadays energy storage has been play an important role because with the good energy storage technology we can get flexible, convenient and constant energy supplies in many fields.
In the electricity industry energy movement followings generation, distribution and customer supply procedures. The energy generation may be produced by the following types of power generation installations (TER-GAZARIAN, A., 2011):
• hydro plants; • gas turbine plants;
• conventional thermal plants; • renewable plants;
• nuclear power plants (which we don’t have them in Australia);
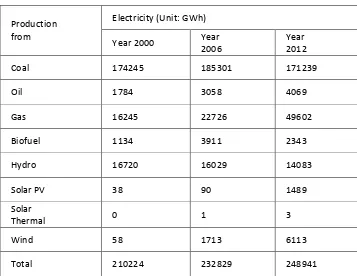
Table 2.1: Electricity Generation in Australia (IEA, 2012)
Production from
Electricity (Unit: GWh)
Year 2000 Year
2006
Year 2012
Coal 174245 185301 171239
Oil 1784 3058 4069
Gas 16245 22726 49602
Biofuel 1134 3911 2343
Hydro 16720 16029 14083
Solar PV 38 90 1489
Solar
Thermal 0 1 3
Wind 58 1713 6113
Total 210224 232829 248941
Figure 2-1: Summer and winter demand on a typical system, including days of maximum and minimum demand(TER-GAZARIAN, A., 2011)
Electrical energy can’t be stored directly. But with the energy storage system, it can be transferred to and stored as another form of energy and converted back to electrical energy when need. That is why energy storage system is required as an essential unit in the electrical network to coordinate the balance between energy generation and supply. This kind of units can be defined as electrical energy storage is “any installation or method in a power system, usually subject to independent control, with the help of which it is possible to store energy, generated in the power system, keep it stored and use it in the power system when necessary” (TER-GAZARIAN, A., 2011). Electrical energy is stored when energy supply exceeds the consumption and released at the peak load.
There are many forms and means of energy storage applied in the electricity industry. The most common technologies used in power system include (TER-GAZARIAN, A., 2011):
• Flywheels energy storage • Pumped hydro energy storage • Compressed air energy storage • Hydrogen and other synthetic fuels • Electrochemical energy storage • Capacitor bank storage
• Superconducting magnetic energy storage
Among all these technologies, electrochemical energy storage has the advantages of providing the flexibility in capacity, siting, and rapid response which are required to meet application demands over a much wider range of functions than many other types of storage (LAWDER, M. et al., 2014). As one of electrochemical energy storage, battery energy storage system (BESS) has shown a lot of potentials and attracts a lot of interests from electricity industry. It is due to their versatility, high energy density and high efficiency (DIVYA, K. C. and Ostergaard, Jacob, 2009). As the more and more popular used technology applied to the electrical network, the costs of BESS system has decreased a lot along with the improvement of battery life and performance (EPRI, 2003).
2.1.2. Battery Technologies
The electric batteries are devices made of a series of electrochemical cells where chemical energy can be converted to or from electrical energy. Important features of batteries are the power and energy capacities, efficiency, their life span, operating temperature, depth of discharge, self-discharge, and energy density (DIVYA, K. C. and Ostergaard, Jacob, 2009). Batteries has a long history in the electrical supply but was disappeared long time ago due to the cost and lack of efficiency at that time. From the late time of last century, batteries as the energy storage medium are back to the electrical applications. It is because that the power generation scenario has been changed where renewable energy is preferred by publicity and the proportion of renewable energy has been progressively increased. Since then significant development has occurred in the battery technology. Currently, BESS system has played as a more and more important role in the electrical industry.
1) Lead acid: each cell of a lead-acid battery comprises a positive electrode of lead dioxide and a negative electrode of sponge lead, separated by a micro-porous material and immersed in an aqueous sulphuric acid electrolyte (DIVYA, K. C. and Ostergaard, Jacob, 2009). The lead acid battery system is a mature technology and has widely used in the power system applications. The advantages of this type battery are low cost with high voltage per cell and good capacity life. While the disadvantages are its heavy weight, poor low-temperature characteristic and easy to get damaged at the discharge state (CROMPTON, T.R., 2000). The 10MW BESS built in Chino Substation Facility by Southern California Edison at 1988 is using lead acid battery banks (BHARGAVA, B. and Dishaw, G., 1998). 2) Lithium ion (Li ion): the cathode in these batteries is a lithiated metal
2.1.3. Battery Energy Storage Applications
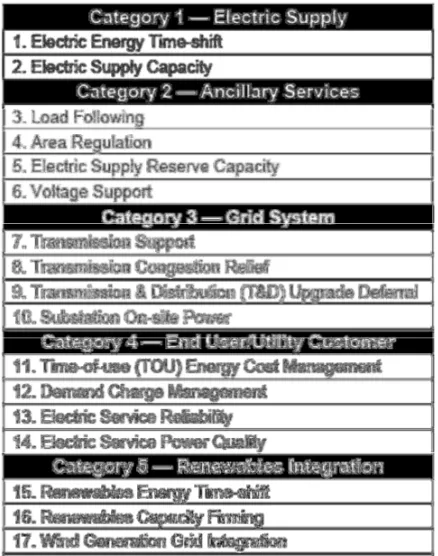
[image:23.612.196.415.216.494.2]There are many different types of energy storage system application. In the report of (EYER, J. and Corey, G., 2010), it summarises and groups the most popular energy storage application into five catalogues as shown in Table 2.2:
Table 2.2: Five Categories of Energy Storage Applications
A lot of researches have been through for these technologies. Among all these technologies, electrochemical energy storage devices offer dependence, capacity, or response capabilities to meet application demands over a much wider range of functions than many other types of storage (HUGGINS, R.A., 2010). Electrochemical energy storage especially battery energy storage systems (BESSs) currently have seen great growth recently due to their versatility, high energy density, and efficiency (DIVYA, K. C. and Ostergaard, Jacob, 2009).
Electrical energy is stored during times when production exceeds consumption and released when load is greater than the combined power generation.
There are some main applications can be used in grid scale BESS (AGUERO, Julio Romero et al., 2013):
• Frequency regulation: Using battery energy storing and releasing to adjust the frequency variation.
• Spinning reserve: Using battery energy storage to reduce the spinning reservation amount.
• Peak shaving/load shifting: Battery energy storage system stores the energy during the off-peak demand period and releases the energy during the peak period which can reduce the maximum capacity of whole utility network and then further reduce the operation cost and infrastructure expense.
• Renewable integration: As stated previously, the battery energy system can provide rapid response to the large amount of intermittent energies injected to the grid.
• The future developments for grid scale BESSs are relied on these aspects:
• Developments upon the new battery technologies.
• Developments for analysis and examine the technical and economic feasibility of integrating battery in electrical networks (DIVYA, K. C. and Ostergaard, Jacob, 2009).
• Further researches on real-time intelligent control algorithms for grid scale battery energy storage system.
• Development of integration of grid scale BESS within the smart grid.
There are many grid scale BESSs applications developed worldwide. Here briefly review some of these projects:
1) In 1986 a 17MW 14MWh lead acid battery storage system was installed at BEWAG in Berlin. The system was designed for frequency regulation and spinning reserve. It operated for 8 years and had a capacity turnover of 7000 times of normal capacity and the total energy turnover of about 100GWh (WAGNER, R., 2004).
3) Puerto Rico Electric Power Authority (PREPA) was installed in 1995 in Puerto Rico. Its system size is 20MW 14MWh. The battery system is using lead-acid battery for the spinning reserve and frequency control (TAYLOR, P. et al., 1997).
4) Japan Wind Development Company built the 51MW Rokkasho-Futamata wind farm integrated with 34MW battery storage system. The battery energy system consisted of 17 sets of 2MW NaS battery units. The purpose of this battery system was for load levelling and enabling the storage for low cost off-peak power for sale/distribute during peak demand time (CLEANENERGY ACTION PROJECT, 2015).
5) In 2011, AES Gener completed construction on a 544MW thermal power plant in the town Mejillones in Northern Chile. To ensure grid reliability against transmission or generation losses, a 20MW/5MWh battery energy storage system was installed for load following purpose (ESA, 2011).
6) In 2011 AES built a 98MW wind power generation plant in Laurel Mountain Belington to supply more than 260GWh of renewable energy annually. To achieve the grid reliability, AES installed a 64MW/8MWh grid energy storage system at the Laurel Mountain facility to provide frequency regulation. The system used Lithium battery technology (ESA, 2011) (AES STORAGE).
becomes more dependent on intermittent renewable generation sources, and meet the private needs of residential and commercial customers (MARCHMENT HILL CONSULTING, 2012). And the DMSP project described in this document is going to install a 2.5MVA/2MW/2MWh battery energy storage system for feeder construction deferral and energy time-shift.
2.2.BESS Economic Benefits
2.2.1. Introduction
The electric power system is the network of electrical components used in electricity generation, transmission and distribution. The purpose of an electric power system is to deliver electricity energy to the customers in the manners of reliability and economy. The reliability of power supply refers to two kinds of aspects: security is the system's ability to withstand sudden disturbances; adequacy is the property of providing customers with continuous service with a voltage and frequency within regulated ranges (STOFT, S, 2002). Improvements in system reliability can be achieved by using better design or components and increasing capacity to incorporate redundancy (PRADA, J.F., 1999).
The economics of the electric power system is another challenge to the power industry. How to achieve good electrical services with less investment is always the topic in the industry. The alternative economic strategies must be gained within the bound of reliability, safety and environment aspects.
2.2.2. BESS for Electric Energy Time-Shift
By National Electricity Law and Rules, the wholesale electricity market exists as a spot market where competing generators offer their electricity output to retailers. The retailers then sell the gas and electricity and take it to end consumers through retail market. The Australian Energy Market Operator (AEMO) is the national electricity market and system operator in southern and eastern Australia. AMEO decides 5min period dispatch price according to the generators’ bids. Then six dispatch prices are averaged which determines the spot price at each half-hourly trading interval for each region. In brief, the spot price reflects the balance between the electricity demand and supply. The spot market prices spikes happen due to unexpected generation or transmission outages (EEX.GOV.AU). The electricity spot price can vary through days and seasons. The price difference presents a potential financial incentive to store electric energy when the price is relatively cheap and then sold them for higher price in the future.
With the electricity spot price difference, an energy storage system (ESS) can be connected to the grid to attend electricity market operations and achieve energy time-shift benefits. ESS can shift the energy from the low price time to the high price time through the controlled energy storage charge/discharge processes (EYER, J. and Corey, G., 2010).
There are different forms of energy storage system can be used for energy time shift application. Battery energy storage system (BESS) as one of the mature and flexible ESS can be used in power system applications ranging from providing high power to high energy output (ZHANG, S. et al., 2013). One of the advantages of BESS is its controllable energy storage and energy releasing with high ramp rate (THIEN, T. et al., 2015). Using battery based ESS systems in energy time-shift applications, electric energy can be charged/discharged by control scheme with relatively high response speed. BESS’s controllability and flexibility makes it suitable for this type of application. BESS system control scheme and benefit evaluation will be further discussed in section 4 & 5.
P.T. and Garche, J., 2014). In previous researches (ABDELRAZEK, S. and Kamalasadan, S., 2014) (PARRA, D. et al., 2015), it has been found out that one BESS system can be functional in combined applications. For the BESS system, electric energy time-shift application is well compatible with other applications such as increasing electric supply capacities, voltage supporting, transmission congestion relief and transmission/distribution construction deferral (EYER, J. and Corey, G., 2010). In this research, feeder construction deferral is the one combined with electric energy time-shift application.
2.2.3. Feeder Construction Deferral
Feeder construction deferral is one of the most attractive applications for BESS system because it might bring very high economic benefit. When feeders have shortage capacities compared with the peak demand level, the general solutions in electrical industry are either using diesel generator to provide more supplies or upgrade the feeder equipment (MOSELEY, P.T. and Garche, J., 2014). But both solutions are expensive especially for the equipment upgrade option. The large investments for electrical equipment and constructions make economic opportunities for using energy storage system to avoid the feeder upgrade.
advantages. As the energy storage installed for feeder construction deferral, BESS doesn’t need to be retired when the load level has reached a certain level and the feeder has to be upgraded. Because it is viable to multiple applications, BESS system can be re-applied for other applications. It also can be re-constructed to another feeder required deferment because of current modular design and ease of construction.
Some studies and researches have been devoted to the T&D construction deferral applications. One very important aspect of researches is to identify the size and location of the energy storage system. An elimination algorithm was analysed and presented to optimally defer T&D expansion even though in that research the algorithm was used to identify distribution generators in paper (BROWN, R.E. et al., 2001). A model for identify the size and power of the energy storage system is presented in paper (NOURAI, A et al., 2008).The purpose of this model aims to maximize the economic benefits of the energy storage used for T&D construction deferral. Other important aspects of researches are to value the economic benefits of installing energy storage system for T&D construction deferral and to create a suitable control schemes. Both aspects will be discussed in section 4 & 5.
2.2.4. BESS Economic Beneficial Analysis
There are many papers and researches have addresses the economic beneficial analysis of BESS applications. A lot of researches are emphasised on the economic benefit analysis of BESS systems coordination with renewable energy (Shaahid, 2013) (Hoppmann, et al., 2014) (Bortolini, et al., 2014). In (Han, et al., 2015) paper, it evaluated the economic beneficial of BESS system for load shifting application by different types of batteries. In paper (EYER, J. and Corey, G., 2010), it gave a general guide lines of economic benefit analyses for seventeen popular energy storage applications. There is another research (ZHANG, T., 2013) studied economic benefits derived from BESS applications: energy purchase Shifting and distribution feeder deferral and outage avoidance. The research used theoretical modelling of the BESS and distribution system to analyse the benefit.
the logic of defining charge/discharge storage in order to optimize the financial benefit. In the paper, it also three data items were key-parameters in dispatch algorithm: market price, energy storage round-trip efficiency and storage system discharge duration. Another research (BOLADO, J.F. et al., 2014) simply examined a liner programming model to identify the arbitrage potential. However, as indicated by (DUSONCHET, L. et al., 2012), at the current costs of storage technologies and at the current electricity tariffs, the use of battery systems for electric energy time-shift applications is not economically advantageous. To change this situation, it needs the aggregation of different benefits for the same BESS system such as deferral of investment in T&D network upgrades.
For BESS system economic benefits for feeder construction deferral is largely depended on the pressure level of feeder upgrading, the construction cost and the type and size of storage system installed. In the previous researches (EYER, J. and Corey, G., 2010) (ZHANG, T., 2013), present worth model was used commonly for estimated the benefits for T&D construction deferrals. In the paper it presented a one-year deferral method for estimating avoided transmission and distribution costs and explored the non-integer deferral time in the present worth method.
There are another important aspect should be covered in benefit estimation which is the cost estimation. The cost estimation should include the capital cost and operation cost estimation. The report (SCHOENUNG, S., 2011) covered a comprehensive understanding for the cost estimation concepts and provided estimation models.
In (Dufo-López & Bernal-Agustín, 2015) research paper, it presents a methodology to evaluate the technical and economic performance of a grid-connected battery system. The data modelling and system simulation was achieved under a time-of-use (TOU) electricity tariff in the Europe electrical supply system. Another research by (Ma, et al., 2014) examined and compared two energy storage technologies: battery energy storage system (BESS) vs. pumped hydro storage (PHS), for the renewable energy powered microgrid power supply system in Asia. It concluded that PHS was the feasible option for the area. In (Fares & Webber 2014) research developed the BESS behavioural-circuit model and simulated the model in US electrical power supply environment.
indications for further BESS projects about the system size, battery type and project location.
2.2.5. BESS Charge/Discharge Strategies
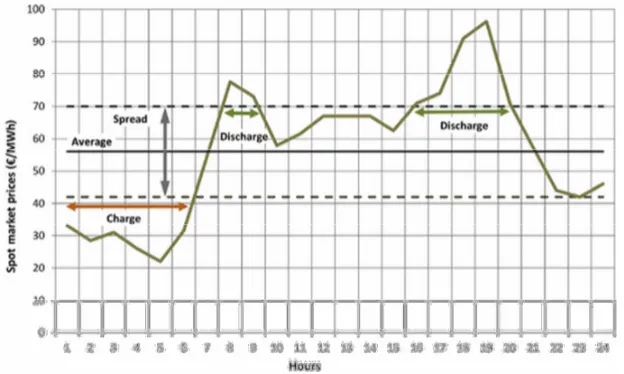
[image:32.612.149.461.180.367.2]To achieve maximum benefits from a BESS system, BESS control scheme needs to be designed optimal according to the distribution network characteristics, BESS system size and type, and to which specified BESS application. The control scheme is the unit which can ensure BESS system operates battery charging/discharging process economically.
Figure 2-2: A simple electric energy time-shift strategy (MOSELEY, P.T. and Garche, J., 2014)
Many papers have revealed the previous researches of BESS control approaches for electric energy time shift application. Figure 2-1 shows a simple application which uses the straightforward strategy. BESS system was charged / discharged by the set values of spot market price (MOSELEY, P.T. and Garche, J., 2014). In another paper, a similar linear optimization algorithm was used based on the mean price of day-ahead market to determine the best operating strategy (BOLADO, J.F. et al., 2014). But in many cases, electric market price changes through the year. It depends on the balance of consume demands and electric generate abilities. In the paper of (ZHANG, S. et al., 2013), the research for an optimal control strategy was presented where few typical control algorithms were setup for their BESS system control. The spot market pattern was studied and analysed which resulted into four control scheme of typical summer, winter, weekday and weekend.
charge/discharge points. On the other hand, for feeder construction deferral application, it is the load demand used for control scheme database.
The BESS control algorithm is a popular research topic. The paper (Haddadian, et al., 2015) proposed a methodology for day-ahead energy resource scheduling and the coordination between distributed battery storage and thermal generating units. The proposed model can be expanded to large-scale systems with additional constraints. In (Ray et al. 2014) research, an operation algorithm was proposed to optimize the operation of the BESS to maximize operating profit. This optimized operation method would make the BESS more economically feasible to power system operators, and lead to smoother integration of BESS. This research used control set points to control battery charge or discharge. Another research show in the paper (CIADEA, S.M. et al., 2013), introduced a mathematic method to optimize the BESS control scheme, called backward dynamic program algorithm. The research used this algorithm applied on the electric market price data to find out BESS operating path at its highest economic potentials.
3.
DMSP PROJECT - STUDY OF BESS APPLICATION
IN DISTRIBUTION SYSTEM
3.1.Introduction
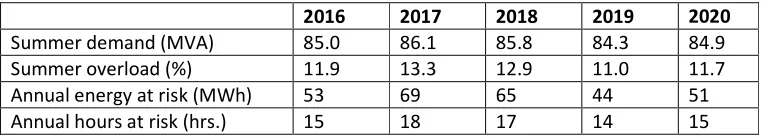
[image:34.612.116.501.416.485.2]DMSP is the project setup by the utility company for improving the reliability and economic of distribution services by connecting a battery energy storage system (BESS) into the distribution system. The zone substation of this distribution system is one of the heaviest loaded substations in the utility that supplies the domestic and commercial area in Victoria rural area. Currently, the zone substation is comprised of two 20/27/33MVA and one 25/33 MVA transformers operating at 66/22 kV. The estimation has been processed for the zone substation of its magnitude and impact of loss of load by considering the energy at risk and the annual hours at risk. The result, which is shown in the table 3.1, indicates that the maximum demand is going to exceed highly of its capacity in the summer time and this zone substation would not be able to supply all its customers during high load periods following the loss of a transformer at substation.
Table 3.1: Estimated energy at risk for the studied zone substation (POWERCOR, 2014)
2016 2017 2018 2019 2020
Summer demand (MVA) 85.0 86.1 85.8 84.3 84.9
Summer overload (%) 11.9 13.3 12.9 11.0 11.7
Annual energy at risk (MWh) 53 69 65 44 51
Annual hours at risk (hrs.) 15 18 17 14 15
3.2.DMSP System Components and Specification
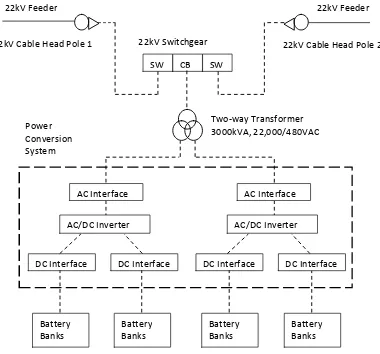
[image:35.612.132.512.181.535.2]The DMSP system contains five main components: switchgear, transformer, power conversion system, battery system and battery management system. A general connection diagram is shown in figure 3-1.
Figure 3-1: DMSP System Connection Diagram
3.2.1. 22kV Switchgear
In DMSP BESS system, the 22kV switchgear is selected to provide the interface between BESS system and the distribution network. The switchgear contains two motorized disconnect switches and one circuit breaker which is used to control, protect and isolate BESS system. It can
de-Battery Banks AC Interface
AC/DC Inverter
DC Interface DC Interface
AC Interface
AC/DC Inverter
DC Interface DC Interface Two-way Transformer 3000kVA, 22,000/480VAC
Battery Banks
Battery Banks
Battery Banks
SW CB SW
22kV Feeder 22kV Feeder
22kV Cable Head Pole 2 22kV Cable Head Pole 1 22kV Switchgear
energize DMSP system manually or automatically during the maintenance or fault conditions. The protection relay installed in the switchgear will protect and monitor DMSP system. Table 3.2 lists the general information for the 22kV switchgear used in DMSP project.
Table 3.2: DMSP 22kV Switchgear Specifications Number of ways 3 (2 x SW, 1 x CB)
IP rating IP54
Nominal operating voltage 22kV
Frequency 50Hz
Rated short time current withstanding rating
20kA, 1sec
Rated internal arcing resistance withstanding
20kA, 1sec
Bus rating(@40C) 630AAC
IP rating (overall) IP54 IP rating (cable compartment) IP2XC Spring charging voltage 125VDC
3.2.2. Transformer
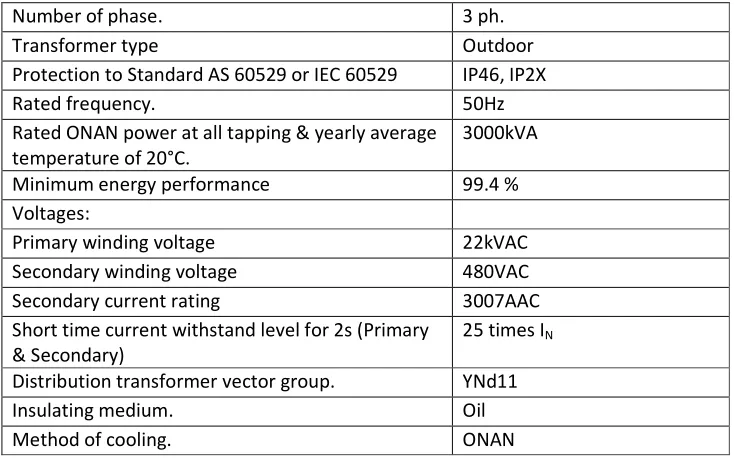
[image:37.612.123.490.272.501.2]The main power transformer of DMSP system is a two-way transformer. It will decrease the network voltage level to DMSP system operation voltage level when battery is charging or increase DMSP system operation voltage to the network voltage level when battery is discharging. The transformer is connected to the circuit breaker of the 22kV switchgear and the AC interface of power conversion system. Table 3.3 lists the general information of transformer used in DMSP project.
Table 3.3: DMSP Step-up/Step-down Transformer Specifications (manufacture data)
Number of phase. 3 ph.
Transformer type Outdoor
Protection to Standard AS 60529 or IEC 60529 IP46, IP2X
Rated frequency. 50Hz
Rated ONAN power at all tapping & yearly average temperature of 20°C.
3000kVA
Minimum energy performance 99.4 %
Voltages:
Primary winding voltage 22kVAC
Secondary winding voltage 480VAC
Secondary current rating 3007AAC
Short time current withstand level for 2s (Primary & Secondary)
25 times IN
Distribution transformer vector group. YNd11
Insulating medium. Oil
3.2.3. Power Conversion System
In the DMSP system, an AC/DC bidirectional inverter is required to store or release energies to the distribution network. The inverter is controlled by the power conversion system. DMSP system uses battery banks as the storage medium. The power conversion system connects to the chargeable batteries through the DC interfaces. When the network has more productive exceeded the demand, the inverter is acting as a charger to store the electrical energy to battery banks. When the network needs the power support, it is acting as a voltage generator to release the energy to grid. Table 3.4 lists the general information of power conversion system.
Table 3.4 DMSP Power Conversion System Specification (manufacture data)
Nominal VA rating +/ - 1250kVA
Nominal power rating -2MW (charge) to 2MW (discharge)
Nominal connection voltage 480VAC ± 10% DC Input voltage range 640VDC to 800VDC Nominal AC current rating 3007AAC
DC current range (each of 2 sets)
-1145ADC (Charge) to 1150 ADC (Discharge)
AC frequency range 48.5Hz to 51Hz
Response speed < 16ms
Control accuracy Maximum error = ±1% of the
Power or VAR set point value
Harmonics Designed to meet IEEE 519
3.2.4. Battery System
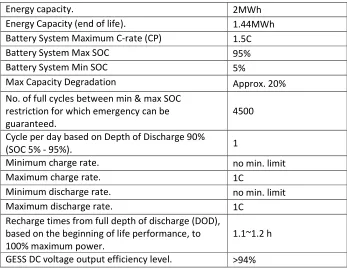
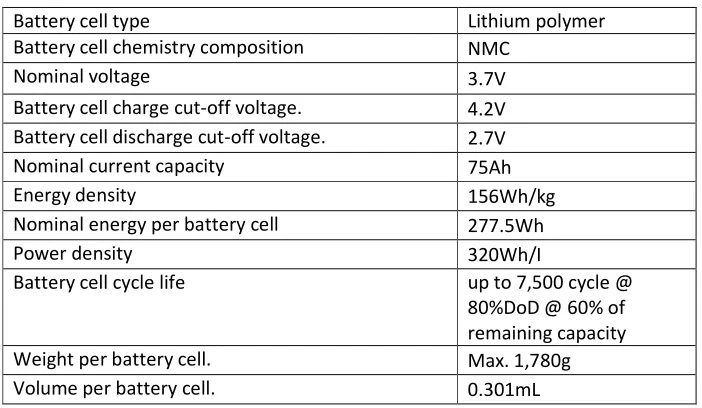
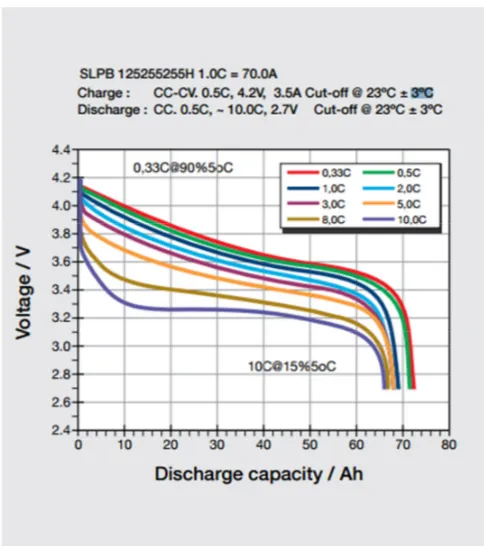
[image:39.612.132.479.286.554.2]DMSP project chooses Lithium polymer battery as the storage medium. Lithium polymer battery has the characters of high power and high energy density with good power to energy balance and long cycle life which make it suitable for large scale energy storage applications. This type of battery presents advantages in system safety with its low weight, low impedance and heat generation. It also shows economic potentials with the high efficiency in battery charge/discharge processes. The following table 3.5 3.6 3.7 3.8 and figure 3-2 show the general information of the DMSP battery system.
Table 3.5: Battery System Specification (manufacture data)
Energy capacity. 2MWh
Energy Capacity (end of life). 1.44MWh
Battery System Maximum C-rate (CP) 1.5C
Battery System Max SOC 95%
Battery System Min SOC 5%
Max Capacity Degradation Approx. 20%
No. of full cycles between min & max SOC restriction for which emergency can be guaranteed.
4500
Cycle per day based on Depth of Discharge 90%
(SOC 5% - 95%). 1
Minimum charge rate. no min. limit
Maximum charge rate. 1C
Minimum discharge rate. no min. limit
Maximum discharge rate. 1C
Recharge times from full depth of discharge (DOD), based on the beginning of life performance, to 100% maximum power.
1.1~1.2 h
Table 3.6: Battery System Power Delivery Capacity (Manufacture data)
2-hours period. 1,046kW
3-hours period. 701kW
4-hours period. 527kW
5-hours period. 416kW
6-hours period. 347kW
Table 3.7: Battery System Maximum Long Term Recharge Power (Manufacture data)
[image:40.612.131.482.414.618.2]20% depth of discharge (DOD) 2,200kW 50% depth of discharge (DOD) 2,200kW 90% depth of discharge (DOD) 2,200kW
Table 3.8: Battery Cell Specification (manufacture data)
Battery cell type Lithium polymer
Battery cell chemistry composition NMC
Nominal voltage 3.7V
Battery cell charge cut-off voltage. 4.2V Battery cell discharge cut-off voltage. 2.7V
Nominal current capacity 75Ah
Energy density 156Wh/kg
Nominal energy per battery cell 277.5Wh
Power density 320Wh/I
Battery cell cycle life up to 7,500 cycle @
80%DoD @ 60% of remaining capacity
Weight per battery cell. Max. 1,780g
Figure 3-2: DMSP Lithium polymer battery discharge curve (PERRY, B., 2012)
3.2.5. Battery Management System
3.3.DMSP System Control Mode
3.3.1. Scheduled Mode
One of the DMSP operation modes is scheduled mode. DMSP system has the ability to set battery system charge/discharge schedules by using programmable profiles. The battery management system has the capability to schedule the battery control scheme with the profiles programmed in HMI. Battery management system has the ability to make seven day schedules while each daily can contain eight profiles for charging or discharging.
Each profile contains scheduled timing and amount of power or energy programmed using the local HMI which communicates to control centre through SCADA. The timing is the stating time for battery operations. The level of power or energy tells the battery system how and how many to charge or discharge. Positive power or energy values cause the battery management system to discharge the battery, negative values cause the battery to charge. There are controlling logics and alarm system built in the battery management system to prevent the scheduled profiles overlapping. In addition, a metering device needs to be installed and monitor the power or energy level of the battery system.
The DMSP scheduled mode can be used for energy time-shift application. With the predicated spot market prices, profiles can be setup to charge and discharge batteries in order to gain arbitrage from the difference of energy spot prices.
3.3.2. Peak Shaving Mode
4.
BESS SYSTEM MODELLING
4.1.Introduction
4.2.BESS Economic Analysis Principles
4.2.1. BESS System Cost Modelling
To model the battery energy storage cost model, these parameters are used: • Cost for the battery storage unit, CBS
• Unit cost for the battery storage unit, Unit C_ BS
• Cost for the power conversion system, CPCS
• Unit cost for the power conversion system, Unit_CPCS • Costs for system operation and maintenance,
& &
CBS O− M& CPCS O− M
• The energy rating of BESS system, EBESS • The power rating of BESS system, PBESS • Battery system round-trip efficiency, ηBESS
There are two types of cost for the BESS system capital investment: • Cost for the battery storage unit which is related to the energy
capacity of BESS system.
CBS =Unit_CBS×(EBESS/ηBESS) (1)
• Cost for the power conversion system which is related to the power capacity of BESS system.
CPCS =Unit C_ PCS×PBESS (2)
The total capital cost of BESS system can be calculated by the sum of two types of cost:
C
Capital BS PCS
C = +C (3)
Where there are always cost for system operation and maintenance, so in general the total charges for a BESS system can be described as:
& &
& &
C
Total Capital BS O M PCS O M
BS BS O M PCS PCS O M
C C C C
C C C
− −
− −
= + +
4.2.2. Present Worth Factor
Using economic model to analyse the benefit from BESS applications, the concept of present worth value needs to be introduced. Due to the existing of interest rate and electrical price escalation rate, the value of current electrical investment and benefit is not the same as in the future. To be able to compare the time related benefit values correctly with the current costs in the cash flow, a present value factor needs to be multiplied to the average revenue of the BESS system.
The method of valuing the future revenue to the present value uses several parameters:
• Year, i
• year irevenue, REVi
• The present worth value of year (i)revenue, PVi • The annual discount rate, d
• The annual electrical price escalation rate, e
Assume the discount rate and price escalation rate keeps constantly, then the present value of year (i) revenue can be calculated as below:
1 1 i i i e PV REV d + = × +
(5)
The present value of revenue summary from year (1) to year (n) is shown as below: 1 1 1 1 i n n i i i i e
PV PV REV
d = = + = = × +
∑
∑
(6)Let’s assume the yearly revenue is the constant value, the equation (6) can be written as:
1 1 1 i n i e PV REV d = + = × +
∑
(7)The present value factor can be defined as:
For the BESS system installed, the total benefit through the operation lift time can be calculated by the annual revenue multiplied with the present worth factor.
4.2.3. BESS System Payback Period
One of important aspects of the economic analysis is to find out if the investment can be money-making. For BESS system, the total cost and the present value of system revenue is described. If the revenue is high than the total cost, then the BESS system is profitable. The minimum profits made by BESS system can be presented in equation (9):
min 1 1 C 1 i N Total i e REV d = + × = +
∑
(9)For a BESS system which is making profits, it is also important to find out for how many years the investment can get payback. The payback period can be found out through the following derivations. Equation (9) can be simplified to: min 1 C 1 1 N i Total i REV k e k d = × = + = +
∑
(10)In equation (10), the geometric series can be changed to a simpler format:
1 (1 ) 1 n i n i k k k k = = − −
∑
(11) C (1 ) 1 n Total k kk − = REV
− (12)
Using equation (4) to find out the total cost, the minimum payback period of BESS system can be calculated by Equation (13):
4.3.BESS Application Modelling
4.3.1. Electric Energy Time-Shift Model
The spot market of the electric energy in Australia is operated by AEMO. AEMO conducts the spot market through managing the balances between electric generation and consuming. The balances are achieved by AEMO centrally-coordinated dispatch process which contains following activities (AEMO, 2015):
• Managing the bidding
• Scheduling and dispatch of generators • Determining the spot price
[image:48.612.168.478.319.492.2]• Measuring electricity use • Settling the market
Figure 4-1: Spot Market Supply and Demand Curves
The spot prices differ widely through time to time which reflect the cost of the electricity supply to meet the demand of load. Figure 4-1 shows the market operation between electricity supply and demand. If the price is below point “PRC”, supply will have less volume than the demand. The spot prices will be raised because of the shortage of energy. On the contrast, if the price is above point “PRC”, supply will be greater than the demand. The price will be dropped by over-supplied energy. In both cases, the spot price will be eventually come close to the point “PRC” where the demand and supply are in balance. The spot price, electric capacity and the load demand are correlated. The lower the electricity supply or the higher load demand will cause higher price for electricity.
SUPPLY Spot Price
($/MWh)
Energy (MWh) DEMAND
Figure 4-2: A Typical Spot Price Daily Curve
Figure 4-2 shows a typical spot prices curve. In the figure, spot price changes through the day because of the affects from supply and demand. In the graph, the spot price curve varies from day to night and reaches its peak at 3.30pm to $123.00 per MWh. The spot price can reach to a really high value when the weather is under the extreme condition. There is a market price cap for electricity of $13,500/MWh for the (2014-2015) financial year to prevent market exceeds the maximum generation capacities (AEMO, 2015). This price cap will trigger AEMO to start load shedding to keep supply and demand in the system in balance.
For the energy time-shift application, the economic benefits depend on the incremental incomes made by the difference of low energy purchased price and high energy sold price to the grid. The benefits will be significant if the gap between these two prices is high. The economic benefit model can be described using the following parameters:
• Total energy time-shift economic benefit for a day: _ Time Shift
D REV −
• BESS system energy rating, EBESS
• Spot price for energy discharged at time interval (i) during a day, SPi
• Discharge C-rating, CRi
0 20 40 60 80 100 120 140
0 2 4 6 8 10 12 14 16 18 20 22 24
R
R
P
(
$
/M
W
h
)
• Spot price for energy charged at time interval (j) during a day, SPj
• Charge C-rating, CRj • The round trip efficiency, η
The daily benefit of energy time-shift application can be calculated by equation (14):
(
)
_ CR
CR BESS previous energy level +
Time Shift BESS i i j j
BESS i BESS j
D REV E SP CR SP
E E CR
η η
− = × × − ×
× ≤
∑
∑
∑
∑
(14)Assume that the BESS system has N charge/discharge cycles during a year and the economic benefits are similar to each year. Uses present worth value factor defined in equation (8). The total life time benefit can be calculated by equation (15):
1 _ Where 365
_ /
N
Time Shift Time Shift
year
Time Shift Time Shift BESS
REV PWF D REV
N
Unit REV REV E
− −
=
− −
= ×
≤
=
∑
4.3.2. Feeder Construction Deferral Model
The feeder construction deferral benefit is the financial value associated with using a relatively small amount of storage to defer the feeder upgrade. For a feeder which is rated at 12MVA, Figure 4-2 shows its 15 minute average peak load during a year. The daily peak loads are generally higher during the winter time and some of summer time. But in the spring or autumn season, the load demands are relatively low. The feeder has the highest peak load demand at 12.2MVA which is over the 12MVA feeder rating. But there are only total 60 hours where the loads are over 10MVA during the whole year.
Figure 4-3: A Yearly 3 Phase 15min Average Peak Load Curve
Figure 4-3 shows the maximum load demand curve of a 12MVA feeder of 4% demand growth rate. The demand growth rate varies depending on the lot of criteria such as (EYER, J. and Corey, G., 2010):
• Earlier peak load plus load shape • Expected load growth & uncertainty • Storage module sizes availability • Development in the area
• Weather conditions
The feeder shown in the figure 4-3 will reach its power supply capacity at critical time T1. It means by that time either the feeder capacity needs to be increase or an alternative method needs to be approached. As the load growth rate is 4%, the feeder needs 480kVA increased each year from time T1. If a 2MW BESS system is installed at time T0 and then adds 500kVA incrementally to feeder network each year as shown in the graph, the critical time for the feeder will be delayed to time T2 about 4 years later.
Figure 4-4: Feeder Peak Load Curve Dropped with 2MW BESS Installed
The benefit of installing the BESS system comes from avoiding the investment of the feeder upgrading construction. In general the feeder upgrade size will be in the range of 25%-40% of the total capacity. For example, assume feeder rated at 12MVA will be upgraded extra 3MVA to 15MVA rating which increases 25% feeder capacity. The savings from the construction deferral is the interest rate of the 3MVA investment during the deferral time.
For BESS feeder construction deferral, the one year benefit can be calculated with parameters as following:
• One year construction deferral benefit: REVDeferral • Feeder capacity, SFdr
• Feeder upgrade factor, rFdr_upgrade
• Unit price for feeder upgrade cost, Unit Cost_ Fdr • Feeder length, LFdr
• Load growth factor, rLoad_growth
• Interest rate, d
• Battery round trip efficient,
η
The equation for one year total benefit is shown as below:
8 10 12 14 16 18
0 1 2 3 4 5 6 7 8 9 10 11 12 13 14 15
F e e d e r P e a k L o a d ( M V A ) Time (Year) Max Load Demand
New Max Load Demand with BESS
T1 T2
_ _
Deferral Fdr Fdr Fdr Fdr upgrade
REV =S ×Unit Cost ×L ×r ×d (16)
The optimal BESS storage size used for feeder construction deferral is:
_growth
Deferral Fdr Load
S =S ×r ×η (17)
Unit benefit from the optimal BESS system:
_ Deferral Deferral / Deferral
4.4.Forward Dynamic Programming Approach
4.4.1. Introduction
In this research, a forward dynamic programming algorithm is adopted in order to solve the given problem. Dynamic programming is an optimization method widely used for efficiently solving optimization problems which exhibit the characteristics of overlapping sub problems and optimal substructure.There are two types dynamic programming: forward induction and backward induction (WEB.MIT.EDU). The difference between two types is that forward induction is always to find the best path from certain start point to any other points; backward induction is the opposite to find from certain end point to any other points in the network. For our research, forward dynamic programming is more suitable. The Figure 4-5 shows an example of dynamic programming for finding the least cost path through the network.
Figure 4-5: An Example of Dynamic Programming for the Least Cost Path (graph from internet)
The essential feature of dynamic programming is to find the best option through multiple stages. Through stage by stage, values of the each part of option are re-calculated and recorded. The iteration will keep running until the optimal solution is found.
In the example, if we want to find the shortest path from node 1 to node 6, then the processes are as below (arrow indicates the movement direction):
Stage 1: M(1, 2) = 7, M(1, 3) = 5 M(1, 2) = 7, M(1, 3) = 5 Stage 2: M(1, 2, 3) = 4M(1, 3) = 4
M(1, 2, 4) = 6, M(1, 2, 5) = 3
Stage 4: M(1, 2, 5, 4) = 5, M(1, 2, 5, 6) = 7, M(1, 2, 5, 7) = 5 M(1, 2, 5, 4) = 5, M(1, 2, 5, 7) = 5
Stage 5: M(1, 2, 5, 4, 6) = 8, M(1, 2, 5, 7, 6) = 8, M(1, 2, 5, 6) = 7 So the final solution is 1256 which the cost is 7.
4.4.2. Optimal Battery Charging/Discharging Routine
In order to find the optimal battery storage system charging/discharging routine, first let’s define a network for battery energy status by time. Assume there are m different energy levels at a time point. Em is the maximum value of the battery energy level where E1 is the
minimum value of the battery energy level.
Em Em Em Em Em Em Em Em Em
Em-1 Em-1 Em-1 Em-1 Em-1 Em-1 Em-1 Em-1 Em-1
… … … …
E2 E2 E2 E2 E2 E2 E2 E2 E2
[image:55.612.125.487.308.543.2]E1 E1 E1 E1 E1 E1 E1 E1 E1
Figure 4-6: Battery Storage System Charging/Discharge Routine Network
With the defined network, the initiate problem has become to find an optimal path from time point t1 with the energy level Es to the time point tn
with the energy level Ed; where1≤s≤m;1≤d≤m.
Because time only can move forward continuously, so the battery charging/discharging routine can only move from start point t1 to end point
tn direction one time point per step. For battery storage system, there will be
only three types of procedures during the system operation: battery charging, battery discharging or system standby. Through the time, the movement of the battery storage system status can be described as:
1 1
1 If 1,
at time point - battery charging at time point
at time point - system standby
j C i
j i j i j E t E t E t + + + = → 1 1 1 2 1
If 1 ,
at time point - battery charging at time point at time point - system standby
at time point - battery discharging
j C i
j i j i
j C i
j m
E t
E t E t
E t + + + − + < < → 1 2 1
If ,
at time point - system standby at time point
at time point - battery discharging
j i
j i
j C i
j m E t E t E t + − + = →
C1 and C2 are the battery charge and discharge rates.
The costs or benefits bringing through these procedures are assigned as:
1
1
When battery is charging, cost for energy purchased from time to is
( ) pot_Price + Cost ($/MWh) (19)
When battery is discharging, bene
j i
i j j i op
t t
Mc E E S
+
+
= − ×
1
1
fit from energy trade from time to is
( ) pot_Price - Cost ($/MWh) (20)
If it is system standby,
0 ; 0
j i
i j j i op
i i
t t
Me E E S
Mc Me
+
−
= − ×
≈ ≈ (21)
The total avenue M related to energy purchase shift is:
k l
M =
∑
Me −∑
Mc (19)5.
SYSTEM SIMULATION & RESULTS
5.1.Introduction
5.2.Simulation using HOMER Modelling
The simulations for DMSP energy time-shift and feeder construction deferral applications are achieved by using HOMER Pro microgrid software by HOMER Energy. HOMER (Hybrid Optimization Model for Multiple Energy Resources) is one of the most popular software for optimizing microgrid design. It has the powerful tools for microgrid simulation, optimization and Sensitivity analysis which show the project’s engineering aspects along with its economic aspects (HOMER ENERGY, 2015). But The HOMER has limitation in the simulation of the entire grid. In this research, because whole project is feeder oriented, there are special methods need to be approached to make the software proceeding the correct simulation.
5.2.1. Data Used for HOMER Simulation
The datasets used in the simulation contains two types of data. One type is the spot market information; another type is the load information.
The data of spot market information is required for both simulations of DMSP energy time-shift and feeder construction deferral applications. The data sets used in this research are attained from AEMO free sources. The spot prices are various for the different area, obviously due to the varied local electric generation and load demand conditions. In the research, three typical spot price datasets are chosen to be used in the simulation:
• Case 1: Low active spot market • Case 2: Medium active spot market • Case 3: High active spot market
Table 5.1: Three spot price datasets details
Ave. Price ($/MWh)
Hours When Prices > $100/MWH
Hours When Prices > $200/MWH
Hours When Prices > $1000/MWH
MAX Price ($/MWh)
Case 1 41.62 68.5 23.5 5.5 5972.27
Case 2 48.13 168 58 15 6213.38