R E S E A R C H
Open Access
Socio-economic risk factors for early
childhood underweight in Bangladesh
Tuhinur Rahman Chowdhury
1*, Sayan Chakrabarty
2,3, Muntaha Rakib
1, Sue Saltmarsh
3and Kendrick A. Davis
4Abstract
Background:Underweight is a major cause of global disease burden. It is associated with child mortality and morbidity, and its adverse impact on human performance and child survival is well recognized. Underweight is a major public health problem in Bangladesh, which is amongst the highest underweight prevalent countries in the world. The objectives of our study were to determine the national and regional prevalence rates of underweight and severe underweight in Bangladesh, and to investigate the association of socioeconomic and demographic factors with child underweight and severely underweight among children under the age of five living in Bangladesh.
Methods:We performed a cross sectional study using Multiple Indicators Cluster Survey 2012–13, Bangladesh data on 17,133 children under 5 years of age. Weight-for-age Z scores based upon World Health Organization (WHO) guidelines were used to define child underweight and severe underweight. The association of underweight and severe underweight with household socioeconomic factors and demographic characteristics was investigated using binary logistic regression model.
Results:An estimated 31.67% children were underweight and 8.81% children were severely underweight. Children
of mothers with incomplete secondary education [Odds Ratio (OR) = 0.84, 95% CI: 0.75, 0.94] and mothers with completed secondary education [Odds Ratio (OR) = 0.77, 95% CI: 0.64, 0.93] were less likely to be underweight than children of uneducated mothers who had no formal schooling. A similar association exists for father’s education, children from households in the highest wealth index quintile had lower likelihood of underweight [Odds Ratio (OR) = 0.44, 95% CI: 0.37, 0.53] than children from households in the lowest quintile. Consumption of non-iodized salt had higher risk of severe underweight for children aged between 24 and 35 months [Odds Ratio (OR) = 2.32, 95% CI: 1.80, 3.00]. Other risk factors of child severe underweight included living in Sylhet division and increases in the number of children under the age of five in a household.
Conclusion:Underweight was associated with lower parental education, household position in lower wealth index,
living in Sylhet division and consumption of non-iodized salt. Strategies are discussed considering the relative importance of risk factors for child underweight.
Keywords:Determinants, Underweight, Bangladesh, Child, Early childhood
Background
Developing countries have the greatest prevalence of early childhood malnutrition despite recent rapid eco-nomic development [1–3]. Malnutrition is the prime culprit for early childhood death, causing the deaths of 13 million infants and children under the age of five every year [4]. There is a higher risk of dying among
children who are mild to moderately malnourished com-pared with well-nourished children [5, 6]. The adverse impacts of malnutrition are not limited to school attend-ance rates and academic accomplishments, but also linked to decreases in the development of social skills among children [7, 8]. Malnutrition is associated with poorer academic performance in school-aged children [9] and lower survival capacity for a child in its adult-hood [10].
* Correspondence:tuhinchy.sust@gmail.com
1Department of Economics, Shahjalal University of Science & Technology,
Sylhet Kumargaon, Sylhet 3114, Bangladesh
Full list of author information is available at the end of the article
Malnutrition status is investigated using three an-thropometric parameters: height for age, weight for height and weight for age [11]. Height for age is used to identify stunting1 which represents linear growth failure for a child [12]. Weight for height is used to identify wasting2which indicates an unusually body tissue and fat mass for a child relative to its height or length [13]. Weight for age is the WHO-recommended indicator to determine whether the child is underweight3 or not [11]. As underweight is a composite indicator that encom-passes both stunting and wasting [14] implying that stunt-ing, wasting or both can be reflected by underweight [15], our primary interest is to use weight for age indicator to measure early childhood underweight.
Underweight has become a major public health problem particularly in developing nations, and its destructive impact on human performance and child survival has been well recognized [16]. It is a prime concern as underweight is the leading cause of global disease burden [17]. Underweight is associated with increased risk of contagious disease such as diarrhea and pneumonia [18]. The World Health Organization (WHO) cites underweight as the single largest risk factor in developing countries to the burden of dis-ease, [19] as an estimated 52.5% of all deaths among young children are attributable to underweight [18]. In the countries where child mortality is high, under-weight is accountable for 15% of the total disability adjusted life years losses [17]. Underweight children are 8.4 times more likely to die and children who are suffering from moderate and mildly underweight are 4.6 times and 2.5 times respectively more likely to die before the age of five compared to children who are well-nourished [5].
In 2011, 101 million children globally were estimated as underweight indicating the prevalence rate of underweight as 16% [20]. The situation is worse in Bangladesh, where underweight prevalence rate was reported to be 41% [21]. There are many socioeconomic and biological factors that are associated with child underweight. Biological factors include lower birth weight [22], having an underweight mother or father, and having a mother or father of short stature. Among the socioeconomic factors, children with mothers who don’t have any formal education are at greater risk of being underweight [23].
Even though Bangladesh has one of the highest preva-lence of underweight in the world, few studies have identified the socioeconomic factors responsible for child underweight [24–30]. Most of the studies con-ducted in Bangladesh suggested that maternal education is a strong and significant predictor for child under-weight [24,28,29,31,32]. A recent study by Devkota et al. [28] established a positive association of WAZ (weight-for-age z score) with the level of maternal
education. Mohsena et al. [24] explored the Bangladesh Demographic and Health Survey (2004) Data and found that higher levels of maternal education are associated with lower risk of underweight. In Bangladesh, paternal education was also found to be an independent deter-minant of child underweight by few studies [27,33]. Ac-cording to Das et al. [33], children of illiterate fathers had a 30% higher likelihood of being underweight than the children of fathers who had completed pri-mary school. Another study that finds a positive asso-ciation between paternal education and risk of child underweight [26].
Socioeconomic status like poverty is also a signifi-cant predictor of child underweight. Children coming from poor families are more likely to be underweight compared with children coming from wealthier fam-ilies [4]. Despite the fact that Bangladesh has man-aged to achieve an enormous economic growth in the last 20 years along with massive improvements in educational achievement, still a large proportion of its population, nearly 43.3%, are living under the poverty line of 1.25 dollar per day [28]. Having such a large proportion of the population living in poverty, hence unable to afford nutritious food or access improved health care facilities, makes the task of reducing the coun-try’s prevalence of underweight children extremely difficult. Indeed, a number of studies conducted in Bangladesh sug-gested household socioeconomic status as a significant de-terminant of child underweight, reporting that children from relatively higher socioeconomic condition had lower likelihood of being underweight [28, 33]. A study in Bangladesh carried out by Alom et al. [29] reported that children who came from the richest wealth index had 44% lower odds of being underweight compared with children from the poorest wealth index.
of underweight and severe underweight and their associ-ated risk factors in Bangladesh.
Method Data sources
The analysis was based on the Bangladesh Multiple Indi-cators Cluster Survey (MICS) 2012–13 data conducted by Bangladesh Bureau of Statistics along with UNICEF who provided technical and financial support. Data were collected from December 2012 to April 2013. The major objectives of the survey were to collect the most recent data on women and child health, household socioeco-nomic status, access to mass media, ICT improved sani-tation and pure water, child nutrition, mortality and child development. The sample was selected using two-staged stratified cluster sampling approach. In the time period during which data were collected, there were seven divisions and 64 districts in Bangladesh and districts were defined as sampling strata [34]. The pro-portion of women with 4+ ANC visits, where the term ANC stands for antenatal care visit, was used as key in-dicator in estimating the size of sample. The sample size was determined using the following formula n=
½4ðrÞð1−rÞðdeffÞ
½e2ðpbÞðAve SizeÞðRRÞ, where 4 = factor for achieving 95%
con-fidence level; r= projected value of the indicator, which was assumed to be 26% and expressed as a proportion; n= sample size; deff = design effect for the indicator, and the value of deff was estimated to be 1.4 based on previ-ous surveys; Ave Size = average hprevi-ousehold size, and it was assumed as 4.5; pb refers to the percentage of women in the total population, who gave birth in the last 2 years, and it was taken to be 4%; RR = anticipated re-sponse rate which was assumed to be 95% based on the previous survey experience [35]. In estimating r, max-imum margin of error was allowed of ±8 to 9%, and thereby a sample size of 800 was decided for each dis-trict. For obtaining a more precise estimation result, 1000 samples were drawn from each of the 20 UNDAF districts. UNDAF (United Nation Development Assist-ance Framework) districts are those 20 districts that have been declared as prioritized districts by Bangladesh government. Twenty households per cluster were se-lected for the survey, taking in consideration various fac-tors such as time, budget, design effect etc. Twenty households per cluster suggest that for drawing 1000 households as sample, 50 clusters would be needed in each of the 20 UNDAF districts, and 40 cluster would be needed for drawing 800 households as sample size in each of the remaining 44 non UNDAF districts. In this way, the resulting sample size would be 55,200. But 4 clusters were not visited due to unfavorable weather and, therefore, data was collected from 55,120 house-holds. Clusters were selected using 2011 census frame.
The first stage of sampling involved determining census enumeration areas required within each district, which were defined as primary sampling units. From 30 No-vember, 2012 to 6 December, 2012, field operations were carried out in each enumeration area to make new list-ings of households; primarily because the 2011 census frame was not up-to-date. Experienced staff of the Bangladesh Bureau of Statistics (BBS) prepared the list of households in the field, and at the BBS headquarter, the listed households were numbered sequentially from 1 to n within each enumeration area. Here, Random Sys-tematic Sample Selection Procedure was used to select 20 households in each enumeration area. Households in-cluded 23,402 children below 5 years of age and infor-mation on 20,903 under five children was collected, indicating a response rate of 89.3%. For the purpose of data collection, structured questionnaires were used. The questionnaires had four sections comprised of ques-tions pertaining to household, women (age 15–49), chil-dren under five and water quality testing. Thirty-two data collection teams collected data, with each team hav-ing seven members includhav-ing a supervisor and inter-viewers. The teams were provided with training for 14 days prior to collecting data. Recommended an-thropometric tools were used to measure child weight and height [34]. Collected data from the field were en-tered using CSPro software and all questionnaires were entered twice to ensure the quality of data [35].
Statistical analysis
child took vitamins yesterday (yes/no) and number of children in a household below the age of five. Wealth index score was computed by principal component ana-lysis based on household assets and materials used to build house [35]. All households were then categorized into five categories depending on wealth score such as poorest, second, middle, fourth and richest. Toilet facil-ity variable was created with four categories as flush la-trine, pit lala-trine, hanging latrine and others. Descriptive statistics were created for all predictors as well as for re-sponse variable. As our dependent variable was dichot-omous, underweight versus not underweight and severely underweight versus not severely underweight, predictors for the risk of child underweight and severely underweight were investigated using binary logistic re-gression model. Statistical significance was set atp< 0.05 and adjusted odds ratio was reported along with 95% confidence interval.
Results
Socioeconomic and demographic characteristics of the study population
The final analysis of 17,133 children estimated that 31.67% of these children were underweight including 8.81% as se-verely underweight. Table 1 demonstrated socioeconomic and demographic characteristics of the study population.
The male to female ratio of children was 1069:1000. More than four-fifths of children came from rural area and around two-thirds of the surveyed children belonged to the households with four to six family members. More than one-fifth of the children were between the ages of 12 and 23 months, and approximately 11% of children were aged less than 5 months. The highest (25.36%) proportion of children lived in Dhaka division with the lowest from Sylhet division (8.21%). More than one-third of fathers did not go to school and likewise one-fourth of mothers did not have any formal educa-tion. Only 11.37% of mothers and 15.38% of fathers completed secondary education. Nearly, one third of the study children belonged to households of the poorest wealth quintile (29.06%) and only 13.87% children belonged to richest wealth quintile. On the previous day, approximately 86% children drank plain water 24% drank milk and 9.06% ate or drank vitamins. More than half of the households have iodized salt (51.43%). The majority of households had access to pit latrine (62.34%) and almost one-third of households had access to flush latrines.
Risk factors for underweight
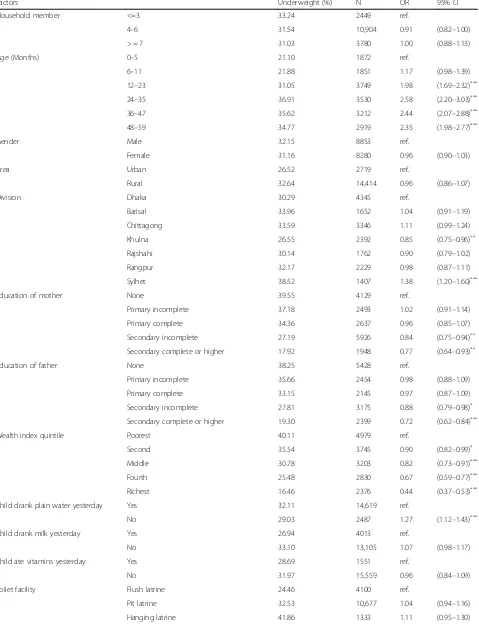
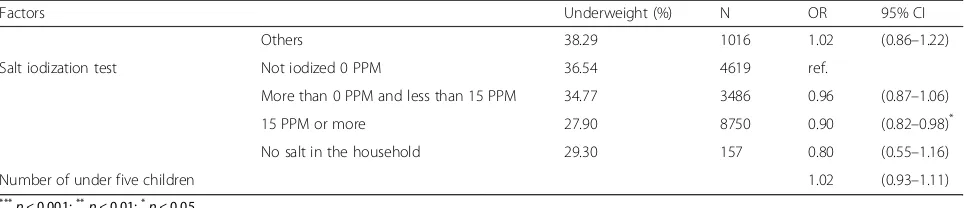
Table2lists the socioeconomic and demographic factors along with their association and the magnitude of im-pact on the risk for underweight among children below 5 years old using binary logistic regression analysis.
The analysis determined the following factors to be as-sociated with the risk of underweight: age of children, division, education level of mother and education level of father, wealth index, whether the child drank plain water yesterday and finally the use of iodized salt by households. Children living in Khulna division were 15% less likely to be underweight [Odds Ratio (OR) = 0.85, 95% CI: 0.75, 0.96] compared with the children living in Dhaka division. Children from Sylhet division were more prone to the risk of underweight than any other division in Bangladesh with higher odds on underweight [Odds Ratio (OR) = 1.38, 95% CI: 1.20, 1.60] than the children from Dhaka division. Our results suggested child’s age as one of the major determinants of underweight. Children aged 12–23 months [Odds Ratio (OR) = 1.98, 95% CI: 1.69, 2.32] had around two-fold odds on underweight compared with children below 5 months of age. The risk for underweight was highest among the children who were in their early middle childhood. Children aged 24– 35 months [Odds Ratio (OR) = 2.58, 95% CI: 2.20, 3.03] had over two-fold risk on underweight relative to the children less than 5 months of age. Children between the ages of 36–47 months [Odds Ratio (OR) = 2.44, 95% CI: 2.07, 2.88] and children between the ages of 48– 59 months [Odds Ratio (OR) = 2.35, 95% CI: 1.98, 2.77] were more likely to be underweight compared with the children who were below 5 months of age. Children of secondary incomplete mothers had 16% smaller odds on underweight [Odds Ratio (OR) = 0.84, 95% CI: 0.75, 0.94] than the children of mothers with no formal edu-cation. There were 23% lower odds on underweight among children whose mothers completed secondary education [Odds Ratio (OR) = 0.77, 95% CI; 0.64, 0.93] than the children whose mothers had not attended school at all. As with mother’s education, an increase in the level of father’s education reduced the odds on child underweight. Children with father’s education secondary incomplete and secondary complete had 12% [Odds Ra-tio (OR) = 0.88, 95% CI: 0.79, 0.98] and 28% [Odds RaRa-tio (OR) = 0.72, 95% CI: 0.62, 0.84] lower odds on under-weight respectively in comparison with children whose fathers had no formal education. Children who didn’t drink plain water yesterday were 1.27 times more likely to be underweight [Odds Ratio (OR) = 1.27, 955 CI: 1.12, 1.43] compared with children who drank water the pre-vious day.
95% CI: 0.37, 0.53] among the children who came from richest households than the children who came from poorest households. Children living in households where salt was found as adequately iodized (15 ppm or more) had a lower likelihood of underweight [Odds Ratio (OR) = 0.90, 95% CI: 0.82, 0.98] compared with children from those households where salt was found to be not iodized in salt iodization tests. Our study did not establish a re-lationship between child gender and underweight, nor did it establish that children from rural areas were more likely to be underweight compared with children from urban areas.
Risk factors for severe underweight
[image:5.595.142.531.107.733.2] [image:5.595.296.538.110.491.2]Table 3 lists the results of the binary logistic regression analysis on the risk for child severe underweight associ-ated with different socioeconomic and demographic factors.
Table 1Socioeconomic and demographic characteristics of the study population
Total sample
(n= 17133)
Characteristics Proportion (%)
Household member
<=3 14.29
4–6 63.64
> = 7 22.06
Age (months)
0–5 10.93
6–11 10.80
12–23 21.88
24–35 20.60
36–47 18.75
48–59 17.04
Gender
Male 51.67
Female 48.33
Area
Urban 15.87
Rural 84.13
Division
Dhaka 25.36
Barisal 9.64
Chittagong 19.53
Khulna 13.96
Rajshahi 10.28
Rangpur 13.01
Sylhet 8.21
Education of mother
None 24.10
Primary incomplete 14.55
Primary complete 15.39
Secondary incomplete 34.59
Secondary complete or higher 11.37
Education of father
None 34.79
Primary incomplete 15.73
Primary complete 13.75
Secondary incomplete 20.35
Secondary complete or higher 15.38
Wealth index quintile
Poorest 29.06
Second 21.86
[image:5.595.57.286.113.730.2]Middle 18.69
Table 1Socioeconomic and demographic characteristics of the study population(Continued)
Total sample
(n= 17133)
Characteristics Proportion (%)
Fourth 16.52
Richest 13.87
Child drank plain water yesterday
Yes 85.46
No 14.54
Child drank milk yesterday
Yes 23.44
No 76.56
Child ate vitamins yesterday
Yes 9.06
No 90.94
Toilet facility
Flush latrine 23.94
Pit latrine 62.34
Hanging latrine 7.78
Others 5.93
Salt idolization test
Not iodized 0 PPM 27.15
More than 0 PPM and less than 15 PPM 20.49
15 PPM or more 51.43
No salt in the household 0.92
Child underweight status
Underweight 31.67
Table 2Risk factors for total underweight in children aged less than 5 years
Factors Underweight (%) N OR 95% CI
Household member <=3 33.24 2449 ref.
4–6 31.54 10,904 0.91 (0.82–1.00)
> = 7 31.03 3780 1.00 (0.88–1.13)
Age (Months) 0–5 21.10 1872 ref.
6–11 21.88 1851 1.17 (0.98–1.39)
12–23 31.05 3749 1.98 (1.69–2.32)***
24–35 36.91 3530 2.58 (2.20–3.03)***
36–47 35.62 3212 2.44 (2.07–2.88)***
48–59 34.77 2919 2.35 (1.98–2.77)***
Gender Male 32.15 8853 ref.
Female 31.16 8280 0.96 (0.90–1.03)
Area Urban 26.52 2719 ref.
Rural 32.64 14,414 0.96 (0.86–1.07)
Division Dhaka 30.29 4345 ref.
Barisal 33.96 1652 1.04 (0.91–1.19)
Chittagong 33.59 3346 1.11 (0.99–1.24)
Khulna 26.55 2392 0.85 (0.75–0.96)**
Rajshahi 30.14 1762 0.90 (0.79–1.02)
Rangpur 32.17 2229 0.98 (0.87–1.11)
Sylhet 38.52 1407 1.38 (1.20–1.60)***
Education of mother None 39.55 4129 ref.
Primary incomplete 37.18 2493 1.02 (0.91–1.14)
Primary complete 34.36 2637 0.96 (0.85–1.07)
Secondary incomplete 27.19 5926 0.84 (0.75–0.94)**
Secondary complete or higher 17.92 1948 0.77 (0.64–0.93)**
Education of father None 38.25 5428 ref.
Primary incomplete 35.66 2454 0.98 (0.88–1.09)
Primary complete 33.15 2145 0.97 (0.87–1.09)
Secondary incomplete 27.81 3175 0.88 (0.79–0.98)*
Secondary complete or higher 19.30 2399 0.72 (0.62–0.84)***
Wealth index quintile Poorest 40.11 4979 ref.
Second 35.54 3745 0.90 (0.82–0.99)*
Middle 30.78 3203 0.82 (0.73–0.91)***
Fourth 25.48 2830 0.67 (0.59–0.77)***
Richest 16.46 2376 0.44 (0.37–0.53)***
Child drank plain water yesterday Yes 32.11 14,619 ref.
No 29.03 2487 1.27 (1.12–1.43)***
Child drank milk yesterday Yes 26.94 4013 ref.
No 33.10 13,105 1.07 (0.98–1.17)
Child ate vitamins yesterday Yes 28.69 1551 ref.
No 31.97 15,559 0.96 (0.84–1.09)
Toilet facility Flush latrine 24.46 4100 ref.
Pit latrine 32.53 10,677 1.04 (0.94–1.16)
Age of children was associated with the risk for child severe underweight with children aged 12–23 months having almost twice the odds on severe underweight [Odds Ratio (OR) = 1.81, 95% CI: 1.40, 2.34] than the children aged less than 5 months. Children aged 24– 25 months had the highest risk for being severely under-weight. Compared with children aged below 5 months, children aged 24–35 months [Odds Ratio (OR) = 2.32, 95% CI: 1.80, 3.00] had a more than two-fold risk of se-vere underweight. Furthermore, children between the ages of 48–59 months had also larger odds of severe underweight [Odds Ratio (OR) = 1.48, 95% CI: 1.12, 1.95] compared with their under-five counterparts. Chil-dren from the poorest households were at higher risk for being severely underweight. Children from households belonging to the middle category in wealth index had 20% lower likelihood of underweight [Odds Ratio (OR) = 0.80, 95% CI: 0.67, 0.96] and children from households that belonged to fourth category in the wealth index had 49% lower odds of underweight [Odds Ratio (OR) = 0.51, 95% CI: 0.40, 0.64] compared with the children from the poorest households. In comparison with the children from the poorest households, children from the wealthi-est households had 68% lower odds of severe under-weight [Odds Ratio (OR) = 0.32, 95% CI: 0.23, 0.46]. There were 32% lower odds on severe underweight among children living in the Khulna division [Odds Ra-tio (OR) = 0.68, 95% CI: 0.55, 0.85] and 34% higher odds on severe underweight among children living in the Syl-het division [Odds Ratio (OR) = 1.34, 95% CI: 1.09, 1.66] compared with children living in the Dhaka division. Im-proved mother’s education and father’s education levels were shown to be important protective factors against child severe underweight. Children with mothers’ pri-mary education complete [Odds Ratio (OR) = 0.79, 95% CI: 0.66, 0.95] and secondary incomplete [Odds Ratio (OR) = 0.78, 95% CI: 0.65, 0.92] were less likely to be se-verely underweight compared with children whose mothers had no formal education. Children of mothers who had completed secondary education had 31% lower odds [Odds Ratio (OR) = 0.69, 95% CI: 0.49, 0.97] of being severely underweight compared with children whose mothers had not completed secondary education. Children
had 21% lower odds of being severely underweight when their fathers had enrolled in secondary education compare to children whose fathers had no formal education [Odds Ratio (OR) = 0.79, 95% CI: 0.65, 0.95]. There were 34% lower odds of severely underweight among children with fathers who had completed secondary education [Odds Ra-tio (OR) = 0.66, 95% CI: 0.50, 0.88] compared with children whose fathers had no formal education. An increase in the number of children under the age of five in households by 1 was associated with 17% higher odds on severe under-weight [Odds Ratio (OR) = 1.17, 95% CI: 1.02, 1.33].
Discussion
Our study estimated 31.67% children below 5 years of age as underweight, with 8.8% children as severely under-weight in 2011–2012 in Bangladesh. The present study findings indicated a concerning nutritional condition among children aged under 5 years, especially those aged 2–3 years. Child underweight and severely underweight were predicted by child’s age, regional division, education level of mother, education level of father, household pos-ition in wealth index, whether child drank plain water yes-terday, and the presence of iodized salt in households.
[image:7.595.57.539.99.203.2]Our study reveals maternal education as an important determinant of child underweight. According to our study findings, higher levels of maternal education are associated with lower odds of child underweight, which was supported by previous studies [24,36,37]. Likewise, maternal education was estimated to be an independent predictor of children being severely underweight. Chil-dren of secondary completed mothers had 31% lower odds of being severely underweight compared with chil-dren of uneducated mothers. Similar findings have been observed in earlier studies carried out in Bangladesh, which have shown that children of uneducated mothers were significantly more likely to be severely underweight than children whose mothers had a relatively higher level of education [25,38–43]. There are some plausible explanations as to why higher maternal education re-duces the chance of underweight and severely under-weight among children under the age of five. First, education improves information processing capacity by the mother [44, 45]. For instance, an educated mother
Table 2Risk factors for total underweight in children aged less than 5 years(Continued)
Factors Underweight (%) N OR 95% CI
Others 38.29 1016 1.02 (0.86–1.22)
Salt iodization test Not iodized 0 PPM 36.54 4619 ref.
More than 0 PPM and less than 15 PPM 34.77 3486 0.96 (0.87–1.06)
15 PPM or more 27.90 8750 0.90 (0.82–0.98)*
No salt in the household 29.30 157 0.80 (0.55–1.16)
Number of under five children 1.02 (0.93–1.11)
***
p< 0.001;** p< 0.01;*
Table 3Risk factors for severe underweight in children aged less than 5 years
Factors Severe Underweight (%) N OR 95% CI
Household member <=3 8.82 2449
4–6 8.69 10,904 0.89 (0.75–1.05)
> = 7 9.13 3780 0.98 (0.80–1.20)
Age (Months) 0–5 6.57 1872
6–11 6.86 1851 1.25 (0.94–1.66)
12–23 9.02 3749 1.81 (1.40–2.34)***
24–35 11.16 3530 2.32 (1.80–3.00)***
36–47 9.74 3212 2.04 (1.56–2.65)***
48–59 7.33 2919 1.48 (1.12–1.95)***
Gender Male 9.25 8853
Female 8.33 8280 0.90 (0.80–1.00)
Area Urban 6.91 2719
Rural 9.16 14,414 0.96 (0.80–1.15)
Division Dhaka 8.63 4345
Barisal 9.87 1652 1.06 (0.86–1.32)
Chittagong 10.10 3346 1.06 (0.89–1.26)
Khulna 5.60 2392 0.68 (0.55–0.85)**
Rajshahi 7.72 1762 0.86 (0.69–1.06)
Rangpur 8.03 2229 0.82 (0.67–1.00)
Sylhet 13.08 1407 1.34 (1.09–1.66)**
Education of mother None 12.79 4129
Primary incomplete 10.87 2493 0.93 (0.78–1.10)
Primary complete 8.99 2637 0.79 (0.66–0.95)*
Secondary incomplete 6.77 5926 0.78 (0.65–0.92)**
Secondary complete or higher 3.70 1948 0.69 (0.49–0.97)*
Education of father None 11.81 5428
Primary incomplete 9.98 2454 0.93 (0.79–1.09)
Primary complete 9.60 2145 1.02 (0.86–1.22)
Secondary incomplete 6.46 3175 0.79 (0.65–0.95)*
Secondary complete or higher 3.96 2399 0.66 (0.50–0.88)**
Wealth index quintile Poorest 12.59 4979
Second 10.28 3745 0.93 (0.80–1.08)
Middle 8.30 3203 0.80 (0.67–0.96)*
Fourth 5.55 2830 0.51 (0.40–0.64)***
Richest 3.11 2376 0.32 (0.23–0.46)***
Child drank plain water yesterday Yes 8.65 14,619
No 9.77 2487 1.45 (1.21–1.73)***
Child drank milk yesterday Yes 7.28 4013
No 9.28 13,105 0.94 (0.81–1.09)
Child ate vitamin yesterday Yes 7.67 1551
No 8.93 15,559 1.01 (0.81–1.25)
Toilet facility Flush latrine 6.44 4100
Pit latrine 8.73 10,677 0.91 (0.76–1.08)
can read, interpret and apply health tips from newspa-pers and other sources, and is more likely to understand medical information such as medication levels suggested by doctor. These skills enable mothers to make informed decisions about their children’s nutrition and health care, leading to improved child health.
Second, maternal education is associated with an in-crease in the frequency of mothers’antenatal care visits and their utilization of child health services, leading to decreased likelihood of underweight and severely under-weight children. It has been evident from studies that the more educated mothers are the more likely they are to access child health facilities more regularly compared to less educated mothers [46–48]. Antenatal care is often associated with improved child nutrition [26], and a study that employed data from 17 countries, aiming at determining the relationship between maternal educa-tion and child survival, found that uneducated women represented 55% more non-use of antenatal services than their educated counterparts [49].
Third, there is general recognition that more educated mothers are more likely to earn more money [44, 50]. This implies increased capability to invest in their chil-dren’s health, and more possibilities for living in an en-vironment with relatively higher food security. Finally, maternal education improves child nutritional status through its impact on appropriate feeding practices by mothers. Appropriate feeding practices have been docu-mented as very crucial for improving nutrition condi-tions of children; particularly during their infancy [51], and a study conducted in Bangladesh revealed the asso-ciation between improved feeding practices with educa-tion level of mother by demonstrating their findings that; compared with uneducated mothers, educated mothers were more concerned to breastfeed their chil-dren in protected place along with cleanness; that they were more aware to take breaks from the work at hand while breastfeeding their children and were more con-scious ensuring hygiene in the time children were pro-vided food [52]. Furthermore, higher level of education, completed by mothers, is associated with behavioral changes that improve child health. Women who have completed secondary education are more likely to have
more knowledge of improved child care practices [53], are better able to take responsibility for their children during illness [54], and more likely to have greater con-trol over household decision-making [55]. Even though we do not know exactly why increased maternal educa-tion is associated with lower likelihood of child under-weight, the aforementioned result underscore the need for female education to reduce underweight prevalence among children.
Similar to maternal education, paternal education was a significant predictor of underweight and severe under-weight. The result was supported by other studies that suggested low paternal education was associated with in-creased odds of child underweight [26,27,56,57]. Educa-tion level of fathers is generally associated with household income due to the fact that more educated fathers are more likely to earn more money; indeed, father’s educa-tion is typically used as a proxy indicator of household in-come [58]. Data on Indonesian children suggested that preventive factors against child malnutrition, such as use of improved latrine, vitamin A capsules for children, ac-cess to health facilities from local health community clinics, and consumption of iodized salt, were strongly re-lated with higher level of paternal education [12]. There is strong evidence that more educated men are more likely to marry more educated women. As a result, children of more educated fathers have an increased chance of having mothers who are also more educated. The view is sup-ported by Grossman’s model of the demand for good health which claims that more efficient investment in health is associated with more education [59].
[image:9.595.57.539.100.200.2]Another factor estimated to be significantly associated with child under-nutrition is the age of the children. Children below 5 months of age had the lowest risk of being underweight. One possible explanation could be that during this period children are still being breastfed, thereby gaining essential nutrition that renders them less vulnerable to malnutrition. On the other hand, study re-sults indicate that children’s risk of being underweight increased with age, this risk reaching its peak between the ages of 24–35 months. This suggests that during that period of children’s development, they had more than double the risk for underweight than the children who
Table 3Risk factors for severe underweight in children aged less than 5 years(Continued)
Factors Severe Underweight (%) N OR 95% CI
Others 11.81 1016 0.96 (0.73–1.26)
Salt iodization test Not iodized 0 PPM 10.46 4619
More than 0 PPM and less than 15 PPM 10.33 3486 1.04 (0.89–1.21)
15 PPM or more 7.38 8750 0.94 (0.82–1.08)
No salt in the household 7.01 157 0.79 (0.42–1.47)
Number of under five children 1.17 (1.02–1.33)*
***
p< 0.001;** p< 0.01,*
were less than 5 months of age. The similar result was reported by a study which found the risk of being under-weight and severely underunder-weight as highest between the ages of 22–24 months [4]. Another study conducted with Ethiopian children also supports our findings, which determined the association of the odds on child underweight and severely underweight with age of chil-dren [60]. The reason for increased risk of underweight associated with age may be that as children’s age in-creased, they consumed complementary food along with breast milk. Contamination is more likely in comple-mentary food, therefore implicated in spreading infec-tious diseases among children and in turn rendering them vulnerable to the risk of underweight [61].
Moreover, there is strong evidence that the prevalence of childhood disease is associated with child age, particu-larly in most of the developing countries [62]. Children living in higher wealth index households had smaller risk of being underweight and the finding was supported by other research work that claimed that children in lower wealth index households had greater chance of under-weight than the children in higher wealth index house-holds [56, 61, 63–66]. The explanation could be that children in higher wealth index households were more likely to belong to relatively food secure families, had comparatively more educated fathers and mothers, and lived in better neighborhood with improved health facil-ities. These factors might possibly have reduced the risk of underweight among the children living in higher wealth index households. It is widely known that mater-nal knowledge on child health has profound impact on child well nourishment, and a study performed in Bangladesh documented that mothers with better child health knowledge had mostly come from the richest households [67]. It implies the significance of household economic condition on child nutrition through im-proved maternal knowledge on child health. Respon-dents who reported their children had drunk plain water yesterday had lower odds on underweight for their chil-dren but there was no relationship between underweight and the type of toilet facilities. The risk of underweight was similar between male and female children, and be-tween rural and urban children, which was unexpected. One explanation for this may be that poor people from rural areas were migrating to urban slum areas where economic conditions and health facilities were not re-markably different from rural areas. The risk for children to be underweight depended on the division they lived in. Children from the Sylhet division had higher probability of underweight relative to children from the Dhaka division. The reason is not clear why children living in the Sylhet division were at more risk of underweight. Nevertheless, one possible reason might be that poor socioeconomic con-ditions such as few skilled workers, limited exposure to
media and poor maternal health were responsible for in-creased risk and higher prevalence of underweight among under five children in the Sylhet division [4].
The study had some limitations that should be ad-dressed. First of all, the study was cross-sectional in de-sign indicating that it was impossible to establish any causal relationship between underweight and the esti-mated risk factors. Nevertheless, the findings have great significance as it is claimed that the results from the same specific area using cross-sectional data have very limited variation over time. Secondly, household income is a well-established determinant of child underweight. But it is nearly impossible to have reliable data on household income and expenditure, particularly in de-veloping countries such as Bangladesh. That being the case, we elected to use wealth index as a proxy indicator of household income, bearing in mind that wealth index might not sufficiently represent household income.
Finally, data did not include child birth weight, mother’s weight, father’s weight, parents’age, father’s oc-cupation, or mother’s occupation. The magnitude of esti-mated risk factors could possibly be changed if those factors were adjusted for our regression model. Despite the study’s limitations, its strength was in assessing a large number of samples, hence the findings can be generalized to all Bangladeshi children below 5 years old in 2011– 2012. This group of children needs to be re-examined in 5 and 10 years to determine whether underweight and severe underweight leads to lasting detriments for these children.
Conclusion
Overall, in Bangladesh approximately one-third of the study population is estimated as underweight. Under-weight prevalence not only reflects poor nutritional con-ditions for children in a country, in general, it also reflects high socio-economic costs for low quality of life, vulnerability to different diseases and greater risk of childhood death. Due to the fact that it is more likely that underweight children who survive to adulthood will experience greater health problems, the prevalence of underweight may also contribute to loss of productivity.
business is reported to be insignificant [68]. In terms of other important social indicators like‘parental education’ Sylhet is reported to be poor-performing, according to the Bangladesh Bureau of Statistics, the overall literacy rate in the Sylhet division was the lowest in the country, at 39.2% in 2007, with an even lower female literacy rate of 35.1% [69]. This result calls for government and non-government interventions to increase education nationwide as much as possible, especially for the Sylhet division. This will also markedly increase the mother’s age when children are born, and decrease family size, which are particularly im-portant for reducing the prevalence of underweight children.
Endnotes
1
Stunting: height for age < −2 standard deviations (SD) of the WHO Child Growth Standards median
2
Wasting: weight for height <−2 standard deviations (SD) of the WHO Child Growth Standards median
3
Underweight: weight for age <−2 standard deviations (SD) of the WHO Child Growth Standards median
Acknowledgements
We would like to thank Professor Lindsay Brown for providing us a critical review and comments on the paper.
Availability of data and materials
The analysis was based on the Bangladesh Multiple Indicators Cluster Survey (MICS) 2012–13 data conducted by Bangladesh Bureau of Statistics along with UNICEF who provided technical and financial support, data is available on request athttp://microdata.worldbank.org/index.php/catalog/2533
Authors’contributions
TRC managed the dataset and analyze the data and write the script. SC conceptualized and synthesized the analysis, interpreted findings and helped in writing. MR helped to interpret and outline the findings. SS and KD helped in writing, editing and interpreting the results. All authors read and approved the final manuscript.
Ethics approval and consent to participate
Not applicable.
Competing interests
The authors declare that they have no competing interests.
Publisher’s Note
Springer Nature remains neutral with regard to jurisdictional claims in published maps and institutional affiliations.
Author details
1
Department of Economics, Shahjalal University of Science & Technology, Sylhet Kumargaon, Sylhet 3114, Bangladesh.2Institute for Resilient Regions, University of Southern Queensland, QLD, Springfield 4300, Australia.3School of Teacher Education and Early Childhood, University of Southern Queensland, Springfield Campus, Springfield, Australia.4School of Medicine, University of California, Riverside, USA.
Received: 19 February 2018 Accepted: 15 May 2018
References
1. Demissie S, Worku A. Magnitude and factors associated with malnutrition in children 6–59 months of age in pastoral community of Dollo Ado District,
Somali region, Ethiopia. Sci J Public Health. 2013;https://doi.org/10.11648/j. sjph.20130104.12.
2. Masibo PK, Makoka D. Trends and determinants of undernutrition among young Kenyan children: Kenya demographic and health survey; 1993, 1998, 2003 and 2008–2009. Public Health Nutr. 2012;https://doi.org/10.1017/ S1368980012002856.
3. Pasricha SR, Biggs BA. Undernutrition among children in south and South-East Asia. J Paediatr Child Health. 2010;https://doi.org/10.1111/j.1440-1754. 2010.01839.x.
4. Rahman A. Significant risk factors for childhood malnutrition: evidence from an Asian developing country. Sci J Public Health. 2016;https://doi.org/10. 11648/j.sjph.s.2016040101.14.
5. Pelletier DL, Frongillo EA Jr, Schroeder DG, Habicht JP. A methodology for estimating the contribution of malnutrition to child mortality in developing countries. J Nutr. 1994;124(10):2106S.
6. Schroeder DG, Brown KH. Nutritional status as a predictor of child survival: summarizing the association and quantifying its global impact. Bull World Health Organ. 1994;72(4):569.
7. Alaimo K, Olson CM, Frongillo EA. Food insufficiency and American school-aged children’s cognitive, academic, and psychosocial development. Pediatrics. 2001;108(1):44–53.
8. Winicki J, Jemison K. Food insecurity and hunger in the kindergarten classroom: its effect on learning and growth. Contemp Econ Policy. 2003;
https://doi.org/10.1093/cep/byg001.
9. Glewwe P, Jacoby HG, King EM. Early childhood nutrition and academic achievement: a longitudinal analysis. J Public Econ. 2001;81(3):345–68. 10. Mosley WH, Gray R. Childhood precursors of adult morbidity and mortality
in developing countries: implications for health programs. Epidemiol Transit. 1993;1:69–100.
11. Shetty P. Malnutrition and undernutrition. Medicine. 2003;31(4):18–22. 12. Semba RD, de Pee S, Sun K, Sari M, Akhter N, Bloem MW. Effect of parental
formal education on risk of child stunting in Indonesia and Bangladesh: a cross-sectional study. Lancet. 2008;371(9609):322–8. (35)
13. Ricci JA, Becker S. Risk factors for wasting and stunting among children in metro Cebu, Philippines. Am J Clin Nutr. 1996;63(6):966–75.
14. United Nations Children’s Fund. Improving Child Nutrition: The Achievable Imperative for Global Progress. New York: United Nations Children’s Fund; 2013.
15. World Health Organization. Nutrition Landscape Information System (NLIS) country profile indicators: interpretationhttp://apps.who.int/iris/bitstream/ 10665/44397/1/9789241599955_eng.pdf
16. Walker SP, Grantham-McGregor SM, Powell CA, Chang SM. Effects of growth restriction in early childhood on growth, IQ, and cognition at age 11 to 12 years and the benefits of nutritional supplementation and psychosocial stimulation. J Pediatr. 2000;137(1):36–41.
17. Ezzati M, Lopez AD, Rodgers A, Vander Hoorn S, Murray CJ. Comparative risk assessment collaborating group. Selected major risk factors and global and regional burden of disease. Lancet. 2002;360(9343):1347–60.
18. Caulfield LE, de Onis M, Blössner M, Black RE. Undernutrition as an underlying cause of child deaths associated with diarrhea, pneumonia, malaria, and measles. Am J Clin Nutr. 2004;80(1):193–8.
19. Wolde M, Berhan Y, Chala A. Determinants of underweight, stunting and wasting among schoolchildren. BMC Public Health. 2015;https://doi.org/10. 1186/s12889-014-1337-2.
20. United Nations Children’s Fund, World Health Organization, The World Bank. UNICEFWHO-World Bank Joint Child Malnutrition Estimates. New York, Geneva, Washington, DC: UNICEF, WHO, The World Bank; 2012.http://www. who.int/nutgrowthdb/jme_unicef_who_wb.pdf. Accessed 26 May 2018. 21. National Institute of Population Research and Training (NIPORT). Bangladesh
Demographic and Health Survey 2007. Available fromhttps://www.unicef. org/bangladesh/BDHS2007_Final.pdf. Accessed 26 May 2018.
22. Adeba A, Garoma S, Gemede HF, Garoma W. Prevalence of Stunting and Associated Factors of Children among 6–59 Months Age in Guto Gida District, East Wollega Zone, Oromia, Ethiopia. Food Sci Qual Manag. 2014;29
23. Rachmi CN, Agho KE, Li M, Baur LA. Stunting, underweight and overweight in children aged 2.0–4.9 years in Indonesia: prevalence trends and associated risk factors. PLoS One. 2016;11(5):e0154756.
25. Islam MA, Rahman MM, Mahalanabis D. Maternal and socioeconomic factors and the risk of severe malnutrition in a child: a case-control study. Eur J Clin Nutr. 1994;48(6):416–24. (12 IN A15)
26. Siddiqi MN, Haque MN, Goni MA. Malnutrition of under-five children: evidence from Bangladesh. Asian J Med Sci. 2011;2(2):113–9. (A6) 27. Nahar B, Ahmed T, Brown KH, Hossain MI. Risk factors associated with
severe underweight among young children reporting to a Diarrhoea treatment facility in Bangladesh. J Health Popul Nutr. 2010;1(32):476–83. 28. Devkota S, Panda B. Socioeconomic gradients in early childhood health: evidence from Bangladesh and Nepal. Int J Equity Health. 2016;15(1):78. 29. Alom J, Quddus MA, Islam MA. Nutritional status of under-five children in
Bangladesh: a multilevel analysis. J Biosoc Sci. 2012;44(5):525–35. 30. Srinivasan CS, Zanello G, Shankar B. Rural-urban disparities in child nutrition
in Bangladesh and Nepal. BMC Public Health. 2013;13(1):581.
31. Ahsan KZ, El Arifeen S, Al-Mamun MA, Khan SH, Chakraborty N. Effects of individual, household and community characteristics on child nutritional status in the slums of urban Bangladesh. Archives Public Health 2017;75(1):9. 32. Das S, Rahman RM. Application of ordinal logistic regression analysis in
determining risk factors of child malnutrition in Bangladesh. Nutr J. 2011; 10(1):124.
33. Das S, Gulshan J. Different forms of malnutrition among under five children in Bangladesh: a cross sectional study on prevalence and determinants. BMC Nutrition. 2017 Jan 3;3(1):1.
34. Bangladesh Multiple Indicator Cluster Survey 2012-2013.http://microdata. worldbank.org/index.php/catalog/2533/sampling. Accessed 26 May 2018. 35. Bangladesh Multiple Indicator Cluster Survey 2012-2013. ProgotirPathey:
Final Report. Dhaka: Bangladesh Bureau of Statistics (BBS) and UNICEF Bangladesh; 2014.
36. Alasfoor D, Traissac P, Gartner A, Delpeuch F. Determinants of persistent underweight among children, aged 6-35 months, after huge economic development and improvements in health services in Oman. J Health Popul Nutr. 2007:359–69.
37. Mukabutera A, Thomson DR, Hedt-Gauthier BL, Basinga P, Nyirazinyoye L, Murray M. Risk factors associated with underweight status in children under five: an analysis of the 2010 Rwanda demographic health survey (RDHS). BMC Nutrition. 2016;https://doi.org/10.1186/s40795-016-0078-2. 38. Rahman A, Chowdhury S. Determinants of chronic malnutrition among
preschool children in Bangladesh. J Biosoc Sci. 2007;39(2):161–73. (9 IN A15; 10 IN 805)
39. Henry F, Briend A, Fauveav V, Huttly SR, Yunus M, Chakraborty J. The risk approach to intervention in severe malnutrition in rural Bangladesh. Am J Epidemiol. 1992;136(4):460–3. (18 IN A15)
40. Henry FJ, Briend A, Fauveau V, Huttly SA, Yunus M, Chakraborty J. Gender and age differentials in risk factors for childhood malnutrition in Bangladesh. Ann Epidemiol. 1993;3(4):382–6. (19 IN A15)
41. HENRY F, Briend A, Fauveau V, HUTTLY SR, Yunus M, Chakraborty J. Risk factors for clinical marasmus: a case-control study of Bangladeshi children. Int J Epidemiol. 1993;22(2):278–83. (20 IN A15)
42. Hossain MI, Yasmin R, Kabir I. Nutritional and immunisation status, weaning practices and socio-economic conditions of under five children in three villages of Bangladesh. Indian J Public Health. 1999;43(1):37–41. (21 IN A15) 43. Chisti MJ, Hossain MI, Malek MA, Faruque AS, Ahmed T, Salam MA.
Characteristics of severely malnourished under-five children hospitalized with diarrhoea, and their policy implications. Acta Paediatr. 2007;96(5):693–6. (22 IN A15)
44. Strauss J, Thomas D. Human resources: empirical modeling of household and family decisions. Handb Dev Econ. 1995;3(26):1883–2023.
45. Glewwe P. Why does mother’s schooling raise child health in developing countries? Evidence from Morocco. J Hum Resour. 1999;1(27):124–59. 46. Tekce B, Shorter FC. Determinants of child mortality: a study of squatter
settlements in Jordan. Popul Dev Rev. 1984;10(Suppl 1):257–80. (11 in A8) 47. Benyoussef A, Wessen AF. Utilization of health services in developing
countries—Tunisia. Soc Sci Med (1967). 1974;8(5):287–304. (12 IN A8) 48. Caldwell JC, Reddy PH, Caldwell P. The social component of mortality
decline: an investigation in South India employing alternative methodologies. Popul Stud 1983;37(2):185–205. (13 IN A8). 49. Bicego GT, Boerma JT. Maternal education and child survival: a
comparative study of survey data from 17 countries. Soc Sci Med. 1993; 36(9):1207–27. (A8)
50. Handa S. Maternal education and child height. Econ Dev Cult Chang. 1999; 47(2):421–39. (28)
51. Kumar D, Goel NK, Mittal PC, Misra P. Influence of infant-feeding practices on nutritional status of under-five children. Indian J Pediatr. 2006;73(5):417– 21. (39 IN A13)
52. Guldan GS, Zeitlin MF, Beiser AS, Super CM, Gershoff SN, Datta S. Maternal education and child feeding practices in rural Bangladesh. Soc Sci Med. 1993;36(7):925–35. (A7)
53. Samuel Oyekale A. Factors explaining acute malnutrition among under- five children in Sub-Sahara Africa (SSA). Life Sci J. 2012;9(4):2101–7. Available from:http://www.lifesciencesite.com/lsj/life0904/314_11976life0904_2101_ 2107.pdf.
54. Bhutta ZA, Ahmed T, Black RE, Cousens S, Dewey K, Giugliani E, Haider BA, Kirkwood B, Morris SS, Sachdev HP, Shekar M. What works? Interventions for maternal and child undernutrition and survival. Lancet. 2008;371(9610):417–40. (30) 55. Keats A. Women’s schooling, fertility, and child health outcomes: Evidence
from Uganda’s free primary education Program. Mimeo: Wesleyan University; 2014. p. 31.
56. Janevic T, Petrovic O, Bjelic I, Kubera A. Risk factors for childhood malnutrition in Roma settlements in Serbia. BMC Public Health. 2010;
https://doi.org/10.1186/1471-2458-10-509.
57. Rayhan MI, Khan MS. Factors causing malnutrition among under five children in Bangladesh. Pak J Nutr. 2006;5(6):558–62. (A4)
58. Bairagi R. Is income the only constraint on child nutrition in rural Bangladesh? Bull World Health Organ. 1980;58(5):767. (34)
59. Grossman M. On the concept of health capital and the demand for health. J Polit Econ. 1972;80(2):223–55. (36)
60. Yimer G. Malnutrition among children in southern Ethiopia: levels and risk factors. Ethiop J Health Dev. 2000;14(3) (Yimer in A16)
61. Hong R, Banta JE, Betancourt JA. Relationship between household wealth inequality and chronic childhood under-nutrition in Bangladesh. Int J Equity Health. 2006;5(1):15. (A14)
62. Casas JA, Dachs JN, Bambas A. Health disparities in Latin America and the Caribbean: the role of social and economic determinants. Equity Health. 2001;8(37):22–49.
63. Khor GL, Sharif ZM. Dual forms of malnutrition in the same households in Malaysia-a case study among Malay rural households. Asia Pac J Clin Nutr. 2003;12(4):427–37. (38)
64. Larrea C, Freire W. Social inequality and child malnutrition in four Andean countries. Rev Panam Salud Publica. 2002;11(5–6):356–64. (26 IN A14) 65. Wang Y, Monteiro C, Popkin BM. Trends of obesity and underweight in
older children and adolescents in the United States, Brazil, China, and Russia. Am J Clin Nutr. 2002;75(6):971–7. (27 IN A14)
66. Doak C, Adair L, Bentley M, Fengying Z, Popkin B. The underweight/ overweight household: an exploration of household sociodemographic and dietary factors in China. Public Health Nutr. 2002;5(1a):215–21. (28 IN A14) 67. Sarma H, Khan JR, Asaduzzaman M, Uddin F, Tarannum S, Hasan MM,
Rahman AS, Ahmed T. Factors influencing the prevalence of stunting among children aged below five years in Bangladesh. Food Nutr Bull. 2017; 1(805):0379572117710103.
68. De Bruyn T. Dynamics of remittance utilisation in Bangladesh. IOM research series, no. 18. Geneva: International Organization for Migration; 2005. p. 40. 69. Mohsena M, Goto R, Taylor MNCG. Regional variation in maternal and