Pattern Recognition Receptor MDA5 Modulates CD8
ⴙ
T
Cell-Dependent Clearance of West Nile Virus from the Central Nervous
System
Helen M. Lazear,aAmelia K. Pinto,aHilario J. Ramos,dSarah C. Vick,aBimmi Shrestha,aMehul S. Suthar,eMichael Gale, Jr.,d Michael S. Diamonda,b,c
Departments of Medicine,aPathology & Immunology,band Molecular Microbiology,cWashington University School of Medicine, St. Louis, Missouri, USA; Department of
Immunology, University of Washington School of Medicine, Seattle, Washington, USAd; Department of Pediatrics, Emory Vaccine Center, Emory University, Atlanta,
Georgia, USAe
Many viruses induce type I interferon responses by activating cytoplasmic RNA sensors, including the RIG-I-like receptors
(RLRs). Although two members of the RLR family, RIG-I and MDA5, have been implicated in host control of virus infection, the
relative role of each RLR in restricting pathogenesis
in vivo
remains unclear. Recent studies have demonstrated that MAVS, the
adaptor central to RLR signaling, is required to trigger innate immune defenses and program adaptive immune responses, which
together restrict West Nile virus (WNV) infection
in vivo
. In this study, we examined the specific contribution of MDA5 in
con-trolling WNV in animals.
MDA5
ⴚ/ⴚmice exhibited enhanced susceptibility, as characterized by reduced survival and elevated
viral burden in the central nervous system (CNS) at late times after infection, even though small effects on systemic type I
inter-feron response or viral replication were observed in peripheral tissues. Intracranial inoculation studies and infection
experi-ments with primary neurons
ex vivo
revealed that an absence of MDA5 did not impact viral infection in neurons directly.
Rather, subtle defects were observed in CNS-specific CD8
ⴙT cells in
MDA5
ⴚ/ⴚmice. Adoptive transfer into recipient
MDA5
ⴙ/ⴙmice established that a non-cell-autonomous deficiency of MDA5 was associated with functional defects in CD8
ⴙT cells, which
resulted in a failure to clear WNV efficiently from CNS tissues. Our studies suggest that MDA5 in the immune priming
environ-ment shapes optimal CD8
ⴙT cell activation and subsequent clearance of WNV from the CNS.
V
ertebrate cells use a variety of proteins to detect viral infection.
These sensors recognize non-self molecular signatures, chiefly
foreign nucleic acid motifs, termed pathogen-associated
molecu-lar patterns (PAMPs). PAMPs are detected by cellumolecu-lar pattern
rec-ognition receptors (PRRs), which initiate signal transduction
cas-cades that activate the host antiviral response. Two key classes of
PRRs against RNA viruses include the Toll-like receptor (TLR)
family, whose members detect extracellular and endosomal
PAMPs, and the RIG-I-like receptor (RLR) family, which detects
PAMPs in the cytoplasm (
1–4
). The RLR family includes three
members: RIG-I, MDA5, and LGP2, encoded by the genes
Ddx58
,
Ifih1
, and
Dhx58
, respectively. RIG-I and MDA5 have similar
do-main organizations consisting of two tandem N-terminal caspase
recruitment domains (CARDs), a central DexD/H box helicase
domain with ATPase activity, and a C-terminal repressor domain
(
5
,
6
). LGP2 is distinct from the other RLRs in that it possesses
helicase and regulatory domains but lacks CARDs, and it is thus
believed to serve as a regulator of RLR signaling (
7–10
). RIG-I and
MDA5 recognize distinct RNA ligands, with RIG-I preferentially
recognizing 5
=
triphosphate (5
=
-ppp) RNA encoding a short
dou-ble-stranded RNA (dsRNA) motif or a single-stranded
polyuri-dine or polycytosine motif, and MDA5 recognizing longer dsRNA
motifs (
11–18
). Upon RNA binding to the repressor domain,
RIG-I and MDA5 undergo conformational changes that expose
the CARDs and promote homo-oligomerization,
cytosol-to-mi-tochondrion translocation, and interaction with the
mitochondri-on-localized adaptor molecule MAVS (also called IPS-1, VISA, or
CARDIF) (
3
,
6
,
19–21
). This interaction initiates a signaling
cas-cade that results in the activation of interferon (IFN) regulatory
factor (IRF) family transcription factors, production of type I IFN,
expression of cytokines and IFN-stimulated genes (ISGs), and
in-duction of an antiviral state.
RIG-I and MDA5 have been implicated in the control of viral
infection in cell culture, with each sensor initiating a host defense
response to distinct and overlapping sets of viruses.
Picornavi-ruses, including encephalomyocarditis virus (ECMV), Theiler’s
murine encephalomyelitis virus (TMEV), and Mengo virus, as
well as a calicivirus, murine norovirus, appear to be sensed
exclu-sively by MDA5 (
22–24
), possibly because the covalently attached
Vpg protein on the 5
=
end of the viral genome blocks exposure of
the 5
=
-ppp moiety that normally would be recognized by RIG-I.
MDA5 also is an important sensor of a coronavirus, murine
hep-atitis virus (MHV), particularly in the absence of a 2
=
-O-methyl-ated cap on the viral RNA (
25
,
26
). Furthermore, ectopic
expres-sion of MDA5 in human hepatoma cells and fibroblasts inhibited
replication of West Nile (WNV) and Venezuelan equine
enceph-alitis viruses (
27
). In comparison, RIG-I is essential for
recogni-tion of hepatitis C (HCV), influenza A, respiratory syncytial, and
Sendai (SeV) viruses, whereas RIG-I and MDA5 both serve to
recognize infection by WNV and dengue viruses (
16
,
28
). In some
cases, MDA5 and RIG-I may function as PRRs with differential
kinetics of viral RNA detection, with RIG-I recognizing
virus-Received29 May 2013Accepted6 August 2013
Published ahead of print21 August 2013
Address correspondence to Michael S. Diamond, [email protected].
Copyright © 2013, American Society for Microbiology. All Rights Reserved.
doi:10.1128/JVI.01403-13
on November 7, 2019 by guest
http://jvi.asm.org/
or host-generated PAMPs early after infection and MDA5
act-ing later, after dsRNA viral or host-derived PAMPs accumulate
(
29
,
30
).
The importance of RLR signaling for controlling viral
patho-genesis is evident from studies with genetically deficient mice. For
example, in the absence of MAVS, mice are highly vulnerable to
infection with WNV and Sindbis, chikungunya, Coxsackie B
(CBV), and rabies viruses (
31–36
). The contributions of
individ-ual RLRs to this response
in vivo
have been more difficult to dissect
because the
RIG-I
⫺/⫺genotype is embryonic lethal on pure
ge-netic backgrounds (e.g., C57BL/6 or 129Sv) (
22
,
37
).
LGP2
⫺/⫺mice are free of developmental defects and exhibited increased
susceptibility to WNV infection that was associated with defects in
the expansion and fitness of CD8
⫹T cells (
38
).
MDA5
⫺/⫺mice
develop normally, and their responses to a variety of RNA virus
infections have been characterized.
MDA5
⫺/⫺mice had increased
mortality, disease severity, and/or viral burden after infection with
ECMV, CBV, TMEV, rhinovirus, murine norovirus, SeV, or
hu-man metapneumovirus (HMPV) (
22–24
,
34
,
39–43
). However,
MDA5
⫺/⫺mice showed no increase in susceptibility to infection
with Japanese encephalitis or vesicular stomatitis virus (
22
).
WNV is a neurotropic flavivirus that is maintained in an
enzo-otic cycle between birds and ornithophillic mosquitoes, with
hu-mans and other mammals serving as incidental dead-end hosts
(
44
,
45
). It is believed that following subcutaneous inoculation,
WNV infects keratinocytes and resident dendritic cells, the latter
of which traffic to the draining lymph nodes, where they facilitate
spread of infection and development of viremia (
46
,
47
). The
mechanism by which WNV crosses the blood-brain barrier (BBB)
to infect the central nervous system (CNS) remains unclear, but it
may involve passage of virus between compromised cell junctions
of the BBB, trafficking of infected leukocytes into the CNS, or
direct infection of the microvascular endothelial cells (
48
,
49
).
WNV infection causes neurologic injury by direct cytopathic
ef-fect on inef-fected neurons, bystander damage to uninef-fected cells,
and immunopathology from infiltrating immune cells responding
to the infection (
48
). In humans, WNV infection can result in
encephalitis, meningitis, or flaccid paralysis, and neurologic
se-quelae may persist even after the infection is resolved (
50
,
51
).
While the innate immune response, especially type I IFN,
con-tributes to the control of virus infection in peripheral tissues,
cell-mediated adaptive immunity, particularly CD8
⫹T cells, restricts
and clears WNV infection from the CNS (
52–56
). Cell culture and
in vivo
studies have established that TLR and RLR signaling
or-chestrates control of WNV infection (
31
,
38
,
57–61
). Although
MDA5 contributes to the induction of the antiviral type I IFN
response and limits replication of WNV infection in cell culture
(
27
,
29
), its contribution to host control of pathogenesis has
re-mained unclear. In this study, we found that while mice lacking
MDA5 were more susceptible to WNV infection, the antiviral role
of MDA5
in vivo
was not strongly linked to direct control of viral
replication. Rather, a deficiency of MDA5 was associated with
functional defects in CD8
⫹T cells, which resulted in a failure to
clear WNV efficiently from CNS tissues.
MATERIALS AND METHODS
Viruses.The WNV strain used (3000.0259) was isolated in New York in 2000 and passaged once in C6/36Aedes albopictuscells to generate a virus stock that was used in all experiments (52,62). Virus titers were measured by plaque assay on BHK21-15 cells as previously described (52).
Mouse experiments. C57BL/6 wild-type (WT) inbred mice were commercially obtained (Jackson Laboratories, Bar Harbor, ME).
MDA5⫺/⫺mice (23) were provided by M. Colonna (Washington
Univer-sity, St. Louis, MO) and backcrossed for 10 generations onto a C57BL/6 background. CongenicCD8⫺/⫺mice were obtained from Jackson
Labo-ratories.MDA5⫺/⫺andCD8⫺/⫺mice were genotyped and bred in the
animal facilities of the Washington University School of Medicine.
TCR␣⫺/⫺mice were purchased from Jackson Laboratories or were the gift
of T. Egawa (Washington University). Nine- to 12-week-old mice were used for allin vivostudies except for some of the adoptive-transfer exper-iments, which used 6-week-old mice. For peripheral infection, 102to 104 PFU of WNV was diluted in Hanks balanced salt solution (HBSS) supple-mented with 1% heat-inactivated fetal bovine serum (FBS) and inocu-lated by footpad injection in a volume of 50l. For intracranial infection, 101PFU of WNV in a volume of 10l was injected into the right cerebral hemisphere. Experiments were approved and performed in accordance with Washington University animal study guidelines.
Tissue viral burden and viremia.To monitor viral spreadin vivo, mice were infected with 102PFU of WNV by subcutaneous inoculation in the footpad and sacrificed at specified time points (i.e., day 1, 2, 3, 4, 5, 6, 8, or 10) after infection. To monitor viral replication directly in the CNS, mice were infected with 101PFU of WNV by intracranial injection and sacrificed at day 2, 4, or 6 after infection. After extensive cardiac perfusion with phosphate-buffered saline (PBS), organs were harvested, weighed, and homogenized, and virus titers were determined by plaque assay. Viral RNA was isolated from serum using a viral RNA minikit (Qiagen) and measured by fluorogenic quantitative reverse transcription-PCR (qRT-PCR) using primers and probes to the WNV envelope gene (63), One-Step RT-PCR Master Mix, and a 7500 Fast Real-Time PCR System (Ap-plied Biosystems).
Primary cell infections.Cortical neurons were prepared from day 15 mouse embryos, and cerebellar granule cell neurons were prepared from six day-old pups as described previously (64–66). Neurons were seeded in
poly-D-lysine–laminin-coated plates (cortical neurons) or poly-D-lysine-coated
plates (granule cell neurons) and cultured for 4 days with Neurobasal me-dium containing B27 supplement,L-glutamine, and penicillin-streptomycin
(Invitrogen). Multistep virus growth curves were performed after infection at a multiplicity of infection (MOI) of 0.001, and viral replication was measured by plaque assay.
Quantification of type I IFN activity.Levels of biologically active type I IFN were determined using an ECMV cytopathic effect bioassay per-formed with L929 cells as described previously (67). Prior to the assay, serum samples were treated with citrate buffer (40 mM citric acid, 10 mM KCl, 135 mM NaCl [pH 3.0]) for 10 min and neutralized with medium containing 45 mM HEPES (pH 8.0). The amount of type I IFN per ml of serum was calculated from a standard curve using alpha interferon (IFN-␣; PBL InterferonSource). The IFN specificity of the antiviral activ-ity was confirmed by preincubating L929 cells for 2 h with 25g/ml of the IFNAR-blocking monoclonal antibody (MAb) MAR1-5A3 or an isotype control MAb, GIR-208 (68).
Cytokine analysis.Mice were infected subcutaneously with 102PFU of WNV in the footpad, and brains were collected at 8 days after infection following extensive perfusion with PBS. Brains were homogenized in 500
l of PBS containing 1% heat-inactivated FBS using a Precellys 24 (Bertin Technologies) at 1,500 rpm for 20 s, and cytokines were measured by Luminex array. Protein concentration was assessed by Bradford colori-metric assay (Bio-Rad), and 25l of tissue lysate was analyzed using a 13-plex Luminex assay (Millipore) followed by analysis on a Bio-Plex 200 (Bio-Rad). Concentrations of cytokine were normalized to total protein levels. Cytokine levels in serum were measured using a Bio-Plex Pro 23-plex group I cytokine kit (Bio-Rad) and Bio-Plex 200 (Bio-Rad).
Antibody responses.The levels of WNV-specific IgM and IgG were determined using an enzyme-linked immunosorbent assay (ELISA) against purified WNV E protein, as described previously (69).
on November 7, 2019 by guest
http://jvi.asm.org/
Cellular immune responses.WT andMDA5⫺/⫺mice were infected
in the footpad with 102, 103, or 104PFU of WNV, and at 7 days after infection, spleens and brains were harvested after extensive cardiac perfu-sion with PBS. Splenocytes were dispersed into single-cell suspenperfu-sions with a cell strainer. Brains were minced and digested with 0.05% collage-nase D, 0.1g/ml of trypsin inhibitorN␣-p-tosyl-L-lysine chloromethyl ketone, and 10g/ml of DNase I in HBSS supplemented with 10 mM HEPES, pH 7.4 (Life Technologies). Cells were dispersed into single-cell suspensions with a cell strainer and pelleted through a 30% Percoll cushion for 30 min (1,200⫻gat 4°C). Intracellular IFN-␥or tumor necrosis factor alpha (TNF-␣) staining was performed afterex vivo
restimulation with a Db-restricted NS4B immunodominant peptide using 1M peptide and 5g/ml of brefeldin A (Sigma) as described previously (70). Cells were stained with the following antibodies and processed by multicolor flow cytometry on an LSR II flow cytometer (Becton, Dickinson): CD3 (Becton, Dickinson; clone 145-2C11), CD4 (Biolegend; clone RM4-5), CD8 (Biolegend; clone YT5156.7.7), CD25 (eBiosciences; clone PC61.5), FoxP3 (eBiosciences; clone FJK-16S), B220 (Invitrogen), CD45 (Biolegend; clone 30-F11), CD11b (Becton, Dickinson; clone M1/70), CD11c (Becton, Dickinson; clone HL3), CD80 (eBiosciences; clone 16-10A1), CD86 (eBiosciences; clone P03.1), major histocompatibility complex class II (MHC-II; Bioleg-end; clone M5/114.15.2), CD43 (BiolegBioleg-end; clone IM7), CD62L (In-vitrogen), KLRG1 (Biolegend; clone 2F1/KLRG1), PD1 (Biolegend; RMP1-30), IFN-␥(Becton, Dickinson; clone XMG1.2), TNF-␣ (Bio-legend; clone MP6-XT22), and granzyme B (Invitrogen). Flow cytom-etry data were analyzed using FlowJo software (Treestar).
Adoptive transfer of primed CD8ⴙcells.WT andMDA5⫺/⫺mice
were infected with 102PFU of WNV in the footpad. At 7 days after infec-tion, splenocytes were isolated and CD8⫹T cells were purified by positive selection using CD8␣microbeads (Miltenyi Biotec). A total of 3⫻106 WT orMDA5⫺/⫺donor CD8⫹cells were adoptively transferred via an
intraperitoneal route to recipientCD8⫺/⫺mice that had been infected
with WNV 1 day earlier. A sample of transferred cells was stained with an antibody against CD8␣(clone 53-6.7; Becton, Dickinson) or an isotype control and analyzed by flow cytometry (fluorescence-activated cell sorter [FACS] array; Becton, Dickinson) to assess the efficiency of positive selec-tion. WNV-specific CD8⫹cells were identified after staining with a Db -restricted NS4B peptide tetramer, SSVWNATTA (71) (NIH Tetramer Core Facility, Emory University). Nine days following adoptive transfer (10 days after infection), recipientCD8⫺/⫺mice were perfused with PBS
and viral loads in the brain, spinal cord, and spleen were measured by plaque assay.
Adoptive transfer of naive CD8ⴙcells.Naive WT andMDA5⫺/⫺
splenocytes were purified by positive selection using CD8␣or CD4 mi-crobeads and an autoMACS Pro Separator (Miltenyi Biotec). A total of 1⫻107WT orMDA5⫺/⫺CD8⫹cells plus 2⫻106WT CD4⫹cells were
transferred to recipientTCR␣⫺/⫺mice by an intravenous route. One day
following transfer, recipient mice were infected with 102PFU of WNV in the footpad. At 9 days following infection (10 days after transfer), recipi-ent mice (and no-transfer controls) were perfused with PBS and brains were processed as described above. Cells were stained with the following antibodies and processed by multicolor flow cytometry on an LSR II flow cytometer (Becton, Dickinson): CD3 (Becton, Dickinson; clone 145-2C11), CD4 (Biolegend; clone RM4-5), CD8␣(Biolegend; clone 53-6.7), CD19 (Biolegend; clone 6D5), and granzyme B (Invitrogen). WNV-spe-cific CD8⫹cells were identified after staining with the Db-restricted NS4B peptide tetramer. Flow cytometry data were analyzed using FlowJo soft-ware (Treestar).
Statistical analysis.Viral growth curves were analyzed by a 2-way analysis of variance (ANOVA). For viral burden, serum bioassay, anti-body, and lymphocyte analyses, differences were analyzed by the Mann-Whitney test. Kaplan-Meier survival curves were analyzed by the log rank test. All data were analyzed using Prism software (GraphPad Prism 5; GraphPad, San Diego, CA).
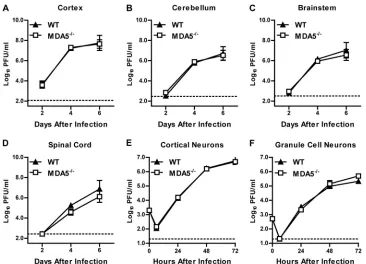
FIG 1Survival and viral burden in WT andMDA5⫺/⫺mice after peripheral inoculation. Mice were infected with 102PFU of WNV in the footpad. (A) Survival
was monitored for 21 days in 15 WT and 25MDA5⫺/⫺mice. (B) Viremia was measured by qRT-PCR from 1 to 6 days after infection. (C to F) Viral burden was
measured by plaque assay from 2 to 10 days after infection. In panels B to F, results represent means⫾SEMs of 7 to 12 mice per group; dotted lines represent the limit of sensitivity of the assay. *,P⬍0.05; **,P⬍0.01; ***,P⬍0.001.
MDA5 Controls WNV Pathogenesis
on November 7, 2019 by guest
http://jvi.asm.org/
[image:3.585.111.475.64.329.2]RESULTS
Susceptibility of
MDA5
ⴚ/ⴚmice to WNV infection.
To
deter-mine if MDA5 is necessary for restricting WNV pathogenesis
in
vivo
, we infected WT and
MDA5
⫺/⫺mice with WNV by
subcuta-neous inoculation and monitored survival over time.
MDA5
⫺/⫺mice exhibited enhanced mortality (92% versus 53%;
P
⬍
0.001)
(
Fig. 1A
) and reduced average survival time (mean times to death,
11.1 and 12.8 days for
MDA5
⫺/⫺and WT mice, respectively;
P
⬍
0.01) compared to infected WT mice. To determine the basis for
this increased lethality, we measured viral loads in tissues
follow-ing WNV infection. We found that MDA5 was largely dispensable
for controlling WNV replication in peripheral organs, as
MDA5
⫺/⫺mice showed only a small increase in viremia at a single
time point (11-fold greater at day 2 after infection;
P
⬍
0.05) (
Fig.
1B
). In comparison, no significant differences were observed in
viral burden in the spleen (
Fig. 1C
), and only limited replication in
the kidneys was detected in 5 of 12
MDA5
⫺/⫺mice (at 8 days after
infection;
P
⬍
0.05) (
Fig. 1D
). These results were unanticipated
given the marked increase in viremia and visceral organ infection
observed in
MAVS
⫺/⫺mice, which completely lack RLR signaling
(
31
), and the increased viral loads observed when
MDA5
⫺/⫺mice
were infected with other RNA viruses (
22
,
24
,
39–43
).
Consistent with a small effect of MDA5 on controlling WNV
infection in peripheral tissues, early entry into the CNS was not
observed in
MDA5
⫺/⫺mice compared to WT controls. Similar
levels of WNV were observed at days 2 through 8 in the brain and
spinal cord (
P
⬎
0.05), but
MDA5
⫺/⫺mice exhibited marked
increases in viral titers in the CNS at later times after infection. At
day 10 after infection, we observed a 140-fold-higher viral burden
in the brain (
P
⬍
0.01) (
Fig. 1E
) and a 21-fold-higher viral burden
in the spinal cord (
P
⬍
0.01) (
Fig. 1F
) in
MDA5
⫺/⫺mice than in
WT controls. These results suggest that MDA5 is important in
controlling immunity to WNV in the CNS.
Because previous studies showed direct antiviral effects of the
RLR signaling pathway in cells of the CNS (
43
), we hypothesized
that the enhanced WNV infection phenotype in
MDA5
⫺/⫺mice
could be explained by an MDA5-dependent restriction of
replica-tion in neuronal cells. To test this, wild-type and
MDA5
⫺/⫺mice
were infected with 10
1PFU of WNV directly into the brain via an
intracranial route, and viral burden in the cerebral cortex, brain
stem, cerebellum, and spinal cord was measured on days 2, 4, and
6 after infection. In contrast to the increased viral titers observed
in the CNS of
MDA5
⫺/⫺mice after peripheral inoculation, we
observed no differences in infection between WT and
MDA5
⫺/⫺mice following intracranial injection (
P
⬎
0.05) (
Fig. 2A
to
D
).
Consistent with this, an absence of MDA5 did not impact WNV
infection in primary cortical or cerebellar neuron cultures (
P
⬎
0.05) (
Fig. 2E
and
F
).
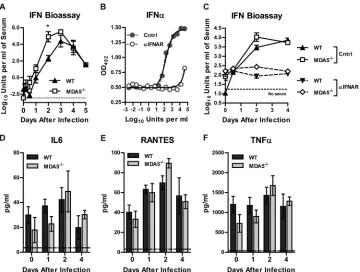
Effect of MDA5 on innate immune responses
in vivo
.
One
explanation for the increased viral load in the CNS of
MDA5
⫺/⫺mice after subcutaneous infection might be a defective
MDA5-dependent protective immune response originating in the
periph-ery. As MDA5 contributes to the induction of type I IFN
in vivo
in
the context of multiple viral infections (
22
,
34
,
39–43
,
72
,
73
) and
to the induction of ISGs after WNV infection in fibroblasts (
29
),
we assessed the impact of the loss of MDA5 on systemic levels of
type I IFN after WNV infection (
Fig. 3A
). Contrary to what has
been reported with other viral infections, we did not observe a
FIG 2Viral replication in CNS tissues and cells from WT andMDA5⫺/⫺mice. (A to D) Mice were infected with 101PFU of WNV by intracranial injection. Viral
replication was measured by plaque assay from 2 to 6 days after infection. Results represent means⫾SEMs of 6 to 10 mice per group; dotted lines represent the limit of sensitivity of the assay. (E and F) Multistep growth curves in cortical neurons and cerebellar granule cell neurons. Cells were infected at an MOI of 0.001 for 72 h, and viral replication was measured by plaque assay. Results represent means⫾SEMs of 6 samples from 2 independent experiments; dotted lines represent the limit of sensitivity of the assay.
on November 7, 2019 by guest
http://jvi.asm.org/
[image:4.585.110.476.64.328.2]deficiency in type I IFN levels in the serum of
MDA5
⫺/⫺mice.
Moreover, by 2 days after infection,
MDA5
⫺/⫺mice had higher
levels (396-fold;
P
⬍
0.05) of type I IFN in serum than did WT
mice, possibly driven by the increased viremia at this time point.
We confirmed that the observed serum antiviral activity was due
to type I IFN, as it was completely neutralized by an
IFNAR-block-ing antibody (
Fig. 3B
and
C
). Although MDA5 contributes to
inflammatory cytokine production in the context of other viral
infections (
24
,
40
,
41
), we did not detect a significant difference
between WT and
MDA5
⫺/⫺mice in levels of 23 cytokines and
chemokines in serum at day 0, 1, 2, or 4 after infection (
Fig. 3D
to
F
and
Table 1
).
While MDA5 did not modulate cytokine or chemokine
pro-duction systemically, we hypothesized that MDA5 might regulate
production in the CNS in a manner that is required for WNV
control. To assess this, we infected WT and
MDA5
⫺/⫺mice
sub-cutaneously and measured the levels of nine cytokines and
chemokines in the brain at day 8 after infection (
Fig. 4
). Notably,
we failed to detect any deficit in cytokine production in the brains
of
MDA5
⫺/⫺mice. While there was no difference in macrophage
inflammatory protein 1 (MCP-1), MIP-1
␣
, interleukin 1
␣
(IL-1
␣
), IL-6, or IFN-
␥
production, levels of MIP-1

, IL-12 (p70),
RANTES, and TNF-
␣
were in fact greater in
MDA5
⫺/⫺mice than
in WT mice, likely secondary to enhanced viral replication in the
brains of
MDA5
⫺/⫺mice.
Effect of MDA5 on adaptive immune responses
in vivo
.
Our
prior studies revealed an innate/adaptive immune interface that
was regulated by MAVS and modulated the magnitude of the
hu-moral immune response to WNV infection (
31
). To assess the
effect of MDA5 on WNV-specific antibody responses, we analyzed
serum from
MDA5
⫺/⫺and WT mice 4, 6, and 8 days after
infec-tion for binding to WNV E protein. We observed no defects in
anti-WNV E protein IgM or IgG responses in
MDA5
⫺/⫺mice
(
Fig. 5
). Indeed, we observed a small increase in WNV-specific
IgM titers in
MDA5
⫺/⫺mice at 6 days after infection, again
pos-sibly reflecting the slightly increased viremia observed in these
mice. Thus, the difference in WNV pathogenesis in
MDA5
⫺/⫺mice did not appear to be explained by altered humoral immune
responses.
We next considered whether defects in cellular immune
re-sponses in
MDA5
⫺/⫺mice could explain their susceptibility to
WNV infection. This seemed a plausible hypothesis, as mice
defi-cient in CD8 or perforin showed an analogous late-stage
pheno-type in the CNS (
53
,
74
), and
LGP2
⫺/⫺mice exhibited defects in
CD8
⫹T cell immunity during viral infection (
38
). Additional
studies suggest that MDA5-dependent responses to soluble
PAMPs or lymphocytic choriomeningitis virus (LCMV) infection
can boost induction of effector and memory CD8
⫹T cell subsets
(
73
,
75
). We harvested splenocytes from WT and
MDA5
⫺/⫺mice
7 days after WNV infection and performed immunophenotyping
analysis. Cells were stained with antibodies to detect T cells (CD3,
CD4, and CD8), their migratory capacity (CD43 and CD62L),
state of differentiation or exhaustion (KLRG1 and PD1), and
pro-duction of effector molecules (IFN-
␥
, TNF-
␣
, and granzyme B)
FIG 3Type I IFN and inflammatory responses to WNV infection in WT andMDA5⫺/⫺mice. Mice were infected with 102PFU of WNV in the footpad. (A) Type
I IFN activity in serum was measured by an ECMV cytopathic effect bioassay. (B) Cells were incubated with an anti-IFNAR or control MAb prior to treatment with IFN-␣and ECMV infection. Cell survival was measured by a colorimetric assay. OD492, optical density at 492 nm. (C) Cells were incubated with an
anti-IFNAR or control MAb prior to measurement of type I IFN activity in serum by ECMV cytopathic effect bioassay. (D to F) Cytokine and chemokine levels in serum were measured by Bio-Plex assay. Results represent means⫾SEMs of 5 mice per group; dotted lines represent the limit of sensitivity of the assay.*,
P⬍0.05.
MDA5 Controls WNV Pathogenesis
on November 7, 2019 by guest
http://jvi.asm.org/
[image:5.585.113.473.65.337.2]TABLE 1 Serum cytokine levels after WNV infection of WT and MDA5 ⫺ / ⫺ mice Cytokine LOD b Value on indicated day postinfection a 012 4 Cytokine level (pg/ml) P Cytokine level (pg/ml) P Cytokine level (pg/ml) P Cytokine level (pg/ml) P WT MDA5 ⫺ / ⫺ WT MDA5 ⫺ / ⫺ WT MDA5 ⫺ / ⫺ WT MDA5 ⫺ / ⫺ IL-1 ␣ 19.2 55.1 (8.1) 41.6 (3.5) 0.16 70.7 (6.8) 49.4 (4.6) 0.03 55.6 (4.2) 64.7 (9.9) 0.42 47.2 (5.1) 72.3 (15.2) 0.20 IL-1  37.4 431.2 (101.1) 407.1 (132.4) 0.89 476.2 (55.6) 277.9 (105.5) 0.14 373.2 (147.9) 533.4 (50.5) 0.34 402.5 (126.6) 647.4 (69.2) 0.11 IL-2 49.9 164.2 (23.2) 133.6 (20.0) 0.35 163.1 (19.2) 148.0 (23.3) 0.63 173.7 (15.7) 177.3 (21.6) 0.90 152.8 (37.4) 150.0 (12.1) 0.94 IL-3 1.4 16.0 (4.7) 7.6 (4.2) 0.22 16.1 (6.7) 12.9 (4.6) 0.70 20.5 (4.2) 20.2 (6.3) 0.96 17.4 (9.3) 18.7 (3.9) 0.90 IL-4 5.4 5.4 (0.0) 5.4 (0.0) 1.00 5.4 (0.0) 5.4 (0.0) 1.00 5.4 (0.0) 5.4 (0.0) 1.00 5.4 (0.0) 5.4 (0.0) 1.00 IL-5 11.5 124.9 (28.6) 61.7 (30.2) 0.17 114.3 (30.6) 92.8 (27.4) 0.61 135.6 (20.7) 127.9 (23.0) 0.81 101.5 (49.0) 119.5 (18.6) 0.72 IL-6 3.6 29.9 (6.8) 17.9 (10.1) 0.35 37.3 (5.4) 22.8 (6.0) 0.11 42.3 (9.7) 48.9 (16.5) 0.74 19.9 (9.5) 30.3 (3.4) 0.30 IL-9 80.1 225.4 (89.1) 184.4 (50.6) 0.70 230.6 (32.8) 183.4 (57.9) 0.50 248.8 (74.2) 315.4 (65.3) 0.52 178.7 (87.2) 195.0 (70.8) 0.89 IL-10 11.4 186.2 (57.5) 70.0 (24.6) 0.10 182.0 (45.6) 128.9 (35.1) 0.38 206.7 (43.7) 218.7 (29.1) 0.83 166.5 (73.7) 202.3 (24.9) 0.63 IL-12 (p40) 16.4 143.5 (19.9) 156.5 (27.7) 0.71 151.5 (9.8) 119.1 (15.3) 0.11 172.1 (19.5) 207.2 (16.1) 0.20 174.9 (32.0) 155.5 (18.0) 0.59 IL-12 (p70) 27.1 176.1 (30.4) 104.6 (33.5) 0.15 160.7 (21.7) 141.4 (22.9) 0.56 195.5 (29.5) 214.8 (29.3) 0.65 155.9 (47.3) 188.9 (14.5) 0.48 IL-13 95.0 394.2 (101.5) 207.9 (113.0) 0.25 284.1 (126.3) 212.1 (60.1) 0.62 393.0 (113.7) 365.1 (123.0) 0.87 345.0 (152.9) 421.4 (96.8) 0.67 IL-17 10.2 90.3 (20.4) 40.7 (22.5) 0.14 83.9 (18.5) 84.0 (21.0) 1.00 124.2 (20.3) 146.4 (10.1) 0.36 87.9 (24.0) 118.3 (11.5) 0.26 Eotaxin 64.3 729.5 (242.7) 862.9 (311.5) 0.74 996.9 (362.9) 758.4 (272.1) 0.61 813.2 (308.0) 1,181.6 (260.5) 0.39 777.7 (445.7) 949.7 (282.5) 0.74 G-CSF c 48.2 218.2 (63.4) 115.3 (27.1) 0.17 200.8 (20.1) 182.0 (32.7) 0.64 162.4 (27.0) 181.2 (50.5) 0.75 147.0 (33.6) 170.9 (12.1) 0.49 GM-CSF d 18.2 347.8 (101.4) 316.4 (118.2) 0.85 529.2 (91.5) 378.0 (125.6) 0.36 422.9 (128.8) 556.4 (76.7) 0.40 422.7 (162.7) 544.1 (61.7) 0.47 IFN-␥ 6.3 6.3 (0.0) 6.3 (0.0) 1.00 6.3 (0.0) 6.3 (0.0) 1.00 6.3 (0.0) 6.3 (0.0) 1.00 6.3 (0.0) 6.3 (0.0) 1.00 KC 9.1 159.3 (52.5) 238.6 (131.9) 0.59 111.6 (11.8) 99.7 (25.6) 0.68 105.9 (20.0) 136.9 (30.7) 0.42 112.9 (29.7) 150.1 (20.8) 0.33 MCP-1 75.2 334.5 (73.7) 171.8 (86.1) 0.19 319.6 (73.5) 268.8 (60.2) 0.61 444.0 (91.1) 450.8 (121.8) 0.97 345.2 (157.6) 442.1 (87.3) 0.59 MIP-1 ␣ 10.1 36.5 (8.1) 24.6 (7.9) 0.32 34.8 (5.2) 32.3 (10.5) 0.83 33.3 (7.2) 57.9 (17.8) 0.24 22.2 (7.4) 27.8 (3.6) 0.49 MIP-1  31.9 254.7 (64.5) 102.5 (70.6) 0.15 333.7 (65.6) 214.3 (61.5) 0.22 343.1 (49.5) 510.8 (171.8) 0.38 256.9 (113.1) 320.9 (37.5) 0.57 RANTES 3.1 40.2 (7.3) 33.2 (8.2) 0.54 63.2 (4.3) 59.9 (9.2) 0.76 69.7 (7.1) 89.5 (4.7) 0.05 56.6 (18.2) 50.9 (7.0) 0.75 TNF-␣ 36.3 1,204.7 (202.3) 724.5 (220.2) 0.15 1,177.3 (202.2) 900.7 (162.3) 0.32 1,428.7 (205.4) 1,676.2 (247.6) 0.46 1,151.8 (311.6) 1,283.6 (106.4) 0.6 7 aMice were infected with 10 2PFU of WNV in the footpad. Serum was collected at 1, 2, and 4 days after infection and from naive mice (day 0), and the indicated cytokines were measured by Bio-Plex array. Data represent the means (SEMs) of 5 mice per group. bLOD, limit of detection. cG-CSF, granulocyte colony-stimulating factor. dGM-CSF, granulocyte-macrophage colony-stimulating factor.
on November 7, 2019 by guest
http://jvi.asm.org/
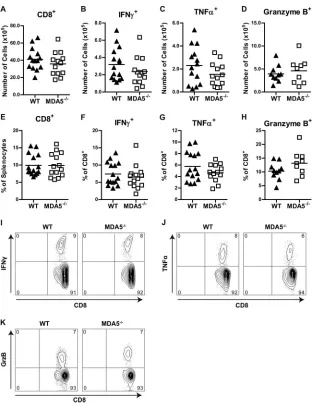
after WNV peptide restimulation. In addition, we measured
anti-gen-presenting cells and their state of activation (B220, CD45,
CD11b, CD11c, CD80, CD86, and MHC-II) as well as regulatory
T cells (CD25 and FoxP3). Notably, we observed no marked
dif-ferences in the quality and quantity of these leukocyte responses
between WT and
MDA5
⫺/⫺mice after WNV infection (
Fig. 6
and
Tables 2
and
3
), even when 10- or 100-fold-higher doses of virus
were used (data not shown). In general, there was little difference
in the numbers or percentages of WNV-specific CD8
⫹T cells. We
did observe, however, higher KLRG1 and CD62L expression on
MDA5
⫺/⫺CD8
⫹IFN-
␥
⫹and CD8
⫹TNF-
␣
⫹cells, suggesting
that there may be some functional differences compared to WT
cells.
Although leukocyte function appeared relatively intact in
spleens from
MDA5
⫺/⫺mice, it remained possible that the
viro-logic phenotype in the CNS was due to impaired leukocyte
traf-ficking across the BBB or altered function of cells within the CNS.
Therefore, we performed a similar analysis on leukocytes in the
FIG 5Antibody responses in infected WT andMDA5⫺/⫺mice. Serum IgM
(A) and IgG (B) against WNV E protein were measured by ELISA. Results represent the means⫾SEMs of 6 to 10 mice per group. *,P⬍0.05.
FIG 4Cytokine expression in brains of WNV-infected WT andMDA5⫺/⫺mice. Mice were infected with 102PFU of WNV in the footpad. Brains were harvested at 8
days after infection, and the indicated cytokines and chemokines were assessed by Luminex array. Data are shown as the means⫾SEMs of 9 mice per group. *,P⬍0.05.
MDA5 Controls WNV Pathogenesis
on November 7, 2019 by guest
http://jvi.asm.org/
[image:7.585.60.266.516.692.2]brain at day 7 after WNV infection. Again, relatively few
differ-ences were observed in the infiltrating immune cells in the brains
of
MDA5
⫺/⫺mice compared to WT mice (
Fig. 7
and
Tables 4
and
5
), and higher infecting doses of WNV did not reveal any marked
changes (data not shown). There was no significant difference in
the number or percentage of WNV-specific CD8
⫹T cells in the
brain, although
MDA5
⫺/⫺mice had higher numbers and
percent-ages of CD45
⫹CD11b
⫹macrophages. One notable difference was
FIG 6(A to H) Immunophenotyping of splenocytes from infected WT andMDA5⫺/⫺mice. Mice were infected with 102PFU of WNV in the footpad. Splenocytes were
[image:8.585.136.450.63.466.2]harvested and analyzed by flow cytometry at 7 days after infection. Numbers (A to D) and percentages (E to H) of the indicated populations are shown; symbols represent individual mice. CD8⫹, IFN-␥⫹, and TNF-␣⫹populations represent cells that were restimulated with an immunodominant WNV peptide. (I to K) Representative flow cytometry plots of IFN-␥⫹, TNF-␣⫹, and granzyme B⫹cell populations. Numbers indicate the percentage of cells in each quadrant.
TABLE 2Phenotypes of splenocytes in WT andMDA5⫺/⫺mice after WNV infectiona
Phenotype
Total no. of cells
P
% of gated cells
P Type of gated cell
WT MDA5⫺/⫺ WT MDA5⫺/⫺
CD4⫹ 2.3⫻107(2.2⫻106) 2.3⫻107(2.0⫻106) 0.86 16.8 (0.7) 16.9 (1.1) 0.98 Splenocytes
CD4⫹CD25⫹FoxP3⫹ 2.5⫻106(3.3⫻105) 2.6⫻106(2.8⫻105) 0.78 10.2 (0.6) 11.6 (0.6) 0.12 CD4⫹T cells
CD8⫹ 4.1⫻106(3.4⫻105) 3.6⫻106(3.8⫻105) 0.30 9.9 (0.8) 9.9 (0.9) 0.99 Splenocytes
IFN-␥⫹ 3.2⫻105(4.8⫻104) 2.4⫻105(4.5⫻104) 0.23 7.4 (0.9) 6.5 (0.9) 0.47 CD8⫹T cells
TNF-␣⫹ 2.0⫻105(4.3⫻104) 1.5⫻105(2.8⫻104) 0.15 5.8 (0.7) 4.7 (0.4) 0.18 CD8⫹T cells
Granzyme B⫹ 4.0⫻105(5.8⫻104) 4.6⫻105(9.3⫻104) 0.55 10.3 (1.0) 13.1 (1.6) 0.14 CD8⫹T cells aMice were infected with 102PFU of WNV in the footpad. Splenocytes were harvested and analyzed by flow cytometry at day 7 after infection. Numbers and percentages of the indicated populations are shown as means (SEMs) of approximately 15 mice per group. CD8⫹, IFN-␥⫹, and TNF-␣⫹populations represent cells that were restimulated with an immunodominant WNV peptide.
on November 7, 2019 by guest
http://jvi.asm.org/
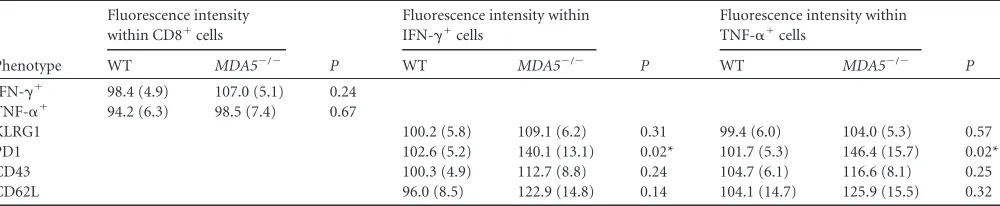
[image:8.585.39.549.605.696.2]that CD8
⫹IFN-
␥
⫹and CD8
⫹TNF-
␣
⫹cells from the brains of
MDA5
⫺/⫺mice had higher expression of the exhaustion marker
PD1 than did cells from WT mice. Nonetheless,
MDA5
⫺/⫺WNV-specific CD8
⫹T cells in the brain had no relative change in the
expression of KLRG1, CD43, CD62L, IFN-
␥
, or TNF-
␣
. We also
examined the localization of CD3
⫹cells in the brains of infected
WT and
MDA5
⫺/⫺mice by confocal microscopy. In the cerebral
cortex and cerebellum,
MDA5
⫺/⫺T cells were present in the
pa-renchyma and showed no evidence of perivascular retention (data
not shown), indicating that the increased CNS titers observed in
MDA5
⫺/⫺mice were not due to impaired trafficking of the
anti-gen-specific T cells responsible for CNS clearance.
Adoptive-transfer experiments.
While priming in the
periph-ery and trafficking of antigen-specific CD8
⫹T cells into the brains
of
MDA5
⫺/⫺mice appeared normal, we observed subtle
differ-ences in some phenotypic markers, which in theory could
influ-ence virus clearance. To establish the role of MDA5 in T cell
prim-ing or effector activity, we performed two adoptive-transfer
experiments. In the first experiment, WNV-primed CD8
⫹T cells
from WT and
MDA5
⫺/⫺mice were transferred into infected
CD8
⫺/⫺mice, allowing us to assess the function in a common
MDA5
⫹/⫹environment of cells that were primed in the presence
or absence of MDA5. In the second experiment, we transferred
naive WT or
MDA5
⫺/⫺CD8
⫹T cells to assess their function when
primed in a common
MDA5
⫹/⫹environment.
To test whether CD8
⫹T cells primed in an
MDA5
⫺/⫺environ-TABLE 3Phenotypes of antigen-specific CD8⫹T cells in the spleens of WT andMDA5⫺/⫺mice after WNV infectiona
Phenotype
Fluorescence intensity within
IFN-␥⫹cells
P
Fluorescence intensity within
TNF-␣⫹cells
P
WT MDA5⫺/⫺ WT MDA5⫺/⫺
KLRG1 102.2 (3.5) 132.0 (5.2) 0.00005* 100.3 (3.2) 117.9 (7.9) 0.044*
PD1 102.9 (4.4) 123.3 (9.1) 0.05 96.3 (3.0) 108.3 (6.8) 0.11
CD43 104.5 (6.8) 110.4 (8.7) 0.59 100.4 (5.9) 92.1 (5.2) 0.30
CD62L 103.3 (4.5) 112.8 (6.7) 0.24 111.0 (9.2) 138.5 (9.7) 0.049*
aMice were infected with 102PFU of WNV in the footpad. Splenocytes were harvested and analyzed by flow cytometry at 7 days after infection. Values indicate the geometric mean fluorescence intensity of the indicated phenotypic marker within IFN-␥⫹or TNF-␣⫹populations, shown as means (SEMs) of approximately 15 mice per group. Asterisk indicates significant differences between WT andMDA5⫺/⫺cells.
FIG 7(A to F) Immunophenotyping of brain leukocytes in infected WT andMDA5⫺/⫺mice. Mice were infected with 102PFU of WNV in the footpad. Brains
were harvested and analyzed by flow cytometry at 7 days after infection. Numbers (A to C) and percentages (D to F) of the indicated populations are shown; symbols represent individual mice. CD8⫹, IFN-␥⫹, and TNF-␣⫹populations represent cells that were restimulated with an immunodominant WNV NS4B peptide. (G and H) Representative flow cytometry plots of IFN-␥⫹and TNF-␣⫹populations. Numbers indicate the percentage of cells in each quadrant.
MDA5 Controls WNV Pathogenesis
on November 7, 2019 by guest
http://jvi.asm.org/
[image:9.585.38.545.77.159.2] [image:9.585.135.455.370.683.2]ment were functionally equivalent to their WT counterparts, we
isolated primed donor CD8
⫹T cells from WT and
MDA5
⫺/⫺mice at 7 days after WNV infection and transferred them into
recipient
CD8
⫺/⫺mice that had been infected with WNV 1 day
earlier. We confirmed that WNV-infected WT and
MDA5
⫺/⫺mice had equivalent percentages of CD8
⫹splenocytes (
Fig. 8A
),
that this proportion was enriched following positive selection
(
Fig. 8B
), and that similar numbers and percentages of
antigen-specific WT and
MDA5
⫺/⫺CD8
⫹T cells were transferred (
Fig.
8C
). Nine days following adoptive transfer (10 days after WNV
infection), we measured tissue viral loads in recipient
CD8
⫺/⫺mice. Although mice that received WT CD8
⫹T cells had no
de-tectable WNV in the CNS or the spleen, those receiving
MDA5
⫺/⫺CD8
⫹T cells failed to control CNS infection even though virus
was cleared from the spleen (
Fig. 8D
). These results demonstrate
that CD8
⫹T cells primed in
MDA5
⫺/⫺mice have functional
def-icits relative to cells primed in WT mice. This produces a
cell-intrinsic defect of
MDA5
⫺/⫺CD8
⫹T cells that results in an
in-ability to clear WNV infection in the CNS, even when transferred
into an
MDA5
⫹/⫹environment.
What remained unclear was whether the defect of
MDA5
⫺/⫺CD8
⫹T cell function was cell autonomous and due to a direct
requirement for MDA5 in the T cell itself or non-cell autonomous
and due to a defective
MDA5
⫺/⫺priming environment. To
ad-dress this, we isolated naive CD8
⫹T cells from WT and
MDA5
⫺/⫺mice and transferred them into
MDA5
⫹/⫹animals prior to WNV
infection. As transfers of naive cells into
CD8
⫺/⫺mice were
inef-ficient (data not shown), we used
TCR
␣
⫺/⫺mice as recipients.
Along with CD8
⫹cells, we also transferred naive WT CD4
⫹cells,
as
TCR
␣
⫺/⫺mice lack both CD8
⫹and CD4
⫹cells, and
CD4-mediated help is necessary for sustaining CD8-CD4-mediated clearance
of WNV from the CNS (
76
). One day following adoptive transfer,
recipient mice were infected with WNV and infiltrating
lympho-cytes were assessed in the brain at 9 days after infection. We
de-tected equivalent percentages and numbers of CD8
⫹and WNV
antigen-specific cells in the brains of mice receiving WT versus
MDA5
⫺/⫺CD8
⫹cells (
Fig. 9A
and
B
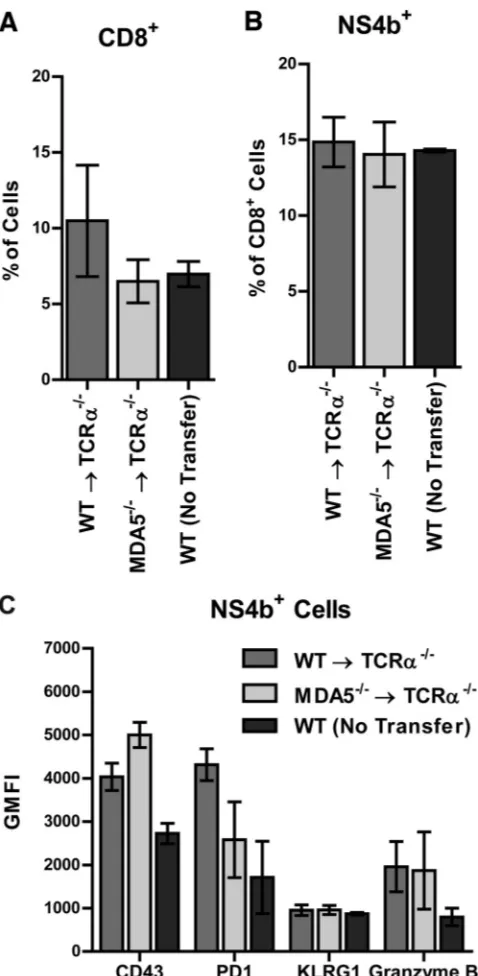
and data not shown).
Fur-thermore, we did not detect any significant difference in
expres-sion of phenotypic markers, including CD43, PD1, KLRG1, or
granzyme B, in the recipient mice (
Fig. 9C
and data not shown).
These observations imply that WT and
MDA5
⫺/⫺CD8
⫹cells are
phenotypically equivalent after priming in an
MDA5
⫹/⫹environ-ment. Our results suggest that the inability of
MDA5
⫺/⫺CD8
⫹cells to control WNV infection in the CNS in
MDA5
⫺/⫺mice
reflects a non-cell-autonomous role for MDA5 in proper CD8
⫹T
cell priming.
DISCUSSION
While prior studies established that RLR signaling is critical for
controlling WNV pathogenesis (
31
), the relative contributions of
RIG-I and MDA5 to sensing WNV infection and coordinating
innate and adaptive immune responses
in vivo
have remained
un-clear. Here, we established that in the context of WNV infection,
an absence of MDA5
in vivo
resulted in increased lethality and
higher viral loads in the CNS than in WT mice. Somewhat
unex-pectedly, MDA5 did not have a dominant direct role in restricting
viral replication in peripheral tissues or neurons, and the systemic
IFN response to WNV remained intact. Instead, the increased
WNV titers in the CNS of
MDA5
⫺/⫺mice were linked to a
[image:10.585.40.550.78.180.2]quali-tative defect of
MDA5
⫺/⫺CD8
⫹T cells in clearing infection from
TABLE 4Phenotypes of brain leukocytes in WT andMDA5⫺/⫺mice after WNV infectiona
Phenotype
Total no. of cells
P
Percentage of gated cells
P Type of gated cell
WT MDA5⫺/⫺ WT MDA5⫺/⫺
CD4⫹ 9.4⫻104(1.4⫻104) 1.1⫻105(1. 8⫻104) 0.47 5. 8 (0.6) 5.5 (0.6) 0.72 Total
CD4⫹CD25⫹FoxP3⫹ 5.1⫻103(1.2⫻103) 7.9⫻103(2.4⫻103) 0.31 5.4 (1.0) 6.6 (1.0) 0.39 CD4⫹T cells
CD8⫹ 2.0⫻105(3.6⫻104) 3.6⫻105(8.0⫻104) 0.09 12.3 (1.7) 16.5 (2.0) 0.12 Total
IFN-␥⫹ 7.4⫻104(1.6⫻104) 1.5⫻105(4.0⫻104) 0.09 34.6 (3.0) 39.4 (2.5) 0.24 CD8⫹T cells
TNF-␣⫹ 3.7⫻104(8.9⫻103) 7.8⫻104(2.3⫻104) 0.12 27.5 (3.4) 28.8 (2.7) 0.76 CD8⫹T cells
CD45loCD11b⫹(microglia) 4.2⫻105(7.2⫻104) 4.5⫻105(9.8⫻104) 0.80 24.1 (2.9) 19.0 (1.7) 0.16 Total
CD45hiCD11b⫹(macrophages) 3.3⫻105(3.8⫻104) 6.1⫻105(1.1⫻105) 0.03* 18.6 (2.0) 27.3 (0.9) 0.002* Total
aMice were infected with 102PFU of WNV in the footpad. Brains were harvested and analyzed by flow cytometry at 7 days after infection. Numbers and percentages of the indicated populations are shown as means (SEMs) of 8 mice per group. CD8⫹, IFN-␥⫹, and TNF-␣⫹populations represent cells that were restimulated with an immunodominant WNV peptide. Asterisk indicates significant differences between WT andMDA5⫺/⫺cells.
TABLE 5Phenotype of antigen-specific CD8⫹T cells in the brains of WT andMDA5⫺/⫺mice after WNV infectiona
Phenotype
Fluorescence intensity within CD8⫹cells
P
Fluorescence intensity within IFN-␥⫹cells
P
Fluorescence intensity within TNF-␣⫹cells
P
WT MDA5⫺/⫺ WT MDA5⫺/⫺ WT MDA5⫺/⫺
IFN-␥⫹ 98.4 (4.9) 107.0 (5.1) 0.24 TNF-␣⫹ 94.2 (6.3) 98.5 (7.4) 0.67
KLRG1 100.2 (5.8) 109.1 (6.2) 0.31 99.4 (6.0) 104.0 (5.3) 0.57
PD1 102.6 (5.2) 140.1 (13.1) 0.02* 101.7 (5.3) 146.4 (15.7) 0.02*
CD43 100.3 (4.9) 112.7 (8.8) 0.24 104.7 (6.1) 116.6 (8.1) 0.25
CD62L 96.0 (8.5) 122.9 (14.8) 0.14 104.1 (14.7) 125.9 (15.5) 0.32
aMice were infected with 102PFU of WNV in the footpad. Brains were harvested and analyzed by flow cytometry at 7 days after infection. Values indicate the geometric mean fluorescence intensity of the indicated activation or phenotypic marker within CD8⫹, IFN-␥⫹, or TNF-␣⫹populations, shown as means (SEMs) of 8 mice per group. Asterisk indicates significant differences between WT andMDA5⫺/⫺cells.
on November 7, 2019 by guest
http://jvi.asm.org/
[image:10.585.44.544.594.697.2]the brain and spinal cord. Since WT and
MDA5
⫺/⫺CD8
⫹T cells
were primed equivalently in an
MDA5
⫹/⫹host, we surmise that
MDA5 functions in other cell types to optimally activate CD8
⫹T
cells to control WNV infection in the CNS.
Although we observed increased WNV-induced lethality in
MDA5
⫺/⫺mice, this phenotype was less pronounced than that
observed in
MAVS
⫺/⫺mice, which lack all RLR signaling; this is
most apparent in the mean times to death of the animals (7 days
for
MAVS
⫺/⫺versus 11 days for
MDA5
⫺/⫺mice) (
31
).
MAVS
⫺/⫺mice are less vulnerable to WNV infection than
IRF-3
⫺/⫺⫻
IRF-5
⫺/⫺⫻
IRF-7
⫺/⫺mice, which are defective at producing type I
IFN, or
IFNAR
⫺/⫺mice, which cannot respond to it (
77–79
).
These differences in susceptibility highlight the considerable
re-dundancy present in the pathogen-sensing and downstream
sig-nal transduction pathways responsible for initiating the antiviral
response. While infections with some viruses, particularly
pi-cornaviruses and murine norovirus (
22–24
) and possibly
coro-naviruses (
25
,
26
), are sensed largely or exclusively by MDA5,
in the context of WNV infection, RIG-I, TLRs, or possibly
other PRRs can compensate to some degree for the loss of
MDA5 (
57
,
59–61
,
63
).
We expected that as a cytoplasmic PRR, MDA5 would act
partly in a cell-intrinsic manner to restrict WNV replication, as
has been reported after infection with other RNA viruses (
24
,
27
).
We failed to observe increased WNV replication in
MDA5
⫺/⫺primary neurons or following direct introduction of the virus into
the brain, even though the most prominent viral phenotype after
subcutaneous infection was observed in the CNS. This phenotype
could reflect functional redundancy with RIG-I in neurons or a
lack of expression of MDA5. MDA5 is not expressed in uninfected
cortical neurons in culture, and relatively low levels were detected
by Western blotting at 24 h after WNV infection compared to
levels in myeloid cells (
80
). Cerebellar granule cell neurons express
higher levels of MDA5 following WNV infection than do cortical
neurons (
81
) yet also showed no increase in viral replication in
MDA5
⫺/⫺cells. It remains possible that a cell-intrinsic antiviral
effect of MDA5 on WNV occurs in other cell types (e.g., myeloid
cell subsets), which could explain the small increase in viremia
observed in
MDA5
⫺/⫺mice.
Surprisingly, we observed no defects in type I IFN production
in
MDA5
⫺/⫺mice in response to WNV infection. In the study
described in our
accompanying paper
(
82
), MDA5 has been
de-fined as a PRR sensing “late”-stage viral RNA replication products
of WNV infection, whereas RIG-I serves as the primary or early
initiator of innate immune signaling. Indeed, mice lacking MDA5
and infected with WNV produced slightly higher levels of type I
IFN that correlated with increased viremia, suggesting that the loss
of late PRR signaling in the absence of MDA5 supports increased
viremia and higher levels of viral PAMPs that trigger increased
levels of type I IFN production via alternate PRRs. This outcome
contrasts data from other viral infections of
MDA5
⫺/⫺mice: type
FIG 8Adoptive transfer of primed donor WT orMDA5⫺/⫺CD8⫹T cells into
recipient infectedCD8⫺/⫺mice. WT andMDA5⫺/⫺mice were infected with
102PFU of WNV in the footpad. At 7 days after infection, CD8⫹T cells were
purified from splenocytes by positive selection and transferred intoCD8⫺/⫺
mice which had been infected with WNV 1 day prior. (A and B) Flow
cytometry plots showing percentages of CD8⫹cells from WT andMDA5⫺/⫺
splenocytes (A) and following positive selection of CD8⫹cells (B). Filled gray plots represent isotype control staining, while open plots represent anti-CD8 staining. (C) Flow cytometry plots showing percentages of WNV antigen-specific CD8⫹cells from WT andMDA5⫺/⫺mice. (D) Tissues were harvested
fromCD8⫺/⫺mice at 10 days after infection and viral burden was measured by
plaque assay. Results represent the means⫾SEMs of 6 mice per group; dotted lines represent the limit of sensitivity of the assay. ****,P⬍0.0001.
MDA5 Controls WNV Pathogenesis
on November 7, 2019 by guest
http://jvi.asm.org/
[image:11.585.42.281.74.674.2]I IFN induction was reduced following infection with ECMV,
TMEV, CBV, rhinovirus, SeV, HMPV, and LCMV (
22
,
34
,
39–43
,
72
,
73
). In these cases, MDA5 likely serves as a primary PRR of
innate immune signaling such that an insufficient type I IFN
re-sponse contributes directly to enhanced viral pathogenesis.
Con-sistent with our results, type I IFN production was sustained in
MDA5
⫺/⫺mice infected with Japanese encephalitis virus, a closely
related flavivirus (
22
). As we observed increased lethality in
MDA5
⫺/⫺mice after WNV infection in the context of sustained
type I IFN production and a relatively similar peripheral viral
burden, WNV appears to be controlled by a distinct
MDA5-de-pendent pathway.
Although
MDA5
⫺/⫺mice have blunted type I IFN responses to
some viral infections, augmented inflammatory responses have
been reported, which may contribute to the pathology observed in
virus-infected
MDA5
⫺/⫺mice (
41
,
43
). We observed increased
accumulation of some inflammatory cytokines and chemokines
(i.e., MIP-1

, IL-12, RANTES, and TNF-
␣
) in the brains of
MDA5
⫺/⫺mice, consistent with the increased CNS inflammation
observed in
MAVS
⫺/⫺mice following WNV infection (
31
). The
effects of these cytokines on WNV infection and pathogenesis in
the CNS are not clear. Clearance of WNV from the CNS requires
the recruitment of CD8
⫹T cells (
53
) and their effector cytokines
and functions (
74
,
83–86
), so an increase of inflammatory
cyto-kines may reflect an appropriate immune response to greater viral
replication in the CNS of
MDA5
⫺/⫺mice, rather than
immuno-pathology. Indeed, the numbers and proportions of
antigen-spe-cific and nonspeantigen-spe-cific immune cells in the brains of
MDA5
⫺/⫺mice
were largely unchanged compared to those in WT animals, even in
the context of increased viral load in the CNS, arguing against a
dysregulated inflammatory response. While an increase in
inflam-matory cytokines was seen in
MDA5
⫺/⫺mice after WNV, TMEV,
and HMPV infection, reduced levels of several proinflammatory
cytokines were observed after infection with rhinovirus and SeV
(
40–43
). This variable role for MDA5 in inflammatory cytokine
induction in response to different viral infections may reflect the
specific PRR interactions or cellular tropism of each virus.
While the numbers and percentages of infiltrating immune
cells in the CNS of WNV-infected
MDA5
⫺/⫺mice were similar to
those in WT mice,
MDA5
⫺/⫺CD8
⫹T cells showed increased
expression of the exhaustion marker PD-1, which also was
ob-served in
MDA5
⫺/⫺mice infected with TMEV (
43
). The
relation-ship between PD-1 expression and the function of CNS CD8
⫹T
cells in the absence of differences in intracellular cytokine (IFN-
␥
or TNF-
␣
) expression remains unclear. This phenotype, however,
correlated with an intrinsic defect of primed
MDA5
⫺/⫺CD8
⫹T
cells to control WNV infection in the CNS of recipient
MDA5
⫹/⫹CD8
⫺/⫺mice. When naive
MDA5
⫺/⫺CD8
⫹T cells were primed
in an
MDA5
⫹/⫹environment, no phenotypic differences were
observed, suggesting that MDA5 likely is required during the
priming process to shape CD8
⫹T cells to function effectively in
the CNS. In comparison, in other viral infection models, a
defi-ciency of MDA5 had distinct effects on the CD8
⫹T cell
compart-ment.
MDA5
⫺/⫺mice had fewer antigen-specific CD8
⫹T cells
following LCMV infection, although these cells were functional
both
ex vivo
and following adoptive transfer to WT mice (
73
). The
quantitative CD8
⫹T cell defects observed in LCMV-infected
MDA5
⫺/⫺mice could be reversed by administration of exogenous
type I IFN, suggesting that they occurred secondary to blunted
IFN production and are thus unlikely to apply in the context of
sustained IFN production that we observed during WNV
infec-tion. A T cell-extrinsic role for MDA5 is supported by another
study in which MDA5 expression in nonhematopoietic cells
en-FIG 9Adoptive transfer of naive donor WT orMDA5⫺/⫺CD8⫹T cells into
recipientTCR␣⫺/⫺mice. CD8⫹and CD4⫹T cells were purified by positive
selection from naive WT orMDA5⫺/⫺splenocytes. WT orMDA5⫺/⫺CD8⫹
cells were transferred with WT CD4⫹cells toTCR␣⫺/⫺mice. Recipient mice
were infected with 102PFU of WNV 1 day following adoptive transfer, and
tissues were harvested 9 days after infection. Brains were analyzed by flow cytometry. Percentages of CD8⫹(A) and WNV antigen-specific (B) infiltrat-ing cells are shown. (C) Expression of CD43, PD1, KLRG1, and granzyme B was measured on NS4B tetramer-positive cells. Results represent the means⫾ SEMs of 6 mice per group.
on November 7, 2019 by guest
http://jvi.asm.org/
[image:12.585.44.283.64.552.2]hanced survival of antigen-specific CD8
⫹effector T cells and
de-velopment into memory cells (
75
).
MDA5 is not the only RLR that regulates CD8
⫹T cell function.
CD8
⫹T cell dysfunction in
LGP2
⫺/⫺mice also contributed to
WNV pathogenesis, and this was associated with effects on CD8
⫹T cell death receptor-induced apoptosis through an
uncharacter-ized signaling pathway that was independent of MAVS (
38
). As
LGP2 physically interacts with MDA5 (
6
,
7
), it is conceivable that
the observed CD8
⫹T cell phenotypes in
MDA5
⫺/⫺mice result
from MAVS-independent interactions with unbound LGP2,
rather than through the canonical RLR signaling pathway. Future
studies with
MDA5
⫺/⫺⫻
LGP2
⫺/⫺mice and animals with cell
type-restricted deletion of MDA5 are planned to address the
spe-cific mechanism by which MDA5 regulates CD8
⫹T cell function
against WNV and other viruses.
ACKNOWLEDGMENTS
NIH grants U54 AI081680 (Pacific Northwest Regional Center of Excel-lence for Biodefense and Emerging Infectious Diseases Research), U19 AI083019 (M.G. and M.S.D.), PCTAS AI083019-02S1 (H.M.L.), and R01 AI104002 (M.G. and M.S.D.) supported this work. H.M.L. was supported by an NIH training grant, T32-AI007172.
We thank Kristy Szretter for help in preparing brain samples for cyto-kine analysis, Tracy Jo Pasieka for assistance with Bio-Plex analysis of serum cytokines, and M. Colonna and T. Egawa for providingMDA5⫺/⫺
andTCR␣⫺/⫺mice, respectively. We also thank the NIH Tetramer Core
Facility at Emory University for providing NS4B-specific tetramers.
REFERENCES
1.Wilkins C, Gale M, Jr. 2010. Recognition of viruses by cytoplasmic sensors. Curr. Opin. Immunol.22:41– 47.
2.Rathinam VA, Fitzgerald KA.2011. Cytosolic surveillance and antiviral immunity. Curr. Opin. Virol.1:455– 462.
3.Takeuchi O, Akira S.2008. MDA5/RIG-I and virus recognition. Curr. Opin. Immunol.20:17–22.
4.Takeuchi O, Akira S.2010. Pattern recognition receptors and inflamma-tion. Cell140:805– 820.
5.Sarkar D, Desalle R, Fisher PB. 2008. Evolution of MDA-5/RIG-I-dependent innate immunity: inMDA-5/RIG-I-dependent evolution by domain grafting. Proc. Natl. Acad. Sci. U. S. A.105:17040 –17045.
6.Saito T, Hirai R, Loo YM, Owen D, Johnson CL, Sinha SC, Akira S, Fujita T, Gale M, Jr.2007. Regulation of innate antiviral defenses through a shared repressor domain in RIG-I and LGP2. Proc. Natl. Acad. Sci. U. S. A.104:582–587.
7.Komuro A, Horvath CM.2006. RNA- and virus-independent inhibition of antiviral signaling by RNA helicase LGP2. J. Virol.80:12332–12342. 8.Satoh T, Kato H, Kumagai Y, Yoneyama M, Sato S, Matsushita K,
Tsujimura T, Fujita T, Akira S, Takeuchi O.2010. LGP2 is a positive regulator of RIG-I- and MDA5-mediated antiviral responses. Proc. Natl. Acad. Sci. U. S. A.107:1512–1517.
9.Venkataraman T, Valdes M, Elsby R, Kakuta S, Caceres G, Saijo S, Iwakura Y, Barber GN.2007. Loss of DExD/H box RNA helicase LGP2 manifests disparate antiviral responses. J. Immunol.178:6444 – 6455. 10. Rothenfusser S, Goutagny N, DiPerna G, Gong M, Monks BG,
Schoen-emeyer A, Yamamoto M, Akira S, Fitzgerald KA. 2005. The RNA helicase Lgp2 inhibits TLR-independent sensing of viral replication by retinoic acid-inducible gene-I. J. Immunol.175:5260 –5268.
11. Rehwinkel J, Tan CP, Goubau D, Schulz O, Pichlmair A, Bier K, Robb N, Vreede F, Barclay W, Fodor E, Reis e Sousa C.2010. RIG-I detects viral genomic RNA during negative-strand RNA virus infection. Cell140:
397– 408.
12. Pichlmair A, Schulz O, Tan CP, Naslund TI, Liljestrom P, Weber F, Reis e Sousa C. 2006. RIG-I-mediated antiviral responses to single-stranded RNA bearing 5=-phosphates. Science314:997–1001.
13. Kato H, Takeuchi O, Mikamo-Satoh E, Hirai R, Kawai T, Matsushita K, Hiiragi A, Dermody TS, Fujita T, Akira S.2008. Length-dependent recognition of double-stranded ribonucleic acids by retinoic
acid-inducible gene-I and melanoma differentiation-associated gene 5. J. Exp. Med.205:1601–1610.
14. Baum A, Sachidanandam R, Garcia-Sastre A.2010. Preference of RIG-I for short viral RNA molecules in infected cells revealed by next-generation sequencing. Proc. Natl. Acad. Sci. U. S. A.107:16303–16308.
15. Hornung V, Ellegast J, Kim S, Brzozka K, Jung A, Kato H, Poeck H, Akira S, Conzelmann KK, Schlee M, Endres S, Hartmann G. 2006. 5=-Triphosphate RNA is the ligand for RIG-I. Science314:994 –997. 16. Saito T, Owen DM, Jiang F, Marcotrigiano J, Gale M, Jr.2008. Innate
immunity induced by composition-dependent RIG-I recognition of hep-atitis C virus RNA. Nature454:523–527.
17. Schnell G, Loo YM, Marcotrigiano J, Gale M, Jr.2012. Uridine compo-sition of the poly-U/UC tract of HCV RNA defines non-self recognition by RIG-I. PLoS Pathog.8:e1002839. doi:10.1371/journal.ppat.1002839. 18. Wu B, Peisley A, Richards C, Yao H, Zeng X, Lin C, Chu F, Walz T, Hur
S.2013. Structural basis for dsRNA recognition, filament formation, and antiviral signal activation by MDA5. Cell152:276 –289.
19. Childs KS, Andrejeva J, Randall RE, Goodbourn S.2009. Mechanism of mda-5 inhibition by paramyxovirus V proteins. J. Virol.83:1465–1473. 20. Yoneyama M, Fujita T.2007. Function of RIG-I-like receptors in
antivi-ral innate immunity. J. Biol. Chem.282:15315–15318.
21. Liu HM, Loo YM, Horner SM, Zornetzer GA, Katze MG, Gale M, Jr.
2012. The mitochondrial targeting chaperone 14-3-3epsilon regulates a RIG-I translocon that mediates membrane association and innate antivi-ral immunity. Cell Host Microbe11:528 –537.
22. Kato H, Takeuchi O, Sato S, Yoneyama M, Yamamoto M, Matsui K, Uematsu S, Jung A, Kawai T, Ishii KJ, Yamaguchi O, Otsu K, Tsujimura T, Koh CS, Reis e Sousa C, Matsuura Y, Fujita T, Akira S. 2006. Differential roles of MDA5 and RIG-I helicases in the recognition of RNA viruses. Nature441:101–105.
23. Gitlin L, Barchet W, Gilfillan S, Cella M, Beutler B, Flavell RA, Dia-mond MS, Colonna M.2006. Essential role of mda-5 in type I IFN responses to polyriboinosinic:polyribocytidylic acid and encephalomyo-carditis picornavirus. Proc. Natl. Acad. Sci. U. S. A.103:8459 – 8464. 24. McCartney SA, Thackray LB, Gitlin L, Gilfillan S, Virgin HW, Colonna
M.2008. MDA-5 recognition of a murine norovirus. PLoS Pathog.
4:e1000108. doi:10.1371/journal.ppat.1000108.
25. Roth-Cross JK, Bender SJ, Weiss SR.2008. Murine coronavirus mouse hepatitis virus is recognized by MDA5 and induces type I interferon in brain macrophages/microglia. J. Virol.82:9829 –9838.
26. Züst R, Cervantes-Barragan L, Habjan M, Maier R, Neuman BW, Ziebuhr J, Szretter KJ, Baker SC, Barchet W, Diamond MS, Siddell SG, Ludewig B, Thiel V.2011. Ribose 2=-O-methylation provides a molecular signature for the distinction of self and non-self mRNA dependent on the RNA sensor Mda5. Nat. Immunol.12:137–143.
27. Schoggins JW, Wilson SJ, Panis M, Murphy MY, Jones CT, Bieniasz P, Rice CM.2011. A diverse range of gene products are effectors of the type I interferon antiviral response. Nature472:481– 485.
28. Loo YM, Fornek J, Crochet N, Bajwa G, Perwitasari O, Martinez-Sobrido L, Akira S, Gill MA, Garcia-Sastre A, Katze MG, Gale M, Jr.
2008. Distinct RIG-I and MDA5 signaling by RNA viruses in innate im-munity. J. Virol.82:335–345.
29. Fredericksen BL, Keller BC, Fornek J, Katze MG, Gale M, Jr.2008. Establishment and maintenance of the innate antiviral response to West Nile virus involves both RIG-I and MDA5 signaling through IPS-1. J. Virol.82:609 – 616.
30. Malathi K, Dong B, Gale M, Jr, Silverman RH.2007. Small self-RNA generated by RNase L amplifies antiviral innate immunity. Nature448:
816 – 819.
31. Suthar MS, Ma DY, Thomas S, Lund JM, Zhang N, Daffis S, Rudensky AY, Bevan MJ, Clark EA, Kaja MK, Diamond MS, Gale M, Jr.2010. IPS-1 is essential for the control of West Nile virus infection and im