Int. J. Electrochem. Sci., 9 (2014) 5116 - 5125
International Journal of
ELECTROCHEMICAL
SCIENCE
www.electrochemsci.orgThe Evaluation of Coating Performance by Analyzing the
Intersection of Bode Plots
Antao Xu1,*, Fan Zhang2,**, Fu Jin1, Renxiong Zhang2, Bing Luo3, Tianru Zhang4
1
Military Vehicle Department, Military Transportation University, Tianjin 300161, P. R. China
2
92403 Unit of PLA, Fuzhou 350000, P. R. China
3
94277 Unit of PLA, Ji’nan 250023, P. R. China
4
Scientific and Technology Division, Military Transportation University, Tianjin 300161, P. R. China
*
E-mail: [email protected]
**
E-mail: [email protected]
Received: 19 November 2013 / Accepted: 12 March 2014 / Published: 16 June 2014
In this paper, a new parameter named as IBP (intersection of Bode plots) was proposed to evaluate the coating performance by directly analyzing the Bode plots. The electrochemical impedance data of three coating systems in 3.5% sodium chloride solution were measured and the IBP correlated well with the results of coating resistance Rc and low frequency impedance |Z|0.1Hz. It is concluded that IBP
can be used for the evaluation of coating performance in practical applications.
Keywords: electrochemical impedance spectroscopy; coating performance; intersection of Bode plots
1. INTRODUCTION
In certain cases, the evaluation of coating performance by extracting the characteristic parameters from Bode plots of the electrochemical impedance spectroscopy has a useful theoretical and practical value. Shiro et al [10] found a good relationship between the breakpoint frequency fb and
the disbanded area of coating. Isao et al [11] observed a linear correlation between fθmax and Rc, where
fθmax is the frequency at which the phase angle is maximum and Rc is the coating resistance. Mahdavian
et al [12] used the theta at high frequency (10 kHz) to evaluate the performance of zinc phosphate and zinc chromate coatings. Zuo et al [13] used the phase angle at 10 Hz to evaluation the performance of several multi-layer coating systems. Akbarinezhad et al [14] found that decreasing percentages (DP) of the areas under Bode plots are convenient parameters for evaluating coating degradation.
In this paper, the possibility of using a new parameter IBP named intersection of Bode plots extracted directly from Bode plots as the discrimination indicator of the protective performance of coatings is described. The extracting process of parameter IBP is analyzed theoretically. The purpose of this paper is to further understand the interconnection between the IBP and coating properties, which may lead to a new evaluation method for coating performance in practical applications.
[image:2.596.128.468.387.629.2]2. THEORETICAL ANALYSES
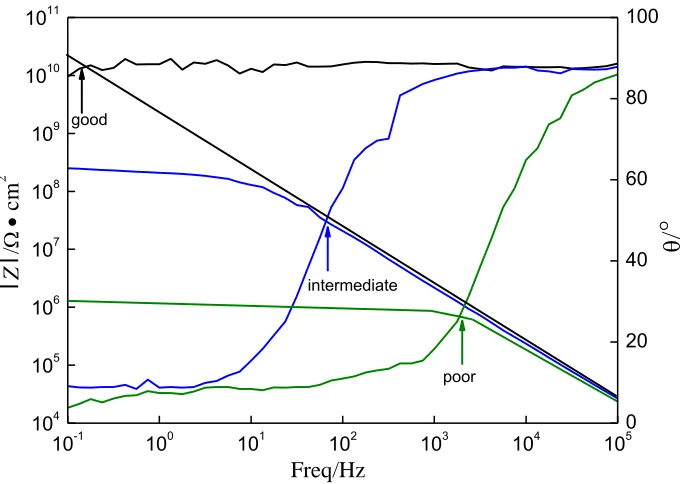
Figure 1. Typical Bode plots of good, intermediate, poor coating quality
It can be obtained typical Bode plots through analysis some electrochemical impedance spectroscopy [14, 15]. Figure 1 shows typical Bode plots when the coating performance is good, intermediate and poor, respectively. It can be seen in Fig.1 that the intersection of Bode phase plot and Bode impedance plot is in the upper left of Bode plots when the coating performance is good, the intersection is in the middle of Bode plots when the coating performance is intermediate, and the
10-1 100 101 102 103 104 105
104 105 106 107 108 109 1010 1011
poor good
Freq/Hz
intermediate
0 20 40 60 80 100
l
Z
l
/
cm
2
/
intersection is in the lower right of Bode plots when the coating performance is poor. The intersection of Bode plots (IBP) have been moved to the lower right gradually from a good performance coating to poor coating. At the same time, with the decrease of coating performance, the corresponding phase angle and impedance of IBP show similar decreasing tendencies, and the corresponding frequency shows gradually increasing tendency. Therefore, the IBP could be used as valuable references for evaluating the protective performance of coatings.
In order to find a simple and distinct analytical method, the test points of entire frequency range were numbered from 1 to n, and the first test point is 1, the next test point is 2 to n (n is the total number of test points and n is 49 in this paper). It can be found that the corresponding number of IBP reduces gradually with the decrease of coating performance. In particular, for the discreteness of EIS data, the intersection of Bode phase plot and Bode impedance plot may not be the measured points actually, and then the test point nearest the intersection could be used as IBP in this analysis.
3. EXPERIMENTAL
In order to verify the theoretical analyses above, experiments on the green organic coating, metallic paint coating and grey organic coating were carried out. All the samples used in this study were provided by the vehicle manufacturers of China,with a size of 60×60 mm. The thickness of green organic coating, metallic paint coating and grey organic coating was about 156.81um, 125.25um and 42.15 um, respectively.
EIS measurements were performed by PARSTAT 2263 electrochemical workstation and PowerSuite control software. A three-electrode cell was used which the coatings as the working electrode (WE), a saturated calomel electrode as the reference electrode (RE) and a ruthenium electrode as the counter electrode (CE). Impedance spectra were obtained at open circuit potential with a 10mV amplitude signal and the measuring frequency range was 0.1 Hz to 100 kHz. The samples were exposed to 3.5% sodium chloride solution at room temperature and examined p eriodically by EIS technique. The experimental data were analyzed by using commercial software ZSimpWin.
4. RESULTS AND DISCUSSION
4.1 Green organic coating
corresponding equivalent circuit of green organic coating can be modeled as Rs (Rc Cc) during the
whole immersion time.
10-1 100 101 102 103 104 105 104
105 106 107 108 109 1010 1011
/
°
l
Z
l
/
cm
2
Freq/Hz
3d 42d 61d 96d 156d 223d 328d 455d
[image:4.596.143.446.114.344.2]0 20 40 60 80 100
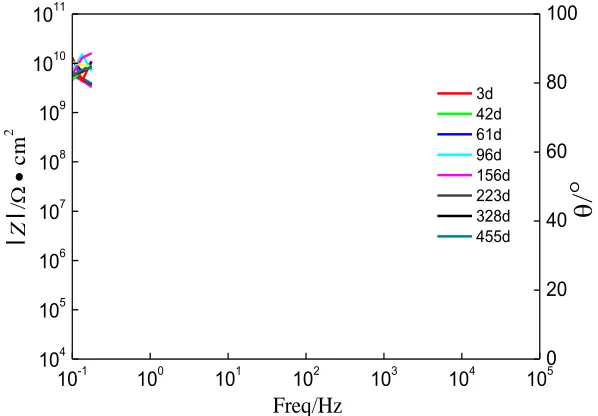
Figure 2. Bode plots of green organic coating in 3.5% sodium chloride solution
According to the measured Bode plots, the IBP was obtained for the green organic coating after processing by the theory above, as shown in Figure 3. From Fig.3 it can be seen that the IBP was in the upper left of Bode plots all the time, which proved that the green organic coating could still provide good protection after 455 d of immersion.
10-1 100 101 102 103 104 105 104
105 106 107 108 109 1010 1011
l
Z
l
/
cm
2
/
°
Freq/Hz
0 20 40 60 80 100
3d 42d 61d 96d 156d 223d 328d 455d
[image:4.596.150.449.500.708.2]
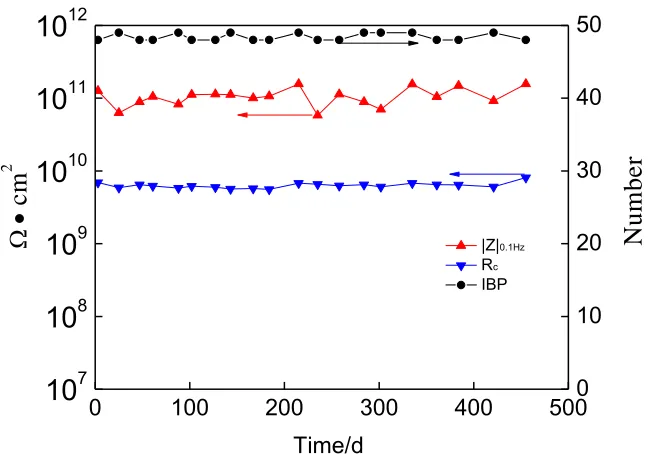
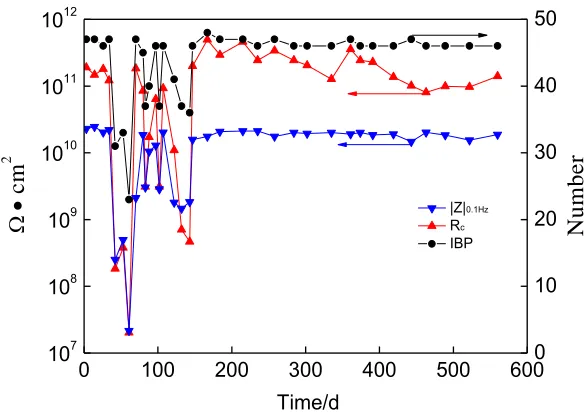
Figure 4 shows the change of IBP, coating resistance Rc and low frequency impedance |Z|0.1Hz
[image:5.596.131.455.206.433.2] [image:5.596.152.441.525.728.2]of green organic coating with different immersion time. From Fig. 4 it can be seen that the value of Rc
and |Z|0.1Hz was around 1.0×10¹¹Ω•cm2 and6.0×109Ω•cm2, respectively, the number of IBP was 48 or
49, indicating that the coating had a good protective performance. The IBP, Rc and |Z|0.1Hz almost
closed to a horizon linear and kept at a very high level, and the IBP showed similar tendency with Rc
and |Z|0.1Hz.
0 100 200 300 400 500
10
710
810
910
1010
1110
12|Z|0.1Hz Rc IBP
N
u
m
b
e
r
cm
2
Time/d
0 10 20 30 40 50
Figure 4. IBP of green organic coating compared with Rc and |Z|0.1Hz
4.2 Metallic paint coating
Figure 5. Bode plots of metallic paint coating in 3.5% sodium chloride solution
10-1 100 101 102 103 104 105
104 105 106 107 108 109 1010 1011
113d 149d 262d 382d 479d 560d 3d
42d 61d 71d 84d 108d
0 20 40 60 80 100
l
Z
l
/
cm
2
Freq/Hz
/
Figure 5 shows Bode plots of the metallic paint coating with different immersion times in 3.5% sodium chloride solution. For the first couple of days, Bode plots of the coating were composed of only one time-constant, indicating that the coating performance was good. After 42 d, the Bode plots with two time-constants were given. Two time-constants indicated that the electrolyte had permeated through the defects or pores in the metallic paint coating and double layer capacitance was formed in it. After 71 d, the Bode plots containing one time-constant were observed again. As the immersion time prolonged, the Bode plots with one or two time-constants were observed alternately, which means the coating had a good self-repairing capability. After 149 d of immersion, the Bode plots containing one time-constant were observed again and shown no overall change during the next immersion time. The corresponding equivalent circuit of metallic pain coating can be modeled as Rs (Rc Cc) before 42 d,
Rs (Rc Cc) or Rs (Cc (Rc Zw)) between 42 d and 149 d, and Rs (Rc Cc) after 149 d.
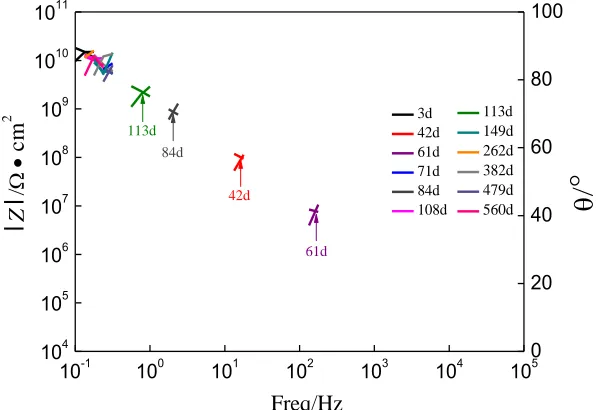
[image:6.596.146.445.452.657.2]According to the measured Bode plots, the IBP was obtained for the metallic paint coating after processing by the theory above, as shown in Figure 6. It can be seen in Fig. 6 that the IBP was in the upper left of Bode plots in the early stage of immersion, which proved that the coating could provide good protection. The IBP changed dramatically and transferred to the middle of Bode plots after 42 d, and reached the lowest position in this study after 61 d, indicating that the coating had an intermediate protective performance. But the IBP returned to the upper left of Bode plots after 71 d of immersion. As the immersion time prolonged, the IBP transferred to the middle and then returned to the upper left of Bode plots more than once, which means the coating had a good self-repairing capability. After 149 d of immersion, the IBP returned to the upper left of Bode plots again, and showed no overall change during the next immersion time.
Figure 6. IBP of metallic paint coating with different immersion time
Figure 7 presented the change of IBP, coating resistance Rc and low frequency impedance
|Z|0.1Hz of metallic paint coating during the immersing time. It can be seen that during the early 41 d,
the value of Rc remained above 1011 Ω•cm2, the value of |Z|0.1Hz remained above 1010 Ω•cm2 and the
10-1 100 101 102 103 104 105 104
105
106 107 108
109 1010 1011
113d 149d 262d 382d 479d 560d 3d
42d 61d 71d 84d 108d
0 20 40 60 80 100
113d
84d
61d
42d
l
Z
l
/
cm
2
Freq/Hz
/
number of IBP was around 47, indicating that the coating had a good protective performance. At 42 d, the value of Rc and |Z|0.1Hz suddenly decreased to the vicinity of 108 Ω•cm2, while the number of IBP
also quickly decreased to 31, indicating that the coating had an intermediate protective performance. The IBP, Rc and |Z|0.1Hz were observed a lot of fluctuations up and down between 42 d and 149d of
immersion and close to a horizon linear after 149 d. The results of these parameters follow the same trend and are very close to each other.
0 100 200 300 400 500 600
107
108 109 1010 1011 1012
|Z|0.1Hz
Rc
IBP
Time/d
N
u
m
b
e
r
cm
2
0 10 20 30 40 50
Figure 7. IBP of metallic paint coating compared with Rc and |Z|0.1Hz
4.3 Grey organic coating
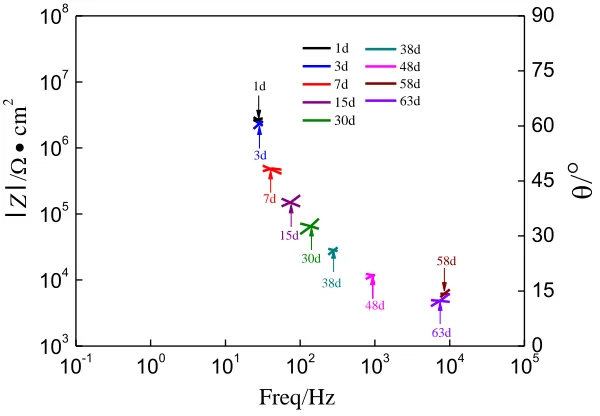
Figure 8 shows the Bode plots of grey organic coating exposed to 3.5% sodium chloride solution over a period of 63 d. During the early stage of immersion, the Bode plots showed a characteristic with one time-constant and the value of |Z|0.1Hz was below 108 Ω•cm2, indicating the
coating system had an intermediate performance and there was no electrolyte permeation through the coating. After 7 d, there were two time-constants in the Bode plots and the value of |Z|0.1Hz was below
107 Ω•cm2, indicating the coating system had a poor performance. The time-constant at high frequency was a result of interface capacitance and surface pore resistance of organic coating; the time-constant at low frequency was caused by metal substrate double layer capacitance and charge transfer resistance, reflecting the corrosion rate of metal substrate. The corresponding equivalent circuit of grey organic coating can be modeled as Rs (Rc Cc) before 7 d and Rs (Cc (Rc (Cdl Rct))) after 7 d. According to
[image:7.596.152.445.207.413.2]
Figure 8. Bode plots of grey organic coating in 3.5% sodium chloride solution
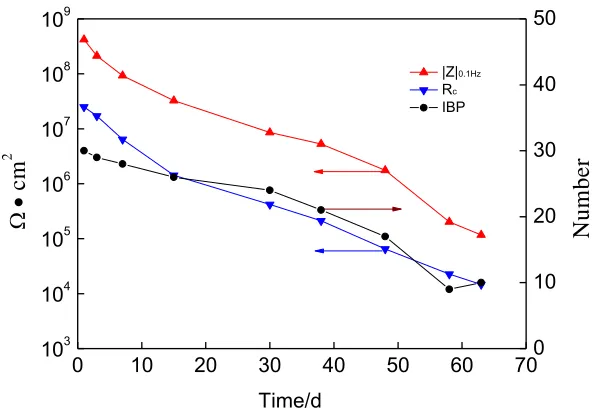
[image:8.596.138.438.482.690.2]The coating resistance Rc obtained from the electrochemical circuit above, the low frequency
impedance |Z|0.1Hz and IBP of grey organic coating are shown in Figure 10. It was found that the
number of IBP decreased from 30 to 10, both the value of Rc and |Z|0.1Hz decreased by 3 order of
magnitude, from 108 Ω•cm2 to 105 Ω•cm2 and 107 Ω•cm2 to 104 Ω•cm2, respectively, indicating that the coating had an intermediate protective performance for the first couple of days and was corroded continuously as the immersion time prolonged. The variation of IBP with time was very close to the variation of Rc and |Z|0.1Hz.
Figure 9. IBP of grey organic coating with different immersion time 10-1 100 101 102 103 104 105
103 104
105 106 107
108 38d
48d 58d 63d
l
Zl
/ cm 2 Freq/Hz
/
°
1d 3d 7d 15d 30d 0 15 30 45 60 75 9010-1 100 101 102 103 104 105
0 10 20 30 40 50 60 70
103 104
105 106 107 108
109
cm
2
N
u
m
b
e
r
Time/d
0 10 20 30 40 50
|Z|0.1Hz
Rc
IBP
Figure 10. IBP of grey organic coating compared with Rc and |Z|0.1Hz
As we know, abandon information related to the coating performance could be obtained by fitting electrochemical equivalent circuit models [1-7], but it is always time-taking. And other parameters such as fb, fθmax and θ10Hz [10-13] could be extracted from Bode plots, but those parameters
only use the information form Bode phase plot. Compared with the method mentioned above, the advantage of the parameter was that the parameter was obtained more quickly and easily, and uses the information both Bode phase plot and Bode impedance plot. From the analysis above, the IBP could be easily calculated from Bode plots. The variation of IBP also showed a good coincidence with the coating resistance Rc and low frequency impedance |Z|0.1Hz, and can reflect the coating performance.
5. CONCLUSIONS
In this paper, a new parameter named as IBP of evaluation of the protective performance of coatings was presented. The parameter IBP extracted directly from Bode plots was presented to the discrimination indicator of coating performance. The results showed that the IBP, Rc and |Z|0.1Hz are in
the same tendency. The method could be used as a good criterion for the evaluation of coating performance without constructing the equivalent electrical circuits. However, it still needs to be verified further by more samples.
References
1. G. D. Shay, K. R. Olesen and J. L. Stallings, J. Coat. Technol., 68(1996)51.
2. D. H. Xia, S. Z. Song, J. H. Wang, H. C. Bi and Z. W. Han, Acta Phys.-Chim. Sin., 28(2012) 121. 3. D. H. Xia, S. Z. Song, J. H. Wang, H. C. Bi, Y. X. Jiang and Z. W. Han, T. Nonferr. Metal. Soc.,
[image:9.596.154.452.88.292.2]
4. S. Shreepathi, P. Bajaj and B. P. Mallik, Electrochim. Acta, 55(2010)5129.
5. X. Zhao, J. Wang, Y. H. Wang, T. Kong, L. Zhong and W. Zhang, Electrochem. Commun., 9(2007)1394.
6. V. Lavaert, M. D. Cock, M. Moors and E. Wettinck, Prog. Org. Coat., 38(2000)213. 7. A. Amirudin and D. Thieny, Prog.Org.Coat., 26(1995)1.
8. P. Zoltowski, Solid State Ionics,176(2005)25.
9. Y. Fu, X. Q. Wu, E. H. Hou, K. Wei, Y. Ke and Z. H. Jiang, Electrochim. Acta, 54(2009)4005. 10. H. Shiro and S. Shirohi, Electrochim. Acta, 38(1993)1857.
11. S. Isao, S. Kazuhiko and Y. Makoto, J. Coat. Technol., 64(1992)45. 12. M. Mahdavian and M. M. Attar, Corros. Sci., 48 (2006)4152.
13. Y. Zuo, R. Pang, W. Li, J. P. Xiong and Y. M. Tang, Corros. Sci., 50(2008)3322.
14. E. Akbarinezhad, M. Bahremandi, H. R. Faridi and F. Rezaei, Corros. Sci., 51(2009)356. 15. C. C. Lee and F. Mansfeld, Corros. Sci., 41(1999)439.