This is a repository copy of
The effect of surface roughness on diffusion and chemical
reaction controlled limiting currents on a Rotating Cylinder Electrode in deaerated
solutions with and without CO2
.
White Rose Research Online URL for this paper:
http://eprints.whiterose.ac.uk/131713/
Version: Accepted Version
Article:
Al-Khateeb, M, Barker, R orcid.org/0000-0002-5106-6929, Neville, A
orcid.org/0000-0002-6479-1871 et al. (1 more author) (2018) The effect of surface
roughness on diffusion and chemical reaction controlled limiting currents on a Rotating
Cylinder Electrode in deaerated solutions with and without CO2. Corrosion, 74 (9). pp.
971-983. ISSN 0010-9312
https://doi.org/10.5006/2552
© 2018 NACE International. This is an author produced version of an article published in
Corrosion. Uploaded in accordance with the publishers self archiving policy.
[email protected] https://eprints.whiterose.ac.uk/
Reuse
Items deposited in White Rose Research Online are protected by copyright, with all rights reserved unless indicated otherwise. They may be downloaded and/or printed for private study, or other acts as permitted by national copyright laws. The publisher or other rights holders may allow further reproduction and re-use of the full text version. This is indicated by the licence information on the White Rose Research Online record for the item.
Takedown
If you consider content in White Rose Research Online to be in breach of UK law, please notify us by
*Corresponding author. E-mail: [email protected]
The effect of surface roughness on diffusion and chemical reaction controlled
limiting currents on a Rotating Cylinder Electrode in deaerated solutions with
and without CO
2M. Al-Khateeb
a *, R. Barker
a, A. Neville
a, H.M.Thompson
aaInstitute of Functional Surfaces, School of Mechanical Engineering, University of Leeds, LS2 9JT, UK
Abstract
The influence of surface roughness on mass transfer on a Rotating Cylinder Electrode
apparatus is investigated experimentally for a roughness pattern consisting of grooves parallel
to the direction of fluid flow. Mass transfer from four different samples, with roughness values
of 0.5, 6, 20 and 34 m, is measured using the limiting current technique for a range of
rotational speeds in NaCl solutions saturated with N2 at pH=3 and 4. Comparison with
available correlations for the Sherwood number in literature (which are independent of surface
roughness and are either for specific or arbitrary roughness patterns) shows that H+ mass
transfer only correlates well for particular levels of roughness and that their accuracy can be
increased if a correlation is utilised which is a function of surface roughening. A new correlation
for Sherwood number as a function of the Reynolds number, Schmidt number and surface
roughness is proposed which agrees well with the mass transfer observed from all the rough
surface cases considered for this particular roughness pattern. Complementary experiments
in CO2 environments were used to assess the combined limiting current associated with H+
and H2CO3 reduction (with the latter occurring via the buffering effect and being associated
with the slow CO2 hydration step). Although the increase in sample roughness clearly leads
to an increase in the rate of H+ mass transfer, in the CO
2 environments considered, surface
roughness is found to have no significant influence on the limiting current contribution from
H2CO3, which can therefore be determined from Vetter’s equation across this range of
operating conditions.
Keywords: Limiting current, Mass transfer, Surface Roughness. Nomenclature
A = projected surface area of electrode and/or area of smooth electrode (m2);
AR = real surface area of rough electrode (m2);
C = bulk concentration of hydrogen ions (mol/m3);
C = bulk concentration of carbonic acid (mol/m3);
d+ = friction length (m), d
D = diffusivity of hydrogen (m2/s);
D = diffusivity of carbonic acid (m2/s);
e = average distance from peak to valley (m);
fc = Rotating cylinder friction factor;
F = Faraday constant, (96485 Coulomb);
i = limiting current of hydrogen ions (Amp/m2);
i = limiting current of carbonic acid (Amp/m2);
k = mass transfer coefficient for smooth surfaces or mass transfer coefficient based on projected area of rough surfaces (m/s);
k = mass transfer coefficient based on real area (m/s);
k = backward reaction rate (H2CO3 dehydration reaction), 1/s;
URCE = linear velocity of rotating cylinder electrode, U (m/s);
Uf = friction velocity (m/s);
Re = Reynolds number, �e ;
Recrit = critical Reynolds number;
Sc = Schmidt number, Sc ;
Sh = Sherwood number not corrected with total area, Sh ;
y+ = dimensionless height;
= thickness of viscous sublayer (m);
= density (kg/m3);
= dynamic viscosity (Pa.s);
= Wall shear stress (Pa);
= kinematic viscosity (m2/s);
= rotation speed of rotating cylinder electrode (rpm)
= ratio of the diffusion layer thickness to reaction layer thickness; z = number of electrons exchange
1.0 Introduction
Although the effects of surface roughness on momentum and heat transfer have been
studied widely, comparatively few studies have considered the effect of surface roughness
on mass transfer [1]. The latter is of particular importance in corrosive environments when
the electrochemical response of the surface is influenced by the transport of
transportation of carbon dioxide (CO2)-containing process fluids using carbon steel pipelines
in the oil and gas industry [2]. In this instance, in low pH environments (~4 and below) the
cathodic reaction associated with the corrosion process can be considered to be comprised
of mainly two components; the reduction of hydrogen ions (H+) and the reduction of carbonic
acid (H2CO3) (or its dissociation and subsequent reduction at the steel surface) [3].
Consequently, the limiting currents observed at negative overpotentials are comprised of
these two reactions, with the first component relating to the diffusion of H+ ions from the bulk
solution (just as in pure HCl solutions), and the second being a chemical reaction controlled
process related to the slow CO2 hydration step (which is not mass-transfer controlled, but
does possess some flow dependency under certain conditions, as will be discussed in the
following text) [3].
The focus of this work is to evaluate the effects of a particular form of roughened surface on
the enhancement of H+ mass-transfer at a rotating cylinder electrode (RCE) by evaluating
the limiting currents observed in N2-saturated HCl solutions. These limiting currents are then
compared with those collected in the same pH environment in the presence of CO2 to
elucidate the role of surface roughness on the chemical reaction component of the limiting
current associated with H2CO3.
1.1 Role of surface roughness on mass transfer for the RCE geometry
Studies which have considered the influence of roughness on mass transfer characteristics
involve geometries such as rectangular ducts [4], pipes [5], the rotating disk [6] and the
rotating cylinder electrode (RCE) geometry [7]. However, consideration is afforded here
exclusively to the latter in single-phase flow environments, which is particularly useful for this
application given its ability to generate turbulence at low rotation rates and the fact that a
number of empirical relationships already exist (in the turbulent flow regime) for a number of
transport properties associated with the geometry [8].
One of the main approaches towards characterising mass-transfer behaviour for the RCE
geometry is to determine the mass-transfer coefficient (k) and convert it into the Sherwood
number (Sh). By plotting this value against Reynolds number (Re) it is possible to compare
with existing correlations for complete mass-transfer control. Selection of an appropriate
correlation is a critical step in this process as it is important to ensure that the correlation
chosen is valid over the range of experimental conditions analysed.
1.1.1 Smooth RCE surfaces
It is generally accepted that for hydraulically smooth surfaces, a log-log plot of experimental
data for Sherwood number against Reynolds number produces a slope of approximately 0.7
of Eisenberg et al. [9]. Through the application of the Chilton-Colburn analogy, Eisenberg et
al. determined the friction factor for a smooth RCE over a range of Reynolds numbers from
103 to 105:
which when used with the Chilton-Colburn analogy:
gives the commonly used expression which relates Sherwood number to the Reynolds and
Schmidt numbers:
Equation (3) is not the only relationship developed for the RCE, with numerous others being
proposed for smooth surfaces across various ranges of Reynolds number [10-15]. However
the correlation developed by Eisenberg et al. [9] is most often used to characterise mass
transfer behaviour for a smooth RCE. One point to stress is that the relationship here is
based on a straight line fit (from a log-log relationship) to what is actually a non-linear
relationship. This was demonstrated in the work of Makrides and Hackerman [16]who
reported a change in the relationship between friction factor and the Reynolds number
exponent over 103<Re<104, compared to the range 3x10⁴<Re<105. More recently, the work
of Silverman [15] proposed an equation which was believed to provide a better agreement
with the experimental results, although the most appropriate equations and degree of fit can
vary depending on the particular Reynolds number considered.
1.1.2 Rough RCE surfaces
The generation of surface roughness of a material through wet-grinding (sample
preparation), erosion, corrosion, deposition or other processes will modify the hydrodynamic
and mass-transfer boundary layers and consequently change the mass-transfer
characteristics. Several physical explanations for the effect of surface roughness on mass
transfer have been proposed in the literature. Surface roughness, for example, is assumed
to disturb the viscous sublayer and the turbulence generated to reduce the resistance to
mass transfer and penetrate into the valleys between the roughness peaks [11]. Although it
is understood that surface roughness will influence the Sherwood vs Reynolds number
relationship from that of a smooth surface, defining this relationship quantitatively is
challenging. This is attributed to the fact that a systematic study of the effects of surface (
1
)(2)
roughness on mass transfer is complicated by the diverse geometrical forms of roughness. It
is believed that the change in mass transfer characteristics mainly depends on the nature of
the rough surface, specifically the number of roughness elements per unit area, as well as
their shape, height, distribution and orientation/alignment to the flow direction [17].
One of the first studies to evaluate the effect of surface roughness on mass transfer was the
work of Theodersen and Reiger [18].Experiments were conducted with sand fixed onto
smooth RCEs and indicated that the size of the sand grain relative to the cylinder diameter
influenced the drag coefficient. However, above a certain critical Reynolds number (Recrit),
the drag coefficient became independent of Reynolds number. Theodersen and Reiger
proposed the following relationship between friction factor and the height of surface
roughness irregularities:
Noting here that this equation has been adapted to be a function of the cylinder diameter
and not the radius, as in the original expression, its range of validity was found to depend on
the friction length through the following relationship:
Both Makrides and Hackerman
[16]
and Kappessar et al.[19]
have examined thisrelationship, with the latter authors reporting results for platinized titanium electrodes under
cathodic control. Kappessar et al.
[19]
confirmed the equations reported by Theodersen andReiger and proposed the following equation to determine Recrit.
Based on these observations, it is clear that surface roughening has an important influence
on the Sherwood vs Reynolds number correlation. This change in relationship is related to
the enhancement of mass transfer due to viscous sublayer disruption, but is also due to the
deviation in actual surface area from the projected area with increased roughening.
1.2 Role of roughening patterns on mass transfer in RCE geometries
Although the former observations of the role of surface roughness appear to suggest a
simple relationship between mass transfer and roughness, other RCE studies highlight a
much more complicated correlation. It appears that the exponent of the Reynolds number in (4)
(5)
the relation with Sherwood number depends on the geometrical form of roughness. For
instance, Gabe et al. [20] examined the Sherwood vs Reynolds number relationship for
multiple forms of rough surfaces. The Reynolds exponent was shown to vary from 0.61 to 1
depending on whether the RCE surface roughness was in the form of knurled diamond
pyramids, longitudinal fins, cylindrical wire wrapping or a metal powder deposit. Some
studies have also suggested that the Reynolds number exponent tends to 1 as the
roughness height increases [21, 22], although this is argued to be too simplistic [8]. In
contrast, Makanjuola and Gabe [23] actually discovered that for certain RCE geometries, the
exponent is 1 for lower Reynolds number, but reduces to 0.578 at higher values. This
suggests an even more complex relationship whereby the Reynolds exponent varies with the
geometry or roughness, the magnitude of roughness and the Reynolds number itself.
Finally, Sedahmed et al. [24] evaluated the effect of machining fins (or longitudinal grooves)
into an RCE on mass transfer. The d/e ratios considered were from 17 to 54. Interestingly,
they reported that the friction factor remained sensitive to Reynolds number, even when the
critical Reynolds number for each particular sample roughness was exceeded.
It is clear there are quite contrasting relationships between friction factor and Reynolds
number in the literature. Some studies [18, 19] report no sensitivity of friction factor to
Reynolds number above a critical Reynolds number, while other authors [24] observe a clear
dependency of friction factor on Reynolds number above the reported critical value.
Therefore care needs to be taken when applying such equations to particular studies to
ensure the appropriate Sherwood number vs Reynolds number correlation is used.
The above review demonstrates that there is a need for greater awareness and
understanding of the role of surface roughening on mass transfer. The current work aims to
contribute to the research area of surface roughness effects on mass transfer for an RCE,
with the focus being directed towards H+ mass transfer in N
2-containing solutions. A specific
geometry is considered whereby the axial grooves are created which are virtually parallel to
the direction of flow, a geometry which has received less consideration within the literature
compared to longitudinal grooves (which have been shown to enhance mass transfer
significantly) [7, 23, 24] .
The work considers the effect of surface roughness of X65 carbon steel on the limiting
current in both N2-containing (pH 3 and 4) and CO2-containing NaCl (pH 4) environments
using an RCE setup. Limiting currents collected for different d/e surface roughness values
(2000, 600 and 353) and rotation speeds (1000 to 4000 rpm) at pH 3 and 4 in N2-saturated
solutions are utilised to determine H+ mass transfer coefficients, while the limiting currents
in an effort to understand the role of roughening on the contribution to the limiting current
from the chemical reaction controlled process related to the slow CO2 hydration step.
Surface analysis in the form of white light interferometry is also performed to ensure the
effects of increased surface area are accounted for to compare the apparent enhancement
on mass transfer with the true enhancement in mass transfer. Based on this work, the
influence of surface topography on mass transfer is evaluated and a modified empirical
equation relating Sherwood number to Reynolds number is developed to predict the value of
mass transfer coefficient for this particular type of geometry. The model can be utilised in
subsequent work to predict CO2 corrosion phenomena which can be compared to empirical
corrosion data for the same geometry to identify whether this improves modelling accuracy.
2.0 Experimental Procedure
2.1 Materials and sample preparation
Four RCE samples with different surface finishes were prepared using a hardinge lathe.
Various speeds, feeds and cut depths are selected to ensure each sample set would be
consistent yet be different to each other set. The electrodes were made of carbon steel X65
with 1.2 cm diameter and 1 cm length. The surface texture of the samples was analysed
using white light interferometry, a non-contact optical technique for surface height
measurements which is capable of resolving surface topography down to tens of
nanometers.
2.2 Equipment and test conditions
Experiments were conducted in a 1L glass cell at atmospheric pressure and 25ºC. A three
electrode setup (Figure 1) was employed for all experiments. The setup comprises a working
electrode (RCE sample), a reference electrode (Ag/AgCl) and a counter electrode
(platinum). Electrochemical measurements were performed using a potentiostat (ivium
compactstat.h) connected to a computer.
The tests were performed at rotational velocities between 1000 and 4000 rpm in a 1 wt.%
NaCl solution saturated with either nitrogen (N2) or carbon dioxide (CO2) gas for 24 hours
prior to the experiments to ensure that the system was free from oxygen. Bubbling of gas
into the electrolyte was also maintained over the duration of each experiment and
temperature was controlled with the aid of a hotplate and thermocouple. The pH of the
system was initially measured using a pH probe directly immersed into the electrolyte and
adjusted to the desired value using either dilute hydrochloric acid (HCl) or sodium
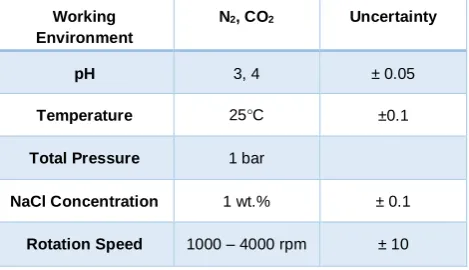
bicarbonate (NaHCO3). The full matrix of test conditions evaluated is provided in Table 1.
Working Environment
N2, CO2 Uncertainty
pH 3, 4 ± 0.05
Temperature 25°C ±0.1
Total Pressure 1 bar
NaCl Concentration 1 wt.% ± 0.1
[image:9.595.182.417.227.362.2]Rotation Speed 1000 – 4000 rpm ± 10
TABLE 1 Experimental test matrix.
2.3 Measurement of limiting currents and mass transfer
The glass vessel was filled with 1L of 1 wt.% NaCl solution and CO2 or N2 gas was bubbled
into the electrolyte for 24 hours to saturate the solution and remove oxygen. When required,
the pH of the solution was adjusted through the addition of either de-aerated dilute HCl or
NaHCO3. Prior to each experiment the samples were degreased with acetone, rinsed with
distilled water and then dried with compressed air before mounting onto the RCE shaft. The
open circuit potential (OCP) of the material was then allowed to stabilise for 10 minutes
before starting the experiment. To determine the mass transfer behaviour in each system,
the limiting current technique was implemented. This methodology has been used by many
researchers, e.g. [1, 7, 19], and been shown to provide reliable results in relation to the mass
transfer of species. The limiting current technique and its many advantages over
conventional heat and mass transfer measurement methods have been discussed by
Landau [25] amongst others. The technique works by performing cathodic potential sweeps
on the working electrode in N2-saturated conditions and evaluating the point at which the
current becomes insensitive to potential variation. This point is known as the limiting current
and in this region, it has been shown that the hydrogen evolution reaction (discussed later)
can proceed only as fast as H+ ions can diffuse from the bulk solution to the surface. This
enables the mass transfer coefficient to be determined using Equation (7) for the N2
All cathodic sweeps were performed individually, starting from 15 mV above the OCP, and
finishing at approximately -400 mV vs OCP at a scan rate of 0.5 mV/s.
In the case on N2 environments, the technique was used to check the limiting current of H+
ions as a function of rotation speed for a smooth surface to validate the Eisenberg et al.
correlation. Tests performed on rough surfaces in N2 environments also enabled the
influence of surface roughness on mass transfer of H+ ions to be evaluated. Experiments in
CO2 environments were used to assess the combined limiting current of H+ and the chemical
component of H2CO3 ( i.e. that associated with the buffering effect of carbonic acid, as
discussed previously) [26]at pH 4 to understand the sensitivity of each component to
rotation speed and surface roughness. All experiments were repeated at least twice.
3.0 Results and Discussion
3.1 Non-contact profilometry results
The surface texture of all four RCE samples was analysed over their entire length using
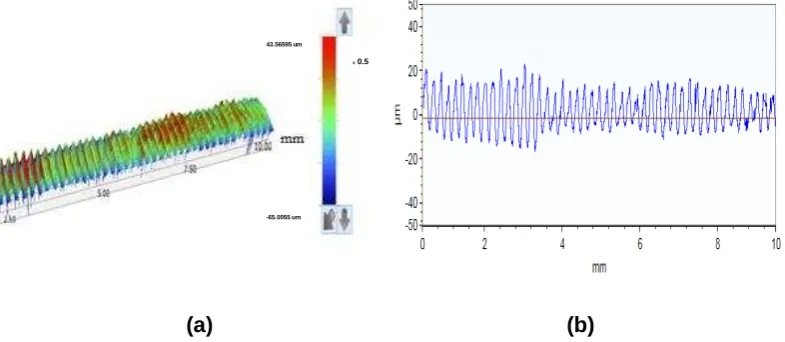
white light interferometry. Example 2D and 3D parallel roughness profiles are provided in
Figure 2 for the second roughest RCE sample (6 µm roughness). Each RCE surface
consists of forms of peaks and valleys and a value of ‘e’ was assigned to each sample which represents the average distance between the peaks and valleys [17].
(a) (b)
FIGURE 2. (a) 3D and (b) 2D profile of second roughest RCE sample considered in this study (6 µm).
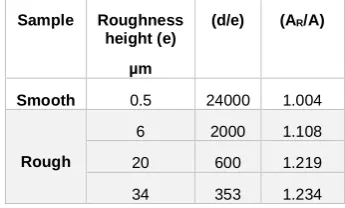
This value is displayed in Table 2 along with the d/e ratio (which is commonly assumed to
influence mass-transfer [27])and the ratio of the real area (AR) to the projected area (A).
(7)
43.56595 um
-65.0055 um
[image:10.595.102.495.497.668.2]Table 2 indicates that the machining process is able to produce a range of RCE surface
roughness from very smooth (with a real area very similar to the projected area) up to 34
µm, which is analogous to that of steel pipelines delivered to coatings yards [28] and has an
[image:11.595.210.383.176.280.2]actual area ~1.23 times that of the smooth surface.
TABLE 2 RCE surface properties of the four samples considered in this study.
Sample Roughness height (e)
µm
(d/e) (AR/A)
Smooth 0.5 24000 1.004
Rough
6 2000 1.108
20 600 1.219
34 353 1.234
3.2 Mass transfer measurement for smooth surfaces in N2 environments – validation of the Eisenberg et al. correlation
In 1954, Eisenberg et al. [9]conducted a comprehensive study on mass transfer to a smooth
RCE surface. They employed the limiting current technique to measure mass transfer
utilising the ferriferrocyanide redox reaction in alkaline solutions. Their data for turbulent
conditions was correlated with Equation (3) and is most often used to characterise mass
transfer behaviour of a smooth RCE geometry. Based on this relationship for smooth
surfaces, the Eisenberg et al. correlation [9]suggests that the mass transfer coefficient is
[image:11.595.191.402.473.629.2]proportional to URCE0.7 for the RCE.
FIGURE 3. Potentiodynamic sweeps conducted in HCl solution at pH 3 purged with N2, T=25 °C and 1
wt.% NaCl using a smooth RCE sample surface.
In order to validate the results against the Eisenberg correlation and hence the relation
between the mass transfer rate and velocity, experiments were initially conducted on smooth
RCE samples (0.5 µm) in N2 environments at pH 3 to obtain definitive limiting currents for
various rotation speeds. Figure 3 provides examples of selected cathodic sweeps obtained
-1.2 -1 -0.8 -0.6 -0.4 -0.2
0.1 1 10
P
o
te
n
ti
a
l
v
s
A
g
/A
g
C
l
(V)
i (mA/cm2) 1000 rpm-(Re=8460)
1500 rpm-(Re=12691)
3000 rpm-(Re=25382)
and indicates that the limiting currents are clearly flow dependent.
At pH=3 in an N2 saturated environment, the increase in velocity leads to an increase in
limiting current values as more H+ ions are able to transfer from the bulk and react at the
surface via the hydrogen evolution reaction:
With the exception of the reduction of water (which only becomes significant at high pH or
very negative overpotentials), this is the only cathodic reaction in the system when the
solution is de-aerated with N2. It has been shown previously by Stern [28] that the limiting
rate of the hydrogen-evolution reaction proceeds only as fast as hydrogen can diffuse from
the bulk to the surface.
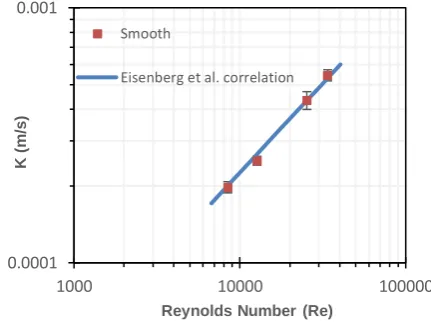
Mass transfer coefficient values were determined from the limiting currents of the cathodic
Tafel sweeps determined from the experiments conducted for each case shown in Figure 3
using Equation (7). The calculated coefficients are plotted against RCE surface velocity in
Figure 4 against the Eisenberg et al. correlation and an excellent agreement is obtained as
the results have a 8% maximum deviation and 5.5% average deviation from the proposed
relationship. These results demonstrate the validity of the technique employed in the context
of H+ ion diffusion and indicates that for a ‘smooth’ RCE surface, the mass transfer
[image:12.595.188.404.447.609.2]coefficient is proportional to URCE0.7.
FIGURE 4. Comparison of mass transfer coefficient for a smooth surface with the Eisenberg et al. correlation.
3.3 Influence of roughness on mass transfer in N2 environments at pH 3
In flow conditions for the smooth RCE sample, the rate of mass transfer to the steel surface
was determined by finding a mass transfer coefficient, k, using Equation (7) which requires
an input of the steel surface area. In this instance, the projected and actual surface areas of
the smooth sample were very similar and no compensation for area effects was required to
0.0001 0.001
1000 10000 100000
K
(m
/s
)
Reynolds Number (Re) Smooth
Eisenberg et al. correlation
determine the enhancement of mass transfer. For rough samples, however, Equation (7)
should use the true surface area (AR) to account for surface area effects and decouple their
contribution from mass transfer enhancement.
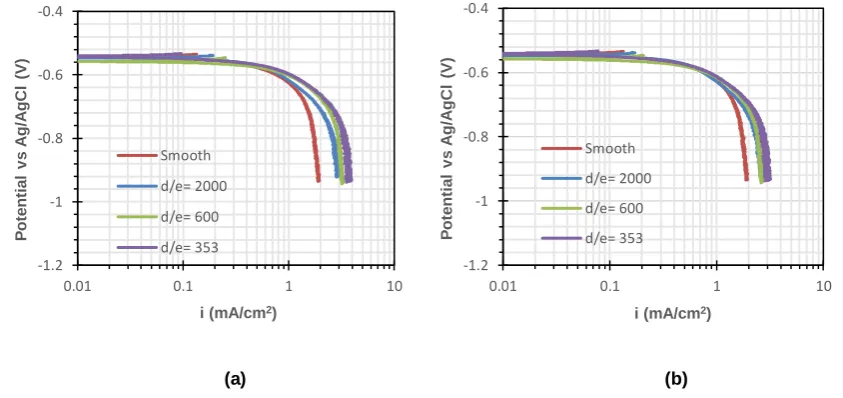
[image:13.595.87.509.132.331.2](a) (b)
FIGURE 5. Potentiodynamic sweeps conducted in HCl solution at pH 3 purged with N2, T=25 °C, 1 wt.%
NaCl, 1000 rpm: (a) without correcting the current density for the true area (b) with correction of current
density for the true area.
In the next series of experiments, all four RCE samples of different roughness (0.5, 6, 20
and 34 µm) were evaluated across a range of rotation speeds from 1000 to 4000 rpm
(Re=8460 to 33843) at pH 3 in an N2 environment to elucidate the effect of roughness on
mass transfer. Figure 5 provides examples of the cathodic Tafel polarisation sweeps
conducted on RCE samples with different surface roughness values at 1000 rpm in a pH 3
N2-saturated 1 wt.% NaCl solution. Figures 5(a) and 5(b) show the difference in sweep
profiles when the current density is determined based on the projected area or the actual
area of the X65 steel surfaces, respectively. There is a small but discernible difference
between the two sets of profiles, particularly at the higher levels of roughness (d/e = 353 in
particular). This indicates that compensating for the actual area is essential in order to
determine the true effect of surface roughening on the rate of mass transfer. These results
support the observations of Makanjuola and Gabe [29] who demonstrated the importance of
accounting for the increased surface area as a result of roughening to fully understand the
effect on mass transfer. Using RCE experiments they found that the observed
80% enhancement in mass transfer coefficient was reduced to less than 10% when the true
surface area is used instead of the projected area. Such an approach allows the increased
area effects to be decoupled from the true enhancement of mass transfer due to the
hydrodynamic effects induced by surface roughness. In practice, of course, from the
perspective of understanding overall mass-transfer enhancement, it is sufficient and
-1.2 -1 -0.8 -0.6 -0.4
0.01 0.1 1 10
P o te n ti a l v s A g /A g C l (V)
i (mA/cm2) Smooth d/e= 2000 d/e= 600 d/e= 353 -1.2 -1 -0.8 -0.6 -0.4
0.01 0.1 1 10
P o te n ti a l v s A g /A g C l (V)
i (mA/cm2) Smooth
d/e= 2000
d/e= 600
much more convenient to adopt the conventional approach of simply using the projected
surface area.
[image:14.595.89.505.116.332.2]
(a) (b)
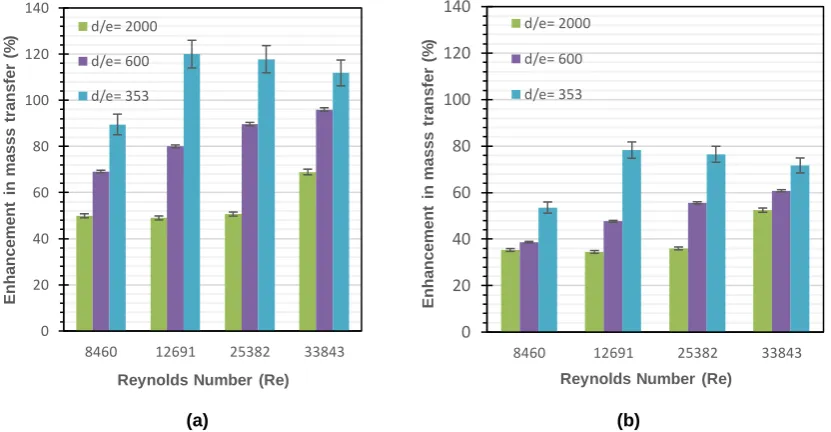
FIGURE 6. Percentage enhancement in mass transfer coefficient from that determined for a smooth RCE
sample as a function of surface roughness and velocity in N2 solution, T=25°C, 1 wt.% NaCl and pH=3 for
limiting currents (a) based on projected area (b) with correction for the true area.
Figure 6 shows the percentage of enhancement of mass transfer coefficient from that of a
smooth surface (where the project area is very similar to the actual surface area) for each
surface roughness value at various Reynolds number. Figure 6(a) and (b) indicate the level
of enhancement when the limiting current was derived based on projected and true surface
area, respectively. Generally, with the exception of the highest rotation speeds of 3000 and
4000 rpm (Re=25382 and 33843) for the roughest sample (d/e = 353), the percentage
enhancement in mass transfer increases with both surface roughening and Reynolds
number. At 1000 rpm (Re=8460), the percentage increase in mass-transfer from a smooth
surface for d/e values of 2000, 600 and 353 is 50, 69 and 89%, respectively when values are
based on projected areas. However, these values reduce to 35, 38 and 54% when the true
areas are considered, indicating that the increased area of the sample is responsible for a
significant increase in mass transfer. At the highest rotation speed of 4000 rpm (Re=33843),
the enhancement is 69, 96 and 112% for d/e values of 2000, 600 and 353, respectively
when projected area is used. The percentage increase reduces to 52, 61 and 72% when the
true surface area is used.
0 20 40 60 80 100 120 140
8460 12691 25382 33843
En h a n c e m e n t in m a s s s tr a n s fe r (% )
Reynolds Number (Re) d/e= 2000 d/e= 600 d/e= 353 0 20 40 60 80 100 120 140
8460 12691 25382 33843
En h a n c e m e n t in m a s s s tr a n s fe r (% )
Reynolds Number (Re) d/e= 2000
d/e= 600
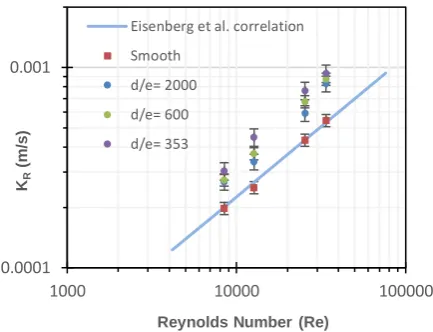
FIGURE 7. Measured and predicted mass transfer coefficient as a function of surface roughness and
velocity in N2 solution, T=25°C, 1 wt.% NaCl and pH=3 for limitin g currents corrected using the actual
surface area of each sample.
Figure 7 expresses the limiting currents extracted from Figure 5(b) (which are based on the
true steel surface area) as mass transfer coefficients against the RCE surface velocity. The
data is supplemented with the additional tests performed using the same four samples at the
higher rotation speeds to enable correlations to be established. Expressing the results based
on the actual area of each sample enables the true effect of mass-transfer enhancement to
be visualised and decoupled from the effect of increased area. Referring to Figure 7, the
increase in sample roughness clearly leads to an increase in the rate of mass transfer, even
when the real surface area of each sample is taken into account. Busse et al. [30] studied
turbulent flow past an irregular rough surface based on a scan of a rough graphite surface,
which they used as a no-slip boundary in Direct Numerical Simulations (DNS) of the
turbulent flow. Their DNS predicted a number of flow features which could explain enhanced
mass transfer over rough surfaces, including a significant increase in wall-normal flow
fluctuations within roughness layers, strong upwards motions at the upstream faces of
roughness peaks and recirculating flow regions between the peaks. The results in Figure 7
also reflect that mass transfer has some dependency on the d/e ratio, as increasing the
roughness (or reducing d/e) served to enhance mass transfer for a given rotation speed.
Although few studies have focused on the relationship between surface roughness and
mass transfer in an RCE system for the particular roughness pattern considered in this work,
Gabe and Makanjuola [7] and Poulson [21] have developed correlations for the Sherwood
number which are worthy of comparison with the values determined here.
Poulson [21] suggested that surface roughness prevailed over the system geometry in terms
of influencing mass transfer and proposed the following relationship:
3000 < Re < 50,000 (9)
0.0001 0.001
1000 10000 100000
KR
(m
/s
)
Reynolds Number (Re) Eisenberg et al. correlation
Smooth
d/e= 2000
d/e= 600
The relationship was based on data from very rough RCE geometries (d/e=87) as well as
numerous other geometries with various forms of roughening patterns [21]. However,
Poulson does not explain why the correlation is independent of surface roughness.
The correlation by Gabe and Makanjuola [7] was developed for cylindrical wire wrapping
which is similar to the geometry considered here:
210 < Re < 240,000 (10)
This correlation is valid for Reynolds values (210- 240,000), with wire diameters ranging
from 0.05 to 0.125 mm diameter. These two relationships are compared with the results
obtained in this study within Figure 8 for two of the rough surfaces considered within the
RCE (i.e. d/e = 2000 and 353). Note that for ease of comparison with previous studies and
the complexities associated with determining actual area, all experimental data from this
point onwards is based on the projected area. The fluid properties and diffusion coefficients
used in the calculation of the Sherwood and Reynolds numbers here, as well specific fluid
properties utilised in subsequent calculations are provided in Tables 3 and 4 for reference.
Figure 8 shows that the Poulson correlation produces a closer agreement with the roughest
RCE sample considered (d/e = 353). This is expected given that the model was developed
for RCE samples with d/e values of 87, however, it is also important to point out here that the
roughness pattern on the RCE samples consisted of perpendicular grooves which have
been shown to generate significant enhancement of mass transfer compared to other
patterns and orientations.
[image:16.595.78.503.509.719.2]
(a) (b)
FIGURE 8. Comparison between the Poulson [21] and Gabe and Makanjuola correlation [7] with
experimental Sherwood number based on sample projected area for: (a) d/e=2000 (b) d/e= 353.
0 500 1000 1500 2000
0 10000 20000 30000 40000
Sh e rw o o d N u m b e r (Sh )
Reynolds Number (Re) Poulson Correlation
Gabe and Makanjuola Correlation
d/e= 2000 0 500 1000 1500 2000
0 10000 20000 30000 40000
Sh e rw o o d N u m b e r (Sh )
Reynolds Number (Re) Poulson Correlation
Gabe and Makanjuola Correlation
TABLE 3 Fluid and species properties [31].
Density
Dynamic viscosity
Diffusion coefficient
Tref is the reference temperature =20°C , =1.002 kg/(m.s)
T is the temperature in K
T is the temperutre in °C
TABLE 4 Reference diffusion coefficients for each species [31].
Species Diffusion Coefficients (m2/s)
H+ 9.312×10⁻⁹
H2CO3 2×10⁻⁹
As mentioned previously, a d/e value of 87 for RCE samples analysed by Poulson equated
to roughness elements which exceed that of the viscous sublayer thickness. In the context of
this work, the viscous sublayer thickness, , can be estimated by setting y+=5 [32] where:
so that
This estimate of the viscous sublayer thickness, for various RCE speeds, is compared
against the surface roughness, e, in Table 5. It shows that the viscous sublayer thickness is
close to e for the largest surface roughness at the higher RCE speeds of 3000 and 4000 rpm
and it is therefore not surprising that roughness plays a role in influencing mass transfer, a
finding that is consistent with Dawson and Trass [33]. However for the flows considered
here, with Schmidt numbers around Sc~100, even when the roughness is well immersed
within the viscous sublayer, it can still disturb the thinner mass transfer boundary layer,
leading to enhancement of mass transfer. This is described comprehensively in Nesic et al.
[34].
.
(11)
TABLE 5 Estimates of viscous sublayer thickness as a function of RCE speed in comparison to surface roughness of 0.5, 6, 20 and 34 µm.
RCE rpm Re Viscous sublayer ( ) (µm)
1000 8460 97.8
2000 12691 69.3
3000 25382 38.4
4000 33843 30.1
With regards to the correlation by Gabe and Makanjuola, this model provides a good
estimate of Sherwood number at low roughness (d/e=2000), however, the agreement
degrades with high roughness (d/e=353) with a maximum deviation of approximately 26%.
Both the Poulson and the Gabe and Makanjuola correlations agree well with specific
degrees of roughness evaluated in this study. This can be attributed to the fact that these
correlations were developed for a particular roughness (d/e=87 in the case of Poulson) or
small roughness ranges (wire winding with diameters 0.05, 0.1 and 0.125 mm in the case of
Gabe and Makanjuola). The results generated here are clearly sensitive to the degree of
surface roughness and consequently suggest that there is a need for a new correlation
which also accounts for the value of d/e.
The correlation proposed here is derived from the experimental results based on the
projected surface area to produce a correlation which can be more easily utilised by other
researchers who are unable to measure, or experience difficulties estimating, the actual
surface area.
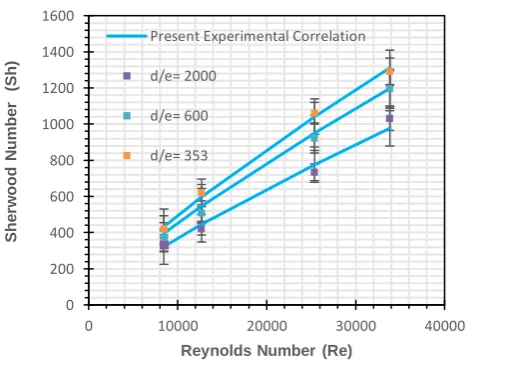
FIGURE 9. Sherwood number vs Reynolds number for different degrees of roughness.
0 200 400 600 800 1000 1200 1400 1600
0 10000 20000 30000 40000
Sh
e
rw
o
o
d
N
u
m
b
e
r
(Sh
)
Reynolds Number (Re) Present Experimental Correlation
d/e= 2000
d/e= 600
[image:18.595.175.428.497.688.2]From Figure 9, it can be determined that for rough cylinders, the mass transfer coefficient
increases with Re0.8 and is sensitive to d/e. Therefore, a modified correlation for Sherwood
number is suggested:
(13)
where
(14) This correlation is compared with the entire set of experimental data collected in this study
for rough samples in Figure 9, producing a maximum deviation of around 7.5% and average
deviation of around 3%. The correlation is valid for the Reynolds number range of 8500 to
33850 and d/e from 353 to 2000. Note that the Reynolds numbers exponent has been
shown to be sensitive to the roughness pattern, ranging from 0.61 for perpendicular fins to 1
for knurled diamond pyramids [8], whereas the (e/d) exponent reported by Sedahmed et al.
[24] for perpendicular fins is 0.2.
3.4 Influence of surface roughness in CO2 and N2 environments at pH 4
In the N2 environment at pH 3, when a cathodic sweep is conducted, the limiting current is
clearly flow dependent. In this section, N2 experiments are compared with CO2-containing
environments at pH 4 to determine the role of surface roughness on the observed limiting
currents.
In CO2-containing environments, CO2 dissolves in water and is hydrated to form carbonic
acid:
Carbonic acid is a weak acid which partially dissociates and is responsible for the high
corrosion rates observed for steel in CO2 containing brines [31]:
(15)
(16)
FIGURE 10. Potentiodynamic sweeps conducted in N2 solution at pH 4, T=25 °C, 1 wt.% NaCl and differe nt
[image:20.595.192.403.294.460.2]RCE speeds on a smooth sample.
Figure 11. Potentiodynamic sweeps conducted in CO2 solution at pH 4, T=25 °C, 1 wt.% NaCl and
different RCE speeds on a smooth sample.
Figures 10 and 11 show cathodic Tafel sweeps conducted at pH 4 and 25ºC in N2 and CO2
-saturated environments, respectively, on a smooth sample. The value of limiting current in
the CO2 system is higher than in the N2 system at the same pH. This increase in limiting
current is attributed to the presence of H2CO3 which was initially believed by DeWaard and
Milliams [35] to be directly reduced at the steel surface through the reaction:
However, more recent research [26, 36] has shown that the reaction actually occurs via a
buffering effect at the steel surface.
-1.2 -1 -0.8 -0.6 -0.4
0.01 0.1 1
P o te n ti a l v s A g /A g C l (V)
i (mA/cm2) 1000 rpm-(Re=8460) 1500 rpm-(Re=12691) 3000 rpm-(Re=33843) -1.2 -1 -0.8 -0.6 -0.4
0.01 0.1 1
P o te n ti a l v s A g /A g C l (V)
i (mA/cm2) 1000 rpm-(Re=8460)
1500 rpm-(Re=12691)
3000 rpm-(Re=33843)
(a) (b)
(c)
FIGURE 12. (a) Comparison between mass transfer coefficient for smooth samples in N2 solution at pH 3
and pH=4 T=25 °C, 1 wt.% NaCl and different RCE spe eds (b) Limiting currents for smooth samples in
CO2 and N2 solution at pH 4, T=25 °C, 1 wt.% NaCl and differe nt RCE speeds (c) Comparison between Vetter’s correlation and limiting currents of H2CO3.
Limiting currents were recorded over the range of 1000 to 4000 rpm in both HCl (N2) and CO2
solutions using the cathodic polarisation sweeps at pH 4 and 25ºC for the smooth sample after
correction for the water reduction reaction (determined by extending the cathodic polarisation
sweeps to more negative potentials). The corresponding limiting currents in N2-saturated
environments are compared with those obtained previously at pH 3 and are provided in Figure
12(a) for the smooth sample. This figure confirms the measurement of mass transfer at low
pH but also validates the corrections implemented for the water reduction reaction which
enable the limiting currents to be determined more precisely, particularly at lower rotation
speeds.
Figure 12(b) shows the difference between limiting currents observed in the N2 and CO2
-saturated environments at pH 4. This pH was chosen as opposed to a lower pH to enable the
0 0.0001 0.0002 0.0003 0.0004 0.0005 0.0006 0.0007
0 10000 20000 30000 40000
K
(m
/s
)
Reynolds Number (Re) pH=3 pH=4 0 2 4 6 8 10
0 10000 20000 30000 40000
L im iti n g c u rr e n t (A /m 2)
Reynolds Number (Re)
I limiting N2
I limiting CO2
0 0.5 1 1.5 2
0 10000 20000 30000 40000
L im iti n g c u rr e n t (A /m 2)
Reynolds Number (Re)
I limiting H2CO3
[image:21.595.85.516.72.485.2]difference between the two limiting currents to be more easily visualised (i.e. to prevent
dominance of the mass-transfer controlled H+ reduction reaction and its total contribution to
the limiting current).
If it is assumed that both H+ and H
2CO3 play a role in the cathodic reactions, the limiting
current can be divided into two components; one related to the diffusion of H+ (quantified by
the limiting current in the N2 system) and the other associated with the role of H2CO3 which
is quantified by the gap between the two curves in Figure 12(b), and is also shown more
clearly in Figure 12(c).
Firstly, it appears that the observed gap between the two curves depicted in Figure 12(c) is
insensitive to flow over the rpm ranges considered, remaining relatively constant. This is
consistent with previous studies and Vetter [37]first proposed an equation to determine the
magnitude of the limiting current of the carbonic acid component:
This model is shown in Figure 12(c) and demonstrates a good agreement with the
experimental data collected here for smooth samples up to 4000 rpm. However, research by
Nesic et al. [3]evaluated Vetter’s model and found that at high rpm (beyond ~6000 rpm) the ilim H2CO3 component began to increase slightly with increasing speed, indicating that the
limiting current can be influenced by flow at higher speeds. The phenomenon was attributed
to the change in relative thickness between the reaction layer and diffusion layer and the fact
that Vetter’s model was derived for stagnant conditions or systems where the reaction layer is much smaller than the diffusion layer. Based on this work, Nesic et al. [3]proposed a
modification to Vetter’s model using a ‘flow factor’ (f1):
where
Unfortunately, the experimental data produced at higher rotation speeds resulted in noise
from the cathodic Tafel sweeps which produced ambiguity over the limiting current values
required to validate this response. However, based on the research by Nesic et al., and the
fact that modifying surface roughness has the ability to disrupt mass transfer in the boundary
layer, a final set of measurements were performed at 4000 rpm (the highest speed at which
reliable electrochemical measurements could be obtained) on surfaces of different
. (19)
. (20)
roughness values to establish whether the value of ilim H2CO3 is influenced by surface
roughness at the conditions considered in this study. Results provided in Figure 13 show
that for the cases considered here, up to 4000 rpm, the effect of surface roughness on ilim
H2CO3 is only minor, the variation being within experimental error. Consequently for the range
of experimental conditions considered in this work, Equation (19) can be used to estimate ilim
H2CO3 without further modification for surface roughening effects.
[image:23.595.86.501.204.382.2]
FIGURE 13. Comparison between Potentiodynamic sweeps conducted in CO2 and N2 solution at pH 4,
T=25 °C, 1 wt.% NaCl, 4000 rpm and different surfac e roughness based on sample projected area.
4.0 Conclusion
Although the effects of surface roughness on momentum and heat transfer have been widely
studied, comparatively few studies have focussed on their important effects on mass transfer.
The present experimental investigation explores the influence of surface roughness on mass
transfer on a Rotating Cylinder Electrode apparatus for a roughness pattern consisting of
grooves parallel to the direction of fluid flow, a pattern which has received less attention within
literature. Consideration is also afforded to how the limiting current is influenced in a CO2
-containing environment whereby the reduction of H2CO3 contributes towards the total limiting
current observed.
The experimental results in N2-containing environments demonstrate that an increase in
sample roughness from 0.5 m to 6, 20 and 34 m leads to an increase in the rate of mass transfer from the samples. The data for the smoothest surface confirms that the well-known
Eisenberg et al. correlation predicts H+ mass transfer rates accurately for smooth surfaces.
However, for rough surfaces (6, 20 and 34 m) mass transfer was shown to depend on both Reynolds number and the degree of roughness (e/d). A new correlation is proposed for the
Sherwood number as a function of the Reynolds and Schmidt numbers and roughness ratio,
which predicts the measured mass transfer rates over rough surfaces with a maximum 7.5%
-1.2 -1 -0.8 -0.6 -0.4
0.01 0.1 1 10
P o te n ti a l v s A g /A g C l (V)
i (mA/cm2)
d/e= 2000 N2
d/e= 2000 CO2
-1.2 -1 -0.8 -0.6 -0.4
0.01 0.1 1 10
P o te n ti a l v s A g /A g C l (V)
i (mA/cm2)
d/e= 353 N2
discrepancy. This offers an improved correlation compared to existing reviewed models which
are independent of surface roughness and are either for specific or arbitrary roughness
patterns. Further comparisons with other existing correlations for the effect of RCE roughness
pattern on mass transfer has revealed the importance of accounting for both roughness
magnitude and orientation and care must be taken to use them in their regions of validity.
Comparison of limiting currents in N2 and CO2 environments indicated a larger limiting current
in the latter case due to the reduction of H2CO3 (via a buffering effect associated with the slow
hydration of CO2). Although the increase in sample roughness resulted in an increase in the
rate of H+ mass transfer, in the CO
2 environments considered, surface roughness was found
to have no significant influence on the limiting current contribution from H2CO3. Therefore, the
contribution could be accurately modelled using Vetter’s equation across this range of rotation speeds and fluid compositions.
5.0 Acknowledgements
The authors acknowledge the support of the Higher Education committee Iraq (HCED) in
funding this project.
6.0 References
1. Sedahmed, G. and Shemilt, L., Forced convection mass transfer at rough surfaces in
annuli. Letters in Heat and Mass Transfer, 1976. 3(6): p. 499-511.
2. Al-Yasiri, Mortatha, Mohammed Al-Khateeb, and Dongsheng Wen. "Examination of
drill pipe corrosion in water-based drilling fluids under wellbore conditions." Corrosion
Engineering, Science and Technology (2017): 1-5.
3. Nesic, S., Pots, B. F. M., Postlethwaite, J., & Thevenot, N., Superposition of Diffusion
and Chemical Reaction Controlled Limiting Currents-Application to CO2 Corrosion.
Journal of Corrosion Science and engineering, 1995. 1(3).
4. Tantirige, S. and Trass, O., Mass transfer at geometrically dissimilar rough surfaces.
The Canadian Journal of Chemical Engineering, 1984. 62(4): p. 490-496.
5. Postlethwaite, J. and Lotz, U., Mass transfer at erosion corrosion roughened
surfaces. The Canadian Journal of Chemical Engineering, 1988. 66(1): p. 75-78.
6. Cornet, I., Lewis, W., and Kappesser, R., Effect of surface Roughness on mass
transfer to a rotating disc. TRANS INST CHEM ENG, 1969. 47(7): p. 222-226.
7. Gabe, D. and Makanjuola, P., Enhanced mass transfer using roughened rotating
cylinder electrodes in turbulent flow. Journal of Applied Electrochemistry, 1987.
8. Silverman, D., The rotating cylinder electrode for examining velocity-sensitive
corrosion-a review. Corrosion, 2004. 60(11): p. 1003-1023.
9. Eisenberg, M., Tobias, C., and Wilke, C., Ionic mass transfer and concentration
polarization at rotating electrodes. Journal of the Electrochemical Society, 1954.
101(6): p. 306-320.
10. Morrison, B., Striebel, K., Ross, P. N., and Andricacos, P. C.,Kinetic studies using a
rotating cylinder electrode: Part I. Electron transfer rates in ferrous/ferric sulfate on
platinum. Journal of electroanalytical chemistry and interfacial electrochemistry,
1986. 215(1-2): p. 151-160.
11. Gabe, D. and Robinson, D., Mass transfer in a rotating cylinder cell—II. turbulent
flow. Electrochimica Acta, 1972. 17(6): p. 1129-1137.
12. Robinson, D. and Gabe, D., High Speed Electrodeposition of Copper from
Conventional Sulphate Electrolytes. Transactions of the IMF, 1970. 48(1): p. 35-42.
13. Singh, P.C. and Mishra, P., Mass transfer to newtonian and non-newtonian fluids
from rotating cylinders. Chemical Engineering Science, 1980. 35(7): p. 1657-1666.
14. Cornet, I. and Kappesser, R., Cathodic protection of a rotating cylinder. TRANS INST
CHEM ENG, 1969. 47(7): p. 194-197.
15. Silverman, D., Simplified equation for simulating velocity-sensitive corrosion in the
rotating cylinder electrode at higher Reynolds numbers. Corrosion, 2003. 59(3): p.
207-211.
16. Makrides, A. and Hackerman, N., Dissolution of Metals in Aqueous Acid Solutions II.
Depolarized Dissolution of Mild Steel. Journal of The Electrochemical Society, 1958.
105(3): p. 156-162.
17. Gabe, D. and Walsh, F., The rotating cylinder electrode: a review of development.
Journal of Applied Electrochemistry, 1983. 13(1): p. 3-21.
18. Theodorsen, T. and Regier, A., Experiments on drag of revolving disks, cylinders,
and streamline rods at high speeds. 1944.
19. Kappesser, R., Cornet, I., and Greif, R., Mass transfer to a rough rotating cylinder.
Journal of the Electrochemical Society, 1971. 118(12): p. 1957-1959.
20. Gabe, D. R., Wilcox, G. D., Gonzalez-Garcia, J., and Walsh, F. C.,The rotating
cylinder electrode: its continued development and application. Journal of Applied
21. Poulson, B., Mass transfer from rough surfaces. Corrosion Science, 1990. 30(6): p.
743-746.
22. Holland, F.S., Method of producing metal powder. 1977, Google Patents.
23. Makanjuola, P. and Gabe, D., A study of roughness and mass transfer enhancement
for the rotating cylinder electrode. Surface Technology, 1985. 24(1): p. 29-44.
24. Sedahmed, G. H., Khalik, A. A., Abdallah, A. M., and Farahat, M. M., Mass transfer
at rotating finned cylinders. Journal of Applied Electrochemistry, 1979. 9(5): p.
563-566.
25. Landau, U. "AIChE Symposium Series 204." Vol. 77 (1981): 75-87.
26. Tran, T., Brown, B., and Nesic, S., Corrosion of Mild Steel in an Aqueous CO2
Environment – Basic Electrochemical Mechanisms Revisited. NACE International.
27. Evgeny, B., Hughes, T., and Eskin, D., Effect of surface roughness on corrosion
behaviour of low carbon steel in inhibited 4 M hydrochloric acid under laminar and
turbulent flow conditions. Corrosion Science, 2016. 103: p. 196-205.
28. Asma, R., Yuli, P., and Mokhtar, C., Study on the effect of surface finish on corrosion
of carbon steel in CO2 environment. Journal of Applied Sciences, 2011. 11(11): p.
2053-2057.
29.
Makanjuola, P. and D. Gabe, A study of roughness and mass transfer
enhancement for the rotating cylinder electrode. Surface Technology, 1985.
24(1): p. 29-44.
30. Busse, A., Lützner, M., and Sandham, N.D., Direct numerical simulation of turbulent
flow over a rough surface based on a surface scan. Computers & Fluids, 2015. 116:
p. 129-147.
31. Nordsveen, M., Nešic, S., Nyborg, R., and Stangeland, A., A mechanistic model for
carbon dioxide corrosion of mild steel in the presence of protective iron carbonate
films-Part 1: Theory and verification. Corrosion, 2003. 59(5): p. 443-456.
32. Reiss, L.P. and Hanratty, T.J., An experimental study of the unsteady nature of the
viscous sublayer. AIChE Journal, 1963. 9(2): p. 154-160.
33. Dawson, D.A. and Trass, O., Mass transfer at rough surfaces. International Journal
of Heat and Mass Transfer, 1972. 15(7): p. 1317-1336.
35. De Waard, C. and Milliams, D., Carbonic acid corrosion of steel. Corrosion, 1975.
31(5): p. 177-181.
36. Remita, E., et al., Hydrogen evolution in aqueous solutions containing dissolved CO
2: quantitative contribution of the buffering effect. Corrosion Science, 2008. 50(5): p.
1433-1440.
37. Vetter, K.-J., Bruckenstein, S., and Howard, B., Electrochemical Kinetics: Theoretical
Aspects: Sections 1, 2 and 3 of Electrochemical Kinetics: Theoretical and
FIGURE CAPTIONS
FIGURE 3. Schematic of the RCE three electrode cell.
FIGURE 4. (a) 3D and (b) 2D profile of second roughest RCE sample considered in this study (6 µm).
FIGURE 3. Potentiodynamic sweeps conducted in HCl solution at pH 3 purged with N2, T=25 °C and 1 wt.% NaCl using a smooth RCE sample surface.
FIGURE 4. Comparison of mass transfer coefficient for a smooth surface with the Eisenberg et al.
correlation.
FIGURE 5. Potentiodynamic sweeps conducted in HCl solution at pH 3 purged with N2, T=25 °C, 1 wt.% NaCl, 1000 rpm: (a) without correcting the current density for the true area (b) with correction of
current density for the true area.
FIGURE 6. Percentage enhancement in mass transfer coefficient from that determined for a smooth
RCE sample as a function of surface roughness and velocity in N2 solution, T=25°C, 1 wt.% NaCl and pH=3 for limiting currents (a) based on projected area (b) with correction for the true area.
FIGURE 7. Measured and predicted mass transfer coefficient as a function of surface roughness and
velocity in N2 solution, T=25°C, 1 wt.% NaCl and pH=3 for limiting currents corrected using the actual surface area of each sample.
FIGURE 8. Comparison between the Poulson [21] and Gabe and Makanjuola correlation [7] with
experimental Sherwood number based on sample projected area for: (a) d/e=2000 (b) d/e= 353.
FIGURE 9. Sherwood number vs Reynolds number for different degrees of roughness.
FIGURE 10. Potentiodynamic sweeps conducted in N2 solution at pH 4, T=25 °C, 1 wt.% NaCl and different RCE speeds on a smooth sample.
Figure 11. Potentiodynamic sweeps conducted in CO2 solution at pH 4, T=25 °C, 1 wt.% NaCl and different RCE speeds on a smooth sample.
FIGURE 12. (a) Comparison between mass transfer coefficient for smooth samples in N2 solution at pH 3 and pH=4 T=25 °C, 1 wt.% NaCl and different RCE speeds (b) Limiting currents for smooth
samples in CO2 and N2 solution at pH 4, T=25 °C, 1 wt.% NaCl and differen t RCE speeds (c) Comparison between Vetter’s correlation and limiting currents of H2CO3.
TABLE CAPTIONS
TABLE 3 Experimental test matrix.
TABLE 4 RCE surface properties of the four samples considered in this study.
TABLE 3 Fluid and species properties [30].
TABLE 4 Reference diffusion coefficients for each species [30].
TABLE 5 Estimates of viscous sublayer thickness as a function of RCE speed in comparison to
![FIGURE 8. Comparison between the Poulson [21] and Gabe and Makanjuola correlation [7] with experimental Sherwood number based on sample projected area for: (a) d/e=2000 (b) d/e= 353](https://thumb-us.123doks.com/thumbv2/123dok_us/1886903.146139/16.595.78.503.509.719/figure-comparison-poulson-makanjuola-correlation-experimental-sherwood-projected.webp)
![TABLE 3 Fluid and species properties [31].](https://thumb-us.123doks.com/thumbv2/123dok_us/1886903.146139/17.595.167.431.92.219/table-fluid-and-species-properties.webp)