Int. J. Electrochem. Sci., 10 (2015) 4732 - 4741
International Journal of
ELECTROCHEMICAL
SCIENCE
www.electrochemsci.org
Low Pressure Plasma Voltage Process for Transformer
Coupling Plasma Dry Etching
Chi-Yuan Lee*, Huan-Chih Peng, Shuo-Jen Lee, Chuan-Sheng Chiou, Wei-Pin Lee, Chao-Hsuan Tsai Department of Mechanical Engineering, Yuan Ze Fuel Cell Center, Yuan Ze University, Taoyuan, Taiwan, R.O.C.
*
E-mail: [email protected]
Received: 29 January 2015 / Accepted: 8 April 2015 / Published: 28 April 2015
Plasma is used to application with wide range which used the structure of transformer coupling plasma (TCP) to generate and keep the plasma stability. This study applied Paschen’s Law to analyze breakdown voltage when argon gas is used to control pressure in a process chamber. Changes in radio frequency power were detected by observing variations in plasma voltage. As the use of nano process increases, the experimental results can be used to predict plasma voltage and to optimize stability of the plasma source.
Keywords: Plasma; dry etching; TCP; Paschen’s Law
1. INTRODUCTION
The plasma has been extensively used in various fields for integrate circuits (IC), micro-electro-mechanical systems (MEMS) and electrochemical devices [1-3]. The electronic chips in LCD panels or household appliances are closely related to the plasma. The plasma is generally applied to the dry etching process of semiconductor. The plasma is used for dry etching on silicon wafer. The tested accurate etching rate is applied to different processes. The plasma is electrically neutral, but the positively or negatively charged molecules are very active. They react with other gas molecules, thereby can be extensively used in semiconductor dry etching process.
increase the chip computing speed greatly. The present nanotechnology has evolved from the early 90 nm process into 20 nm process over a course of several years. In order to develop a more advanced nanotechnology, the change in the plasma under low pressure has been researched actively. Theoretically, when the reaction chamber is in vacuum state, as the mean free path of gas is increased, it contributes to the generation of plasma. However, if the radio-frequency power is too high, the activity of gas molecules in the reaction chamber is increased greatly. As the pressure in the reaction chamber is low, the plasma formation is likely to be influenced by the radio-frequency power. If the plasma is unstable, the etching rate will be influenced significantly.
According to the published literatures [4-11] to form extensive and uniform glow plasma in the atmosphere, the electrode structure, discharge gas and power supply frequency are the key factors.
Paschen's Law [12 was concluded rom the plasma e periment by riendrich Paschen in . admilo i -Rad eno i [13] discussed the disruptive voltage of different gases changed after the distance between parallel plate electrodes was changed. It is equivalent to the extension of Paschen's Law.
Park [14] indicated that the gas molecule collapse of radio frequency plasma in the atmosphere depended on the type of gas. When the radio-frequency power is 13.56 MHz, the disruptive voltage is closely correlated with the decomposition of pressure and space. This is similar to Paschen's Law that the variance in disruptive voltage is related to the radio-frequency power. If the gas molecules increase in the process, as the gas molecules will not be ionized, the disruptive voltage increases greatly.
Lisovskiy [15] studied the disruptive voltage between radio-frequency power and gas molecules. The charge in the argon and hydrogen radio-frequency power was measured under low pressure to discuss the decay of charge particles in the disruptive voltage derived from radio-frequency power and gas molecules in different processes.
Verdonck [16] explain, briefly and simplified, the most used plasma etching techniques and give an overview of the basic etch mechanisms as they are accepted today.
You [17] indicated that compared to conventional RF plasma sources such as inductively coupled plasma (ICP) or capacitively coupled plasma (CCP), transformer-coupled toroidal plasma (TCTP) demonstrates a higher power density (near 5~10 W/cm3) and neutral gas temperature (temperatures of several thousands of Kelvin) [18].
The aim of the investigation is that as the use of nano process increases, the experimental results can be used to predict plasma voltage and to optimize stability of the plasma source.
2. EXPERIMENTAL PRINCIPLE
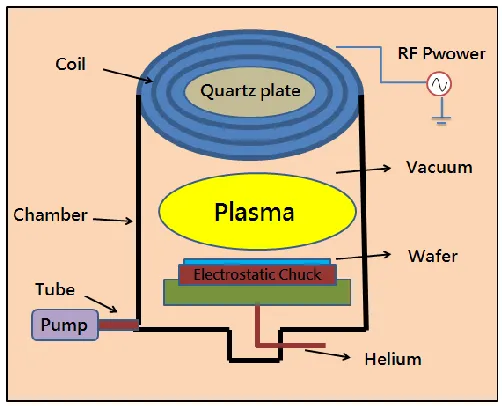
[image:3.596.172.423.283.486.2]
window, and the radio-frequency current through the coil generates a time-varying magnetic field circling the current direction. This magnetic field penetrates through the dielectric window. An electric field opposite to the radio-frequency current is generated inductively in the plasma chamber. This electric field accelerates electrons and forms plasma current inductively. This electromagnetic induction mechanism is identical with transformer principle. The coil is the primary side of transformer, and the plasma is the secondary side. When the inductive coupling plasma is at low input power (low plasma density), the coupling of radio-frequency power is mainly the capacitive effect resulted from high potential difference between coil and plasma. Only if the formed plasma current is higher than a low threshold current value, the mechanism generated by plasma can be operated in inductive coupling mode. As the power absorption of inductive coupling mode is better than that of capacitive coupling mode, the plasma density is increased significantly.
Figure 1. Schematic of TCP.
3. RESULTS
This experiment used inert gas argon, and applied TCP to generate and maintain plasma. The disruptive voltage of plasma under low pressure was determined upon Paschen's Law.
3.1 Disruptive voltage test 3.1.1 Gas flow control test
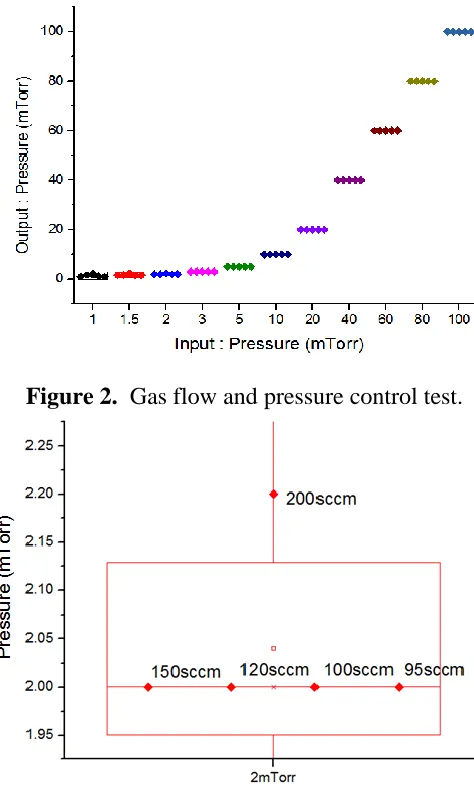
forming plasma is to control the pressure properly. Generally, the gas flow for dry etching is 20 to 500 sccm, and can be controlled below 100 mTorr accurately by pressure controller. The gas flow was set as 200, 150, 120, 100 and 95 sccm respectively in this experiment. The pressure controller was used for low pressure test. According to the experimental result in figure 2, when the gas flow is 95 to 200 sccm, the pressure inside the reaction chamber can be controlled accurately. It is stable even under 3 mTorr.
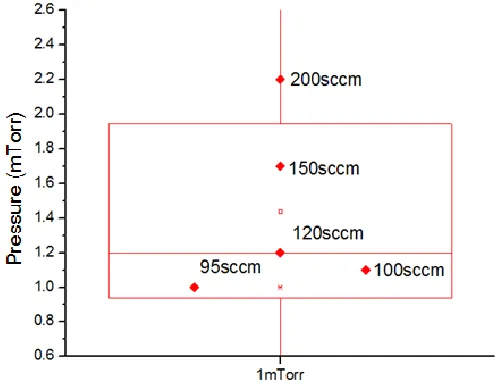
According to the experimental result in figure 3, when the pressure is controlled at 2 mTorr, the gas flow 200 sccm cannot control the 2 mTorr pressure inside the reaction chamber. The minimum pressure approaches to 2.2 mTorr. The remainder gas flow is still in the control range.
According to the experimental result in figure 4, when the pressure is controlled at 1.5 mTorr, the gas flow 200 and 150 sccm are controlled under 2.2 and 1.7 mTorr respectively. The pressure cannot be controlled in the reaction chamber accurately.
According to the experiment in figure 5, when the pressure is as low as 1 mTorr, only 95 sccm gas flow can be controlled accurately. The remainder gas flow at 100, 120, 150 and 200 sccm can be controlled under 1.1, 1.2, 1.7 and 2.2 mTorr respectively. In order to meet all the pressure conditions, the gas flow is set as 95 sccm for testing disruptive voltage.
Figure 2. Gas flow and pressure control test.
[image:4.596.176.413.347.747.2][image:5.596.171.416.78.264.2]
Figure 4. Low pressure control test (1.5 mTorr).
Figure 5. Low pressure control test (1 mTorr).
3.1.2 Radio-frequency power test
According to the pressure control result in Section 3.1.1, there are no severe problems in general gas flow for pressure control. However, if the pressure is too low, when the gas flow is changed, it is unstable. According to the test result in figure 6, when the pressure is controlled within 3 to 100 mTorr, the pressure is stable. In order to test the disruptive voltage, the gas flow is set as 95 sccm and the reaction chamber pressure is controlled at 10 mTorr.
[image:5.596.164.414.334.526.2][image:6.596.174.426.132.319.2]
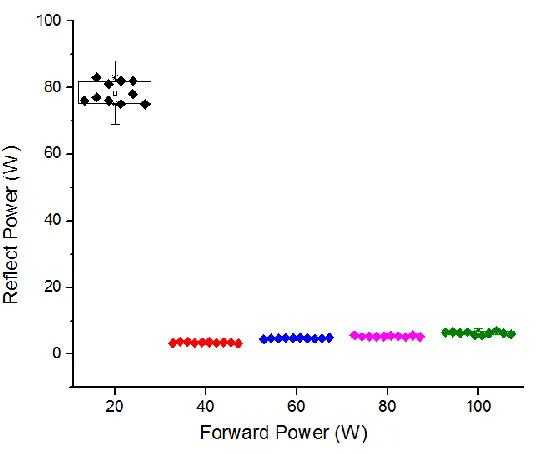
According to the experimental result, stable plasma can be generated easily below 100 W radio-frequency power output.
Figure 6. Pressure stabilization area.
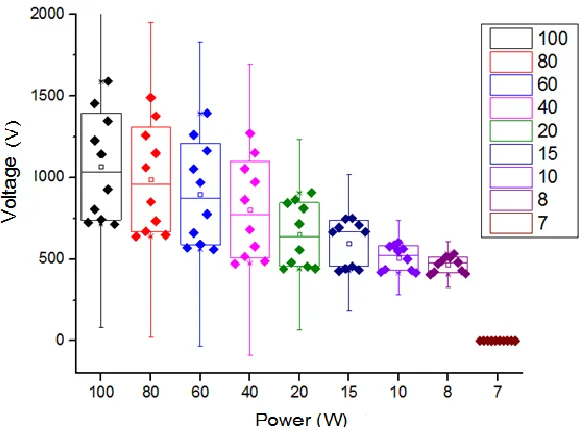
[image:6.596.165.434.504.731.2]Figure 7 shows the test result of input radio-frequency power based on 10 mTorr. When the 100 W radio-frequency power is imported into the reaction chamber, only 7 to 10 W power is consumed, meaning that the plasma in the reaction chamber is very stable. When the radio-frequency power output is increasingly low, the consumed power decreases gradually, but the consumed proportion of power increases. The result shows that when the radio-frequency power is 20 to 40 W, the radio-frequency power consumption in the reaction chamber is very high, even higher than its output power. This suggests that the plasma in the reaction chamber is very unstable.
[image:7.596.154.447.370.584.2]
Figure 8. Radio-frequency power test (24 ~ 30 W).
Figure 9. Plasma threshold test.
plasma state can be maintained. In sum, the reaction chamber pressure is controlled by argon gas flow, combined with the output of radio-frequency power. The disruptive voltage (plasma potential) can be obtained.
As shown in figure 9, the plasma potential can be increased by increasing the flow rate of gas molecules. When the radio-frequency power is lower than 7 W, the plasma cannot be generated. Even if the gas flow in the reaction chamber is increased to increase the probability of collision between gas molecules, the plasma cannot be generated.
3.1.3 Plasma potential test
According to the experimental results in Sections 3.1.1 and 3.1.2, 95 sccm argon flows in the reaction chamber to increase the pressure gradually (0.5~100 mTorr), the radio-frequency power output is fixed at 25 W to research the variance in plasma potential.
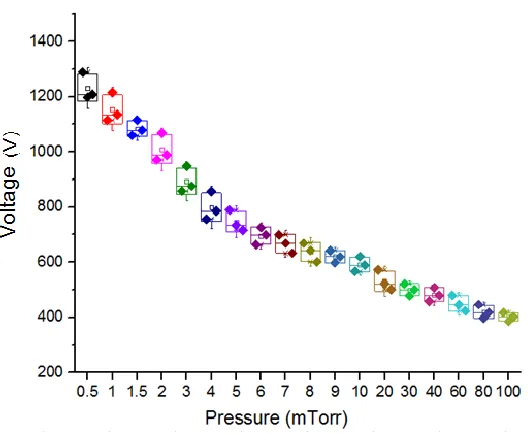
[image:8.596.168.432.385.602.2]As seen in figure 10, if the radio-frequency power is fixed, the plasma potential increases as the pressure inside the reaction chamber decreases. When the pressure inside the reaction chamber is lower than 5 mTorr, the plasma potential is changed greatly. When the pressure increases gradually, the plasma potential decreases and becomes stable gradually.
Figure 10. Relationship between plasma potential and pressure variation.
[image:9.596.178.420.220.454.2]
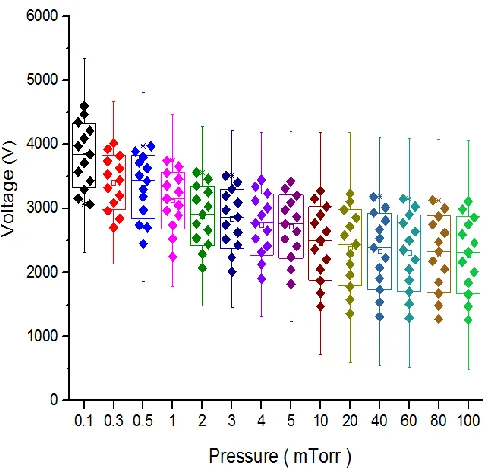
the gas molecule reaction in the reaction chamber. The gas molecule reaction becomes more intense as the radio-frequency power increases, and the plasma potential increases accordingly. Similarly, the plasma potential increases as the pressure inside the reaction chamber decreases. This study applied Paschen’s Law to analyze breakdown oltage when argon gas is used to control pressure in a process chamber. Changes in radio frequency power were detected by observing variations in plasma voltage. This paper is different from the published literatures [16-18], as the use of nano process increases, the experimental results can be used to predict plasma voltage and to optimize stability of the plasma source.
Figure 11. Relationship between high radio-frequency power and plasma potential.
4. CONCLUSION
The formation of plasma is easy, but it is difficult to be controlled accurately. The plasma generated in the dry etching process contains a certain plasma potential, which determines the overall concentration of plasma. The plasma concentration affects the DC bias, i.e. the result of dry etching, directly. The plasma potential discussed in this paper is based on minimum and stable plasma, and tested under different pressures to observe the result of variation. In sum, the concentration of plasma can be predicted, and the plasma potential is adjusted according to the process requirement, thus controlling the etching rate accurately.
ACKNOWLEDGEMENTS
References
1. V. M. Donnelly, A. Kornblit, J. Vac. Sci. Technol. D: App. Phys. A 31 (2013), 050825-050848. 2. C. Y. Lee, R. D. Huang, Int. J. Hydrog. Energ. 37 (2012) 3459-3465.
3. C. Y. Lee, S. J. Lee, Y. H. Chen, M. Y. Chung, K. C. Han, Y. M. Chang, M. S. Tang, Int. J. Electrochem. Sci. 8 (2013), 2968-2976.
4. T. Yokoyama, M. Kogoma, T. Moriwaki, S. Okazaki, J. Phys. D: App. Phys. 23 (1990), 1125-1128.
5. S. Kanazawa, M. Kogoma, T. Moriwaki, S. Okazaki, J. Phys. D: App. Phys. 21 (1988), 838-840. 6. . a i . admilo i - ad eno i . u ako . ar ano i . ari . L. Petro i , IEEE
Trans. Plasma Sci. 39 (2011), 2556-2557.
7. E. Sili, F. Koliatene, J. P. Cambronne, Electrical Insulation and Dielectric Phenomena (CEIDP), 2011 Annual Report Conference on (2011), 464-467.
8. D. R. Nicholson, Introduction to Plasma Theory, John Wiley & New York (1983).
9. N. A. Krall, A. W. Trivelpiece, Principles of Plasma Physics, McGraw-Hill, New York (1973). 10.S. Selberherr, Analysis and Simulation of Semiconductor Device Equations, Springer, Wien, New
York (1984).
11. . . Phelps . L. Petro i , Plasma Sources Sci Technol. 8 (1999). 12.R. Woo, Proceedings of the IEEE 62 (1974), 521.
13. . admilo i - ad eno i . ad eno i , M. Klas, . ate čik Micro & Nano Lett. 7 (2012), 232-234.
14.J. Park, I. Henins, H. W. Herrmann, G. S. Selwyn, J. App. Phys. 89 (2001), 15-19. 15.V. A. Lisovskiy, V. D. Yegorenkov, J. Phys. D: App. Phys. 31 (1998), 3349-3357. 16. P. erdonck O icina de icro abrição: Pro eto e Construção de CI’s O (2006). 17. D. You, Y. S. Lee, J. B. Lee, H. Y. Chang, Current App. Phys. 15 (2015), 183-189.
18. B. Bai, An Experimental Study and Modeling of Transformer-coupled Toroidal Plasma Processing of Materials (PhD diss.), Massachusetts Institute of Technology (2006).