A STUDY
OF
GENETIC VARIATION IN NATURAL POPULATIONSOF
DROSOPHILA MELANOGASTERby
James Chengshan Jiang,
Molecular and Population Genetics Group
Research School of Biological Sciences,
The Australian National University
Canberra
A thesis submitted for the degree of Doctor of Philosophy of the Australian National University
Declaration
(!)((~pt
The research work described in this thesis, expect where acknowledged, is the original work of the author.
James Chengshan Jiang
Material presented in Chapter 2 and Chapter 4 has been published in Heredity:
Jiang, C., Gibson, J.B., Chen, H. 1989.
Genetic differentiation in populations of Drosophila melanogaster from the People's Republic of China: comparison with patterns on other continents.
Heredity, 62: 193-198.
Jiang, C., Gibson, J.B., Wilks, A.V. and Freeth, A.L. 1988. Restriction endonuclease variation in the region of the alcohol dehydrogenase gene: a comparison of null and normal alleles from natural populations of Drosophila melanogaster.
Acknowledgements
I thank my supervisor Dr. John Gibson for his guidance, encouragement and patience over my past four year Ph.D course, and I thank my advisors Dr. George Miklos and Dr. Allan Freeth for sharing their knowledge so freely.
The scientists and students who work or had worked in our group are so friendly and helpful: Ann Wilks, Anh Cao, Darryl Reed and Dr.
e
Peter Cooixprovided excellent technical instruction and assistance; Jane Symonds, Dr. John Oakeshott, Birt Kohlmann, Peter Mathews, Dr. Adam Marchant and Dr. Dave Shaw provided valuable discussion.
I thank Ross Cunningham, Birt Kohlmann, David Sandiland, Steven Ball and Cathy Condon for their assistance in statistics and computer operation, Gary Brow and James Whitehead for the illustrations for my thesis.
I thank my Chinese colleague Huazhong Chen and Professor C.C.Tan for their assistance in collecting flies from China.
I thank Dr. Adam Marchant, Jane Symonds and Jeremy Brunhl for the help in proofreading the manuscript.
I am grateful for the financial support: for one year from the state educational committee of Poeple's Republic of China and for three years from the Australian National University Postgraduate Scholarship.
Finally I thank my wife Ye Chen for her encouragement and pleasant
Abstract
This thesis is concerned with genetic geographic differentiation in natural populations of Drosophila melanogaster.
An electrophoretic survey has been carried out of allozyme frequencies at eight loci in eight natural populations from China. The Chinese data were collated with the data from Japanese populations. The analyses showed that the frequencies of G6pcf', Est-61.00 and Adhs were significantly correlated with latitude. Whilst the variation in
t.
Est-6l.OO was opposite to that previous reported/ ~hese results showed
the generality of latitudinal clines of Adhs and G6pcf' frequencies in the Chinese populations of Drosophila melanogaster. Previous work had show~that at least Adh5 , G6pcf', Est-61 - 00 , odhF and Pgcf' frequencies varied latitudinally in North America, Eurasia and Australasia.
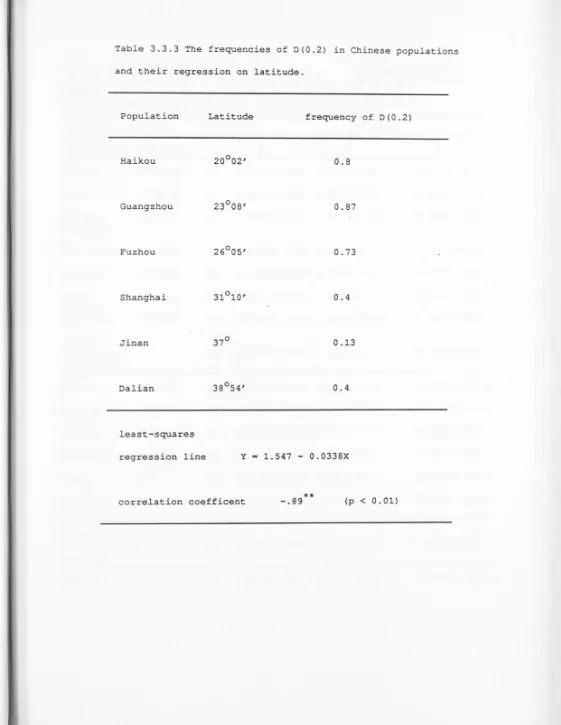
104 and 90 second isochromosome lines were extracted from seven Australian and six Chinese populations respectively, along the Adh cline. Restriction mapping of these chromosomes indicated that there is no consistent relationship between restriction endonuclease variation and latitude, except for a 0.2kb deletion which decreases in frequency with distance from the equator in the Chinese populations.
Overall, the levels of nucleotide substitution and haplotype diversity are higher in Australian populations than in Chinese populations. The analyses of restriction endonuclease variation frequencies showed that the populations in the island of Tasmania differ from those on the Australian mainland. The level of heterozygosity is higher for the haplotypes with Adh 5 than for those with AdhF. Chromosomes bearing AdhF heat resistant alleles have the lowest heterozygosity, reflecting the history of alleles
~,.,,,,~sf;''!
rl'l4!re~t"r
o-r,'li"
tJf'11,est
a.!l~/~i.
to mobile elements Bl04B and FlOl respectively. None of the insertions occurred in the Adh coding region.
Amongst chromosomes assayed for ADH activity most had normal intact Adh gene, only one null and one partial duplicated Adh gene were found in 104 Australian and 90 Chinese lines. ADH activity assays on the Australian and Chinese population samples indicated that the levels of ADH activity vary between different populations. The ADH activity levels in populations depend on the frequencies of AdhF since on average the ADH activity of AdhF alleles is twice as high as in Adh 5 alleles. The mean ADH activities of the AdhF and Adhs bearing chromosomes vary between different geographic regions. Estimates of amount of ADH protein in 52 high and low ADH activity lines of AdhF and Adh 5 showed that both the catalytic efficiency and the amount of ADH protein make contributions to the difference in mean activity between AdhF and Adhs.
There is no consistent relationship between restriction endonuclease variants and ADH activity, except that some large insertions in the functional region of the Adh gene affect the expression of the gene. A significant linkage disequilibrium between the restriction site variant BamHI(-7.2) and the Adh5 allele was found in most populations studied, and 5' recombination involving this site may affect ADH activity in some cases.
A comparison of the restriction endonuclease maps of normal and null Adh alleles showed that twelve Adh null alleles from three Tasmanian populations share the same haplotype as four normal Adh5 alleles. This suggested that the Tasmanian Adh null alleles have a
common origin.
TABLE OF CONTENTS
CHAPTER 1: GENERAL INTRODUCTION 1
CHAPTER 2: ALLOZYME FREQUENCIES IN CHINA: COMPARISON WITH PATTERS ON OTHER CONTINENTS
2.1 Introduction
2.2 Materials and Methods
2.2.1 Sample collection and maintenance
2.2.2 Electrophoresis conditions and stains 2.2.3 Climate data
2.3 Results 2.4 Discussion
CHAPTER 3: NATURALLY OCCURRING RESTRICTION ENDONUCLEASE VARIATION IN THE REGION OF THE Adh
14
16 16
16
19
20
21
3.1 Introduction 29
3.2 Materials and Methods 34
3.2.1 Extraction of single chromosome lines 34
3.2.2 Genomic DNA extraction 34
3.3.3 Plasmid probe 36
3.3.4 Isolation of plasmid DNA 36
3.2.5 DNA sample digestion and electrophoresis 37
3.2.6 Hybridization of southern blots 38
3.3 Results 40
CHAPTER 4: RESTRICTION ENDONUCLEASE VARIATION IN THE REGION OF Adh NULL GENES: A COMPARISON
OF NULL AND NORMAL ALLELES FROM NATURAL TASMANIAN POPULATIONS OF DROSOPHILA MELANOGASTER
4.1 Introduction
4.2 Materials and Methods 4.2.1 Stocks
4.2.2 ADH electrophoresis 4.2.3 DNA extraction
4.2.4 Restriction endonuclease digests and electrophoresis of DNA
4.2.5 Hybridisation and.construction of restriction maps
4.3 Results 4.4 Discussion
CHAPTER 5: IDENTIFICATION OF INSERTIONS IN THE REGION OF THE Adh GENE OF DROSOPHILA MELANOGASTER
WITH KNOWN MOBILE ELEMENTS 5.1 Introduction
5.2 Materials and Methods
5.2.1 Clones for mobile elements 5.2.2 Extraction of plasmid DNA 5.2.3 Cloning the insertions
5.3 Results 5.4 Discussion
49 52 52 53 54
54
55 55 57
CHAPTER 6: VARIATION IN ADH ACTIVITY IN AUSTRALIAN AND CHINESE
POPULATIONS OF DROSOPHILA MELANOGASTER 6 .. 1 Introduction
6.2 Materials and Methods
6.2.1 ADH activity assay
6.2.2 Radial imrnunodiffussion
6. 3 Results
6.4 Discussion
CHAPTER 7: GENERAL DISCUSSION
REFERENCES
75
82
82
83 84
90
96
CHAPTER 1
Chapter 1 1
Chapter l.General Introduction
My work in this thesis is concerned with genetic variation in natural populations of Drosophila melanogaster.
The application of the technique of protein gel electrophoresis first revealed large amounts of genetic variation in natural populations (Harris, 1966; Lewontin and Hubby, 1966). This technique made i t possible to investigate directly levels of heterozygosity in natural populations. Over the next ten years investigations of allozyme variation in natural populations of animals and plants studied 243 species (Nevo, 1978). To date more than 1000 unrelated species worldwide have been studied (Nevo, 1989).
The large amounts of genetic variation found in natural populations (about 30% of loci were found to be polymorphic, Lewontin 1985) have been explained on the basis of two controversial theories: the neutralist and selectionist viewpoints. The neutralists claimed that the variation observed is essentially composed of non-selective mutations whose frequencies in natural populations are a consequence of random genetic drift and migration. They argued that since nearly all new mutations are deleterious, these mutations are eliminated by natural selection from natural populations. The variation that remains polymorphic consists of transient alleles of no adverse fitness effects, or slightly deleterious, effect on the organism. The selectionists argued that the observed variation is held in stable balance by forces of natural selection. The study of geographic patterns of genetic variation in natural populations became an important topic in attempts to explain the variation.
Chapter 1 2
vary non-randomly between loci, populations, species, habitats and life zones, and are correlated with ecological heterogeneity. Natural selection may often be the major determinant of genetic populatior. structure ·and differentiation. Drosophila species show significantly higher levels of polymorphism and heterozygosity than most other species studied (Kojima et al., 1970; Richmond, 1972; Ayala and Tracey
z
1974; Ayala et al., 1971, 1974 a, b) The mean polymorphism (P) for Drosophila species is 0.431, while for other species it is 0.263; the mean heterozygosity (H) for Drosophila is 0.14, for other species it is 0.074 (Nevo 1978)
Drosophila melanogaster occurs worldwide associated with human habitation. It is found predominantly in domestic habitats, such as gardens, orchards, vineyards and garbage dumps. This species has been extensively studied and the polytene chromosomes and linkage maps are well known (Ashburner and Novitski, 1976; Lemeunier et al., 1986) and genetic manipulation is possible. These advantages make Drosophila melanogaster good material for the study of genetic variation in natural populations.
According to previous work (Lemeunier et al., 1986, David and Capy, 1988) a good deal of the genetic variation in Drosophila melanogaster populations shows geographic differentiation or latitudinal clines (table 1.1). This variation includes morphological, physiological, and behavioral traits, and particularly allozyme frequencies, chromosomal inversions etc. The variation in allozyme frequencies and chromosomal inversions directly reflect the genetic structure of the populations, whilst the genetic components of other variables are more complex, although they might often have some direct
Chapter 1 3
Explanations for any of the geographic differentiation found in Drosophila melanogaster could involve the effects of migration, of
geographic isolation or of some environmental selective factors (Endler 1977).
The species Drosophila melanogaster is believed to have arisen in central Africa 2-3 million years ago (David and Capy, 1988; Lachaise et al., 1988). The evidence for this is that: (l)six out of eight
members of Drosophila melanogaster species group are endemic to the Afrotropical region, (2)most of the polymorphic alleles found from the populations from other parts of the world have been found in populations of the Afrotropical region, and (3)the populations on the Afrotropical mainland are apparently genetically sub-divided, which is expected in long established populations between which there is restricted gene flow (David and Capy, 1988). The colonization of Eurasia by Drosophila melanogaster from central Africa without the agency of man occurred at least 10-15 thousand years ago (Lachaise et al., 1988). The colonization of America and Australia by Drosophila
melanogaster from Afrotropical and Eurasia probably occurred via the
agency of modern man only a few centuries ago (Capy et al., 1986; Jallon and David, 1988).
Thus some of the observed geographic genetic differentiation in Drosophila melanogaster may be explained as a result of historical
Chapter 1 4
melanogaster seem to be examples of this process - the frequencies of
P elements and virus type II decrease with increasing distance from the ancestral locations (North America for P element, Anxolabehere et al., 1985; David and Capy, 1988; France for virus type II, Fleuriet, 198 6) .
Chapter 1 5
A third explanation for the geographic differentiation of genetic variation is that the genetic variation is maintained by natural selection. Latitudinal clines of chromosomal inversions and allozyme frequencies have been claimed to arise from the results of environmental selection (Oakeshott et al., 1981, Knibb, 1982; Oakeshott et al.,1982; Singh et al., 1982; Oakeshott et al., 1983a,b; Singh and Rhomberg, 1987) Drosophila melanogaster is highly
polymorphic for chromosome inversions. The first survey of natural populations of Drosophila melanogaster for inversions by cytological methods was carried out by Dubinin (1937). 362 different inversions have been described (Lemeunier et al.,1986), and the majority of the inversions (316) are paracentric. Four inversions were found to be cosmopolitan: In(2L)t, In(2R)NS, In(3L)P and In(3R)P - they occur in most natural populations, often at a frequency greater than that of the standard sequence.
Chapter 1 6
frequency and latitude. Even for the exception, In(2R)NS, the coefficients are negative and the partial correlation coefficient is
close to statistical significance (Knibb, 1982). There are no
signifi~ant differences either between inversions or between
continents in the slope of the latitudinal clines. The data did not
show any consistent relationship between inversion frequency and
climatic factors in the three regions (Knibb et al. , 1981; Knibb, 1982) .
Explanations for the latitudinal clines in both hemispheres
invoking only random processes can be discounted because of the
similar directions and immense geographic scale of the clines. It also
seems unlikely that the observed distribution could reflect the spread
ly
of inversions which arose equatorially but are selectiv,?{advantageous
throughout the species range, since the same directions of inversion
clines were observed in North America (Voelker et al., 1977) and
Australia (Knibb, 1982) in which the patterns of colonization by
Drosophila melanogaster differ. The similarity in the clines in three
regions with very different histories of settlement and agricultural
practices has been interpreted as convincing evidence for some kind
of latitudinally varying selection pressure (Knibb 1982) .
Latitudinal clines for allozyme frequencies of Drosophila
melanogaster populations were f i r s t reported at the alcohol
dehydrogenase (Adh) locus in North America (Pipkin et al., 1973; Vigue and Johnson, 1973). Surveys of allozyme frequencies were extended to
more loci and more geographic regions. Singh et al., (1982) studied allozyme frequencies at 26 gene loci in nine populations of Drosophila
melanogaster from five different continents. Seven loci
(Lap-Chapter 1 7
D) and Octanol dehydrogenase (Odh)) showed paral lel north-south patterns in allozyme frequencies which varied latitudinally. Oakeshott et al., (1981, 1982, 1983a,b) collated allozyme frequencies from natural populations sampled in North America, Asia, and Europe with their data for Australasia. They found that five allozyme loci (Adh,
G6pd, 6-phosphogluconate dehydrogenase (Pgd), Odh and Est-6) showed significant latitudinal clines in all of these geographic regions . Later Singh and Rhomberg (1987) surveyed 117 gene loci in 15 populations of Drosophila melanogaster originating from five different continents. Among 117 gene loci (coding for 79 enzymes and 38 abundant proteins) they found 61 gene loci were polymorphic and 18 polymorphic gene loci showed latitudinal variation in allele frequency in America, Europe, Africa and the Far East.
Chapter 1 8
fraction of the Adh latitudinal cline in Australia. Anderson et al.,
(1987) extensively sampled populations over a large latitudinal
transect in Australasia, and their analyses confirmed the result
gained four years earlier that the clines in Adhs frequency and
In(2L)t were independent of each other.
Since the linked chromosome inversions fail to account for the allozyme clines, these clines may be the result of natural selection
acting directly on the allozyme loci or on regions in linkage
disequilibrium with the loci. A sensitive method in principle, to
detect selection is to study the correlation between gene or genotype
frequencies and particular environmental factors. Such a study often
involves detailed biochemical and physiological investigations. This
kind of study, aimed at identifying the selective factors which may
maintain the allozyme clines, has been carried out. For example, odh 5
frequency decreases with increasing distance from the equator, and is
positively related to the average daily maximum temperature for the hottest calendar month (Tmax) in Australasia and North America
(Oakeshott et al., 1983). But consistent seasonal variation in Odh5
was not observed in either continentf (Cavener and Clegg 198la,b;
Franklin, 1981). Minawa and Birley (1978) found that Odh 5 frequency
had not diverged significantly among laboratory populations kept for
over a year at different temperatures and on different food media,
although the ODH-S allozyme has greater in vitro activity than ODH-F
(Clarke, 1982). GpdhF frequency decreases with increasing distance
from the equator (Johnson and Schaffer, 1973; Anderson,1981), but
there is no consistent relationship between the gene frequency and any
climatic factor. The relative thermostabilities of GPD-F and GPD-S
have l i t t l e effect on the temperature tolerance of Drosophila
Chapter 1 9
positively correlated with latitude in Australasia, North America and
Eurasia, but no consistent association between G6pdF frequency and
climatic variables has been found (Oakeshott,et al., 1983) though
G6PD-F is-much less thermostable than G6PD-S (Bijlsma and van der
Meulen-Bruijins, 1979). The frequency of PgdF showed a similar cline
to that of the G6pdF cline in Australasia and North America and was
correlated with Tmax (Oakeshott et al., 1983), but no difference in
thermostability has been detected between PGD-F and PGD-S allozyrnes
(Cavener and Clegg, 1981b). Est-6l.OO frequency increases with the
increasing latitude, but it was not related to any climatic variables
(Oakeshott et al., 1981). The directions of the Estl.00 cline was
opposite to the expectation based on the in vitro thermostabilities of
the allozyrnes: the thermostability of the enzyme produced by Estl.00
was greater than that produced by Est 1 · 1 0 (Danford and Beardmore,
1979) .
Amongst the latitudinal clines of allozyrne frequencies there are
more data available for the Adh cline than for any of others. The
cline was first reported in North American populations (Johnson and
Schaffer, 1973; Smith et al., 1984), and was then observed in
Australasia (Wilks et al.,1980; Anderson,1981). Later Oakeshott et
al., (1982) collated the data on Adh frequencies from North America,
Australasia, and Eurasia, and found a significant correlation between
AdhF and latitude; the frequency of AdhF increases with increasing
latitude. More recently, David et al., (1986) observed a similar
tendency between tropical African and European populations, and also
in the southern hemisphere in populations between the eqcator and
southern Africa. Using their original observations and selected
published data from various parts of the world (Africa, Australia,
Chapter 1 10
Mediterranean sea) David et al. (1988), found an overall increase of AdhF with increasing latitude, but the relationship was not simply linear. The relationship varied in three geographic regions: tropical populations (between
o
0 and 30° latitude) are generally similar having a low frequency of AdhF (average 15%) and a smooth increase with latitude; populations in a Mediterranean climate (between 300 and 420) are all similar with much higher average AdhF frequency (70%), a steeper slope and a broader range of variability at the same latitude, this phenomenon was called Mediterranean instability; cool temperate populations (above 42°, in France) have very high AdhF frequency(95%).
The Adh cline has been claimed as strong evidence for latitude-related selection~ A number of possible selective factors for the Adh cline have been carefully studied, and include differences in thermostability, temperature and alcohol tolerances between AdhF and Adh 5 lines. Often the biochemical and physiological properties were correlated with the cline, but further investigation in laboratory or natural populations failed to confirm any consistent selective factor (for details see discussion in Chapter 2). Variation in ADH activity may be related to some environmental gradients. In general the AdhF allele is associated with high activity, the Adh 5 allele with low activity and intermediate activity with the AdhFChD allele (Rasmuson et al., 1966; Gibson, 1970; Gibson, 1972; Vigue and Jonhson, 1973; Lewis and Gibson, 1978; Maroni,1978; McDonald et al.,1980). Differences in ADH activity between lines of the same genotype were found to be due to a series of linked and unlinked modifier loci (Ward
l>
Chapter 1 11
the level of ADH activity. For example Clarke et al. (1979) have shown that the amount of yeast in the media greatly changes the amount of ADH protein (a fourfold increase) and the exposure of eggs, larvae and embryos to.ethanol, induced higher ADH activity (Horikawa et al.,1967; Gibson, 1970; Bijlsma-Meeles, 1979). Gibson and Wilks (1988) found that populations breeding in a winery, where the concentration of ethanol in breeding site was higher than at sites outside the winery, had a higher level of ADH activity.
Since previous work has not revealed any consistent selective factor responsible for the Adh cline, i t must be considered a possibility that the selection may not act on the gene itself, but on factors which are linked to the gene. This possibility could be tested by surveying the-molecular variation in the region around the Adh structural gene to see if there is any linkage disequilibrium between the neighbouring molecular variation and Adh alleles, and investigating whether any of the variation shows a parallel latitudinal cline with that of AdhF frequency. For example, restriction endonuclease variants closely linked to the structural gene may be under environmental selection instead of the Adh gene itself.
Chapter 1 12
insertions. Strong non-random associations were found among some of the variants.
In my study I first aimed to survey the geographic patterns of allozyme variations in the Chinese populations, as little was known about allozyme frequency in populations of Drosophila melanogaster from mainland China. Will any allozyme frequencies show latitudinal clines in China as they do in other continents? If there are clines, will the direction of the clines in China be the same as that in other continents? If they are, then these data will support the argument that a consistent association between gene frequency and latitude in different zoogeographic zones indicates the existence of natural selection. Eight Chinese Drosophila melanogaster populations were sampled at latitudes comparable to those of Australia, and all~zyme frequencies at eight polymorphic loci were investigated in order to test the generality of the latitudinal clines of allozyme frequency in Australia and China. This work is described in Chapter 2.
My second aim is to investigate whether any factor linked with the Adh gene is responsible for the Adh cline. Restriction endonuclease variation in the 12kb region encompassing the Adh gene has been investigated in the Australian and Chinese populations to see if there is any restriction endonuclease variant which shows a latitudinal cline parallel to the Adh cline. A comparison of the restriction map variation between Australian and Chinese populations of Drosophila melanogaster might also show differences in the history of colonization by this species in the two countries, in the amount of variation between Adh genotypes. This work is described in Chapter 3. The identification of the insertions found in the investigation is
Chapter 1 13
My third main aim is to investigate ADH activity along the Adh
frequency cline in the two countries to see if i t is the same at
different latitudes. Do the ADH activity levels show a latitudinal
cline? Does the level of ADH-F or ADH-S alleloenzymes vary between
different geographic sites? Is this variation correlated with
latitude? Are there differences in ADH activity between Australian and
Chinese populations? In order to answer these questions I have assayed
ADH activity in six Chinese and seven Australian populations, and this
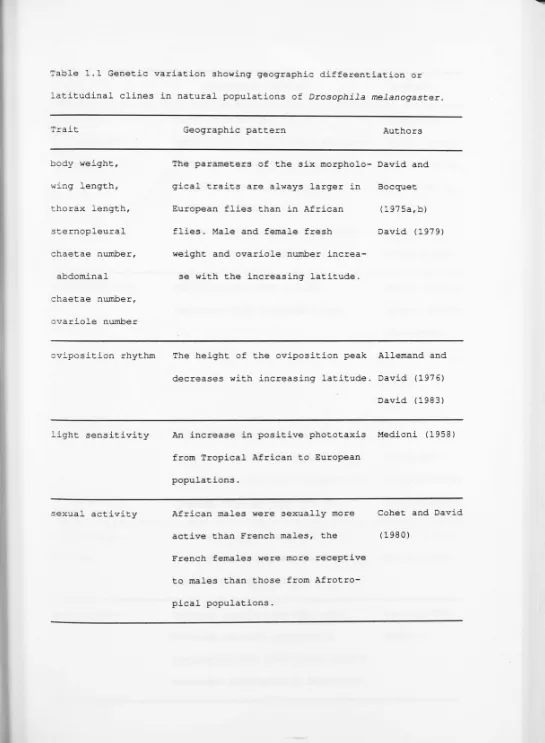
Table 1.1 Genetic variation showing geographic differentiation or
latitudinal clines in natural populations of Drosophila melanogaster.
Trait
body weight,
wing length, thorax length, sternopleural chaetae number,
abdominal
chaetae number, ovariole number
oviposition rhythm
light sensitivity
sexual activity
Geographic pattern Authors
The parameters of the six morpholo- David and
gical traits are always larger in
European flies than in African
flies. Male and female fresh
weight and ovariole number
increa-se with the increasing latitude.
Bocquet
(1975a,b)
David (1979)
The height of the oviposition peak Allemand and
decreases with increasing latitude. David (1976)
David (1983)
An increase in positive phototaxis Medioni (1958)
from Tropical African to European
populations.
African males were sexually more
active than French males, the
French females were more receptive
to males than those from
Afrotro-pical populations.
Cohet and David
[image:25.614.57.602.11.754.2]Trait
cuticular
hydrocarbons
egg production
alcohol tolerance
temperature tolerant
desiccation
Geographic pattern
Flies from Europe, North
America, and North Africa possess
significantly higher levels of
7-tricosene and
7,11-heptaco-sadiene in females and
7-tri-cosene in males than populations
from south of the Sahara.
African flies have a lower
fecundity than European flies.
Alcohol tolerance decreases
from south to north in Australian
populations, and from European to
tropical African populations.
Temperate flies were more tole-rant to cold and less toletole-rant to
heat than tropical ones.
Tropical populations were less
tolerant to high temperature,
desiccation and cold stress than a
temperate population in Australia.
Authors
Antony and
Jallon (1982);
Jallon (1984)
Antony et al.,
(1985)
Jallon and
David (1987)
David (1970);
Pianka (1970);
Bouletreau-Merle et al.,
1982);
David and
Bocquet(1975b)
Parsons(1980a)
Cohet (1980);
David (1983)
Parson, (1977,
Trait
perpetuation of the sigma virus·
P element
mitochondrial
chromosomal
inversions
Geographic pattern Authors
The frequency of virus type II dee- L'Heritier reases with increasing distance from (1970);
France. Fleuriet(l976,
1980, 1986)
The frequency of P element gradually Anxolabehere decreases from western Europe to mi- et al. (1985); ddle Asia and from the Far East to Boussy(l987); middle Asia. Along the east coast of Boussy and Australian population the frequency Kidwell(l987) of P elements decreases from north David and
to south. Capy (1988).
mtDNA show high level of local diff- Hale and rentiation in populations from
North America, Europe, Africa, South African, Australia and Asia.
Singh (1987)
The frequencies of four cosmopolitan Knibb (1982, inversions increase with decreasing 1983)
Trait
allozyrne frequency
Geographic pattern
At least five allozyrne loci show significant latitudinal clines in populations from North America, Asia, Europe and Australia.
Authors
Oakeshott, et al., (1981, 1982,1983a,b) Singh, et al. (1982); Singh and Rhomberg
CHAPTER 2
Chapter 2 14
Chapter 2: Allozyme frequencies in China: comparison with patterns on
other continents
2.1 Introduction
As the consistent latitudinal clines of allozyme frequencies over
a large geographic range in both hemispheres, and across different
zoogeographic zones, could be interpreted as convincing evidence for
natural selection in the selection-neutralist debate, it is important
to test for the consistency of such allozyme frequency clines.
Numerous studies have been made to survey allozyme frequencies in
natural populations of D.melanogaster. Oakeshott et al., (1981, 1982,
1983 a,b) collated allozyme frequencies from north American, Asian,
European and Australasian populations of D.melanogaster and analysed
their partial correlations and multiple regressions with latitude,
longitude and climatic factors. They found six allozyme loci showed
latitudinal clines in Australian populations, five of which also were
present on other continents (table 2.1).
In the collated analyses of allozyme frequencies, data from Asian
populations were very limited. Except for the data from several west
Asian localities (Israel and U.S.S.R.) data for the collated analyses
of Adh, Gpdh, Odh and Acph frequencies were only available for
populations at three Japanese locations. For the collated analyses of
Est-6, Pgm and G6pd data only one Japanese location was available.
Watada et al. (1986) investigated allozyme frequencies in
populations of D.melanogaster and D.simulans from 28 locations in the
Japanese islands. Data from populations of D.melanogaster in 18
locations showed that there was a higher Adh 5 frequency in populations
of the southern and central islands, although statistical analyses
Chapter 2 15
studied and their allele frequencies varied from population to population, but did not show latitudinal clines. Odh showed a low level of polymorphism, and Acph was found to be monomorphic.
Singh et al. (1982) studied the genetic variation in nine natural populations of D.melanogaster from different continents. In their study samples from two East Asian populations, Taiwan and Vietnam, were included. The allozyme frequencies of the two subtropical
(Taiwan) and tropical (Vietnam) populations were similar to those from the temperate populations of north America and Europe. For example, in comparison with other tropical populations, these two populations showed much higher AdhF frequencies(0.95 and 1.00). The data suggested that in general, the clinal patterns which are seen in North America, Europe and Africa seem not to be repeated in the East Asian populations.
In order to test the generality of the latitudinal differentiation found in north America, Europe and Australia, more data from Asia, especially from East Asia is necessary. The colonization of Asia by Drosophila melanogaster is supposed to have occurred at a similar time to Europe, much earlier than in North America and Australia (David and Capy, 1988). D. melanogaster only became established in Australia after European settlement. Similarly, the evidence from museum collections shows that Drosophila melanogaster became established in North America in the second half of the nineteenth century (David and ,apy, 1988). Such a difference in history could cause different patterns of geographic differentiation.
Chapter 2 16
P.R.C. were scored and collated with data from recent observation on Japanese populations (Watada et al. 1986; see table 2.2.2).
2.2 Materiais and Methods
2.2.1. Sample collection and maintenance
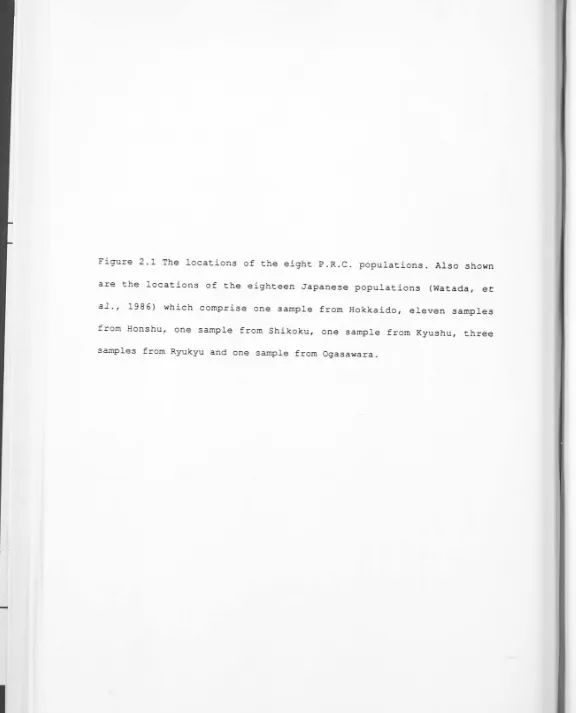
Adult Drosophila melanogaster were collected at eight sites in the eastern region of the People's Republic of China (P.R.C.) over a latitudinal range of 20°N (Fig. 2.1). The populations, which were all large, were sampled in the autumn of 1986 at fruit stores and wineries in eight cities and the samples were air freighted to Canberra where at least 100 single female lines were established from each population and maintained by mass transfer at 21±1° Con standard culture medium 10g agar, 50g glucose, 50g maize meal, 26g sucrose, 22.Sg wheat germ, and 6g yeast in 1 liter of water with 12.5 ml of acid mix (42% propionic acid, 4% orthophosphoric acid) (Gibson and Wilks, 1988). 220-430 genes were scored for each populations.
2.2.2. Electrophoresis conditions and stains:
Chapter 2 17
electrophoresis conditions and stain solutions for each allozyme system were as follows:
1.alcohol dehydrogenase (ADH; EC 1.1.1.1.) (follows Lewis and Gibson, 1978 )
Electrophoresis at 300V. for 30 min. Running buffer: 70rnM Tris, 5rnM boric acid, 7rnM EDTA PH8.8. Staining buffer: 50rnM orthophosphate buffer pH 7.8, 1% isopropanol, 0.5 mg/ml NAD, O.Olmg/ml phenazine methosulphate (PMS), 0.5mg/ml tetrazolium salt (MTT). Stain for 3-5 min.
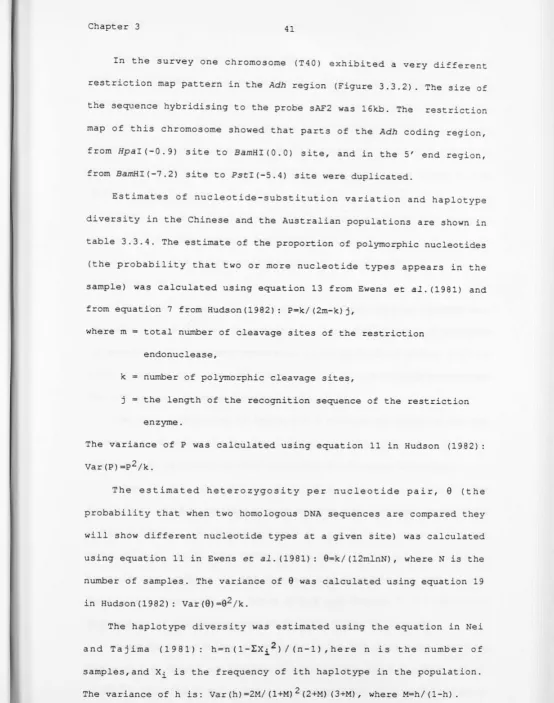
Thermostable ADH variants (AdhFChD) were detected by following the standard electrophoresis procedure and then sealing the membrane in transparent plastic wrapping film (Glad-wrap) and immersing it in a 43°c water bath for 15 seconds prior to activity staining. The electrophoretic pattern of AdhFChD after heat treatment and the control without heat treatment were as shown in Figure 2.2 (Wilks et
al., 1980).
2. a-glycerophosphate dehydrogenase (GPD; EC 1.1.1. 8.) (follows Gibson et al., 1986)
Electrophoresis at 450V. for 45 min. Running buffer: 126 rnM Tris, 42rnM citric acid, 9.26rnM EDTA pH 6.6. Staining buffer: lOOrnM Tris-HCl pH 8.6 containing 7mg/ml D,L a-glycerophosphate, 2mg/ml NAD, 0.5mg/ml MTT, 0.0lmg/rnl PMS, 2mg/ml EDTA. Stain for 3-5 min.
3. esterase-6 (EST-6; EC 3.1.1.1.) (follows P.H. Co~et ~ al., 1987) Electrophoresis at 250V, 4°c, for 110 min. Running buffer: 80rnM Tris-borate, l.3rnM EDTA pH 8.5. Staining buffer: O.lM phosphate pH 6.0, 10mg a,~-naphyl acetate (in acetone), 10mg Fast garnet GBC salt.
.
~
. dChapter 2 18
4. phosphoglucomutase (PGM; EC 2.7.5.1.) (follows Shaw and Prasad, 1970)
Electrophoresis at 350V. for 30 min. Running buffer 80mM tris-borate PH 8·.9, l.5mM EDTA. Staining buffer: 0.lM Tris-HCl pH 8.0, 0.5mg/ml MTT, O.Olmg/ml PMS, 50ng/ml EDTA, 0.05M Mgcl, 10mg Sodium glucose-1-phosphate, 20 units glucose-6-phosphate dehydrogenase, 10 mg NADP. Stain for 5 min.
5. octanol dehydrogenase (ODH; EC 1.1. 1. 73.) (follows Courtright et al., 1966)
Electrophoresis at 350V. for 45min. Running buffer: as EST-6. Staining buffer: 1ml octanol, 15mg Nitro blue tetrazolium (NBT), 15mg NAD+ in 10ml of l.OM Tris-HCl buffer, pH 8.5. After staining for one hour 4mg PMS was added.
6. acid phosphatase (ACP; EC 3.1.3.2.) (follows Ayala et al., 1972) Electrophoresis at 400V. for 45 min. Running buffer as EST-6. After electrophoresis the gel was dipped in 0.5M boric acid for 30min to adjust the pH, and then stained in O.lM Tris-Mallat buffer, pH 5.3, with lmg/ml a-naphthyl acidphosphate and lmg/ml Fast black K salt, for 1 hour.
7. glucose-6-phosphate dehydrogenase (G6PD; EC 1.1.1. 49.) (follows Bijlsma and Van Delden, 1977).
Electrophoresis at 350V. for 45 min. Running buffer: 0.15M Tris-citric acid, pH 7.5 with 5mM EDTA. Staining buffer: O.lM Tris-HCl, pH 7.5, 10 mM MgCl, 10mg NADP, 0.5mM MTT, 10mg Glucose-6-phosphatase, 2mg PMS. Stain for 5-10 min.
Chapter 2 19
Electrophoresis at 350V. for 45min. Running buffer and staining as G-6PD except the substrate was sodium 6-phosphogluconate instead of glucose-6-phosphate.
2.2.3. Climate data
Longitude,latitude and the 30 year averages of climate data from a weather station at each collecting site were obtained from Zhang and Lin (1985) and Sheng (1986), (see table 2.2.1). The altitudes of the collecting sites were all below 100 meters. The following four variables were calculated:
Maximum temperature (Tmax): average daily maximum in
°c
for the hottest calendar month at the station. Minimum temperature (Tmin): average daily minimum in°c
for thecoldest calendar month at the station. Maximum rainfall (Rmax) total rainfall in millimeters for the
wettest calendar month at the station, square root transformed for the analyses. Minimum rainfall (Rmin) total rainfall in millimeters for the
driest calendar month at the station, square root transformed for the analyses. The relationship between allele frequencies and latitude, longitude and the climatic variables were examined by partial correlation and multiple regression analyses using computing programs from the SPSS package (Nie et al., 1975).
Chapter 2 20
analyses of partial correlation and multiple regression with latitude and longitude.
2. 3. Results
-The alleles detected and their frequencies at the eight loci scored in the eight P.R.C. populations are given in table 2.3.1.
At four loci, Pgm, Odh, Acph and Pgd, very little geographic variation was observed, with the frequency of the most common allele always greater than 0.9. For Pgm the frequencies of the commonest allele Pgml.OO were around 0.95 in most populations; for the Odh gene odhF was fixed in seven populations; AcphF and Pg~ were fixed in five populations. None of the alleles at these loci showed any significant variation with latitude or longitude ..
Gpdh was polymorphic in each of the populations sampled with two or three alleles. The frequencies of GpdhF varied from 0.30 to 0.81, but was not significantly correlated with latitude or longitude, either in the P.R.C. samples or in the collated data set. One population, Xiamen, had a relatively high frequency of GpdhUF, which has only been found in previous surveys as a rare allele.
G6pd was polymorphic in six populations with the commonest allele, G6p~, significantly correlated with distance from the equator in the partial correlation (and also in the total data set) but not in the multiple regression coefficient (table 2.3.2.). The frequency of this allozyme showed a shallow latitudinal cline: with higher frequencies of G6pdF in north China.
Chapter 2 21
frequencies was also significantly correlated with latitude, both in the P.R.C. samples and in the collated data (Table 2.3.2.). Est-61.00 decreased in frequency with increasing distance from the equator, but this was opposite in direction to the differentiation previously reported in populations from North America (Johnson and Schaffer, 1973), or from Europe and Australasia (Oakeshott et al.,1981).
At the Adh locus the variation was consistent with previous studies in showing that Adh 5 frequency decreases with increasing latitude (Vigue and Johnson,1973; Wilks et al., 1980). However a surprising feature of the Adh data is the high frequency (up to 36%) of heat resistant AdhF alleles in most southern P.R.C. populations (a similar result has been obtained in other samples from this region by L. Chai, personal communication). The biochemical properties of these heat resistant alleles was investigated further and the results are described in chapter 6.
The allozyme frequency data showed that geographic differentiation occurs between Chinese populations of Drosophila melanogaster, in particular the latitudinal clines of Adh5 , Estl.OO and G6p~ indicate that the north-south differential pattern also occurs in China.
In the data from the eight P.R.C. populations, none of the allele frequencies at any locus were significantly correlated with any of the climatic variables after the latitudinal variation had been taken into account (table 2.3.3.)
2.4 Discussion
Chapter 2 22
loci. Previous surveys, mainly of populations in Australia, Europe and Northern America, have shown that five loci, Adh, Odh, G6pd, Est-6 and Pgd exhibit latitudinal variation, although the degree of association varies between continents. Previous work (Oakeshott et al., 1983 a, b) found the average frequency of PgdF in Europe/Asia to be 0.99, and this allele is nearly fixed in all the populations sampled from this area, except for one population, where the PgdF frequency was 0.8. Thus meaningful tests for clines within this area were precluded. Similarly, low levels of polymorphism occurred for Odh and Acph: the average frequencies of Odh 5 and Acph5 were: 0.046 and 0.017, 0.10 and 0.054, 0.026 and 0.013 in Australasia, Northern America and Europe/Asia respectively, nevertheless statistical analyses of a large collated data set indicated that they showed significant latitudinal clines in some continents (Oakeshott et al., 1983).
In the present study, the first to sample populations in mainland China, four loci, Pgd, Acph, Odh and Pgm showed quite low levels of polymorphism, which is similar to the data collected from Japan and to the results of previous surveys in other continents, especially in Europe/Asia (Oakeshott et al., 1983a.b.). For example, in the P.R.C. and Japanese data set the highest frequency of Odh 5 is 0.23, but in most populations i t is less than 0.05, the average frequency of OdhF is 0.95, and the average frequency of AcphF is 0.98. The highest frequency of Acphs is 0.08, and AcphF is fixed in two thirds of the populations from these areas. Tests of latitudinal variation for loci exhibiting little variation were not calculated.
Chapter 2 23
The inconsistent result for Est-6, compared with earlier surveys, is most surprising as this locus is polymorphic in most populations sampled. As the pattern of variation was in the opposite direction to that previously found in the Northern Hemisphere I paid particular attention to the electrophoresis conditions I had used. The conditions used in this study were chosen because they had been shown to maximise
h d . . . . 6
e
t e iscrimination of Est- phenotypes (Coo.7\et al., 1987). In
.
.
e
addition the same control alleles as used by Coo~et al. were used in my experiments. Thus any imprecise resolution of Est-6 phenotypes is
e
(P. Coo/\,personal unlikely to have occurred in my study
communication). There are a number of possible explanations for the result. The variation in Est-6l.OO in the P.R.C. populations might be due to linkage disequilibrium with the inversion In(JL)P, which has breakpoints on either side of the locus and which decreases in frequency with increasing latitude in North America (Voelker et
al.,1977) and in Australasia and Europe (Knibb, Oakeshott and Gibson,1982) . Cytological investigation of the P.R.C. and Japanese material will test this possibility. It may be that variation tracks some thing which does not vary latitudinally in P.R.C. The relatively low temperatures during the collecting time (November) may have exaggerated the Est-61.00 frequency in the southern China populations. Franklin (1981) monitored six populations over five years in the Hunter Valley, Australia and found that Est-6l. OO frequency consistently declined in the hot summer months and rose again in winter. In 1971 the frequency of Est-6l.OO in the population of the Hunter Valley dropped from 0.95 (in winter) to 0.67 (in summer).
It is also relevant to the inconsistency of the variation in
Est-6l. OO that the frequency of the allele does not change in the
Chapter 2 24
different latitudes (Oakeshott et al., 1988). It is also possible that samples scored by others contained some misclassification.
There are some data indicating a relationship between the properties of the EST-6 allozyme, temperature and fitness. Biochemical studies have indicated that the thermostability of the enzyme produced by Est-6l.OO is greater than that produced by Est-61 · 1 0 (Danford and Beardmore, 1979). Laboratory perturbation experiments and fitness component analyses carried out between 25° and 30°c indicated higher equilibrium Est-6l.OO frequency at these temperatures than between 18° and 20° C (MacIntyre and Wright, 1966). However these results from laboratory experiments are not in accord with the population distributions of Est-61 ·00 frequencies in natural populations in North America, Europe and Australasia. Est-6 P.R.C. data remain difficult to reconcile with those collected elsewhere, but they do show that the direction of the relationship with latitude is not consistent as had previously been thought to be the case. The data argue against the idea that the geographic pattern in Est-6 is caused by environmental varying factors which act directly on the Est-6 phenotype.
The data for G6pd are consistent with those from other continents in showing a relatively shallow latitudinal cline. The partial correlation coefficients of G6pdF frequencies on latitude were 0.44, 0.32 and 0.67 in Australasia, Northern America and Europe/Asia respectively. The mean G6pdF frequencies differ between continents e.g.: 0.59 (Australasia), 0.18 (North America) and 0.95 (Europe)
Chapter 2 25
showed that there were no consistent climatic relationships in data from other continents (Oakeshott et al., 1983a).
The latitudinal differentiation in Adh3 in the P.R.C. populations is consistent in form with that previously found in Australasia (Wilks et al., 1980; Anderson, 1981; Oakeshott et al., 1982). In samples collected in 1986 the pattern was unchanged from the first studies carried out in 1978, (J.B. Gibson and C. Jiang, unpublished data and see Anderson et al.,1987). In general AdhS frequencies are lower in the P.R.C. population than in populations at comparable latitudes in Australia but otherwise the latitudinal differentiation is similar. In earlier surveys (Oakeshott et al., 1982) the frequency of Adhs was related to Tmax in populations in North America, and to Rrnax in North America and Australasia. But later surveys failed to find this association (Anderson et al.,1987). In the P.C.R. data the frequency of Adhs was not correlated with any of the four climatic variables.
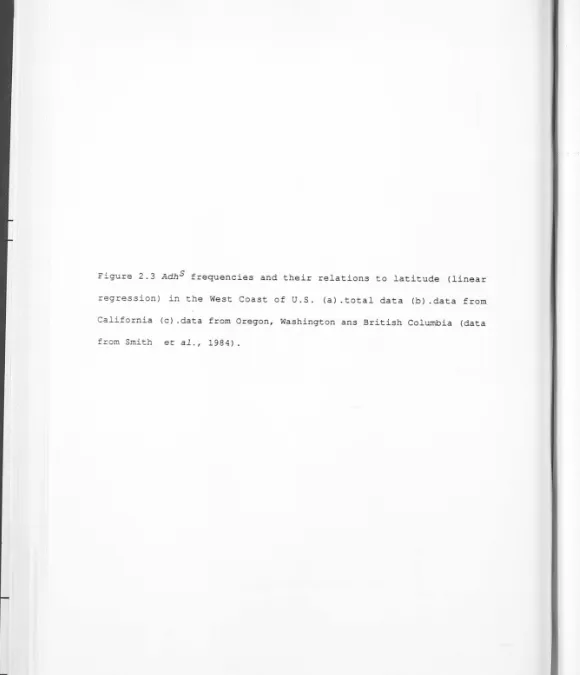
Recent population samples from Eastern and Western regions of North America have shown that the latitudinal cline in Adhs is now less marked in the eastern region (Gail Simmons, personal communication) and in the west region the relationship between AdhF frequency and latitude, although positive, is weak and non-significant
(p=O. 46) (Smith et al.,1984). They found the distribution of Adh alleles on the west coast of the United States is complex, with clines
·
·
· ().I
1 · > b tin California (P=0.01, significant in statisti;1ana ysis u non-significant in association with latitude (p=0.12) in Oregon, Washington and British Columbia. The Adhs frequency and relationship to latitude (linear regression) in the west coast of the United States
3
Chapter 2 26
study. In the western part of the U.S.A. i t may also be due to altitudinal variation modifying the climate. Singh et al., (1987) explained that their failure to recognize some allozyme ~atitudinal variation ~hat does in fact exist was partly due to the small number of localities they sampled.
Temperature has been suggested as a selective factor acting on Adh cline. Biochemical studies (Chambers et al.,1984) indicated that thermostabilities of AdhF and Adh 5 were nearly the same in vitro. In vivo studies by van Delden and Kamping (1980), Vigue and Sofer (1976) and Gionfriddo et al., (1979), found no relationship between heat stability of Adh products and adult mortality when temperature of 3s0c
i
and 17°c to 29°c were used. VJgue et al., (1982) studied the effect of a combination of ethanol and temperature on the competitive success of AdhF and Adh5 in D.melanogaster larvae and on the ADH activity of adults and larvae subjected to various temperatures (17, 25 and 30°c). They found that after 10 generations, the frequency of AdhF increased at each temperature, but controls with no ethanol showed no change in the frequencies of AdhF. Gionfriddo and vigue (1978), Gionfriddo et al., (1979) and Franklin (1981) also found no correlation between seasonal variation in temperature and seasonal variation in the frequency of AdhF. Temperature seems unlikely to be the selective factor maintaining the latitudinal cline in Adh5 frequency.
Chapter 2 27
that populations in regions of Australasia and North America with
climates similar to that of Southern China do not have frequencies of
FChD , F
Adh above 0.03. A heat resistant Adh allele has also been found
at low frequency (less than 0.01) in the Canary Islands (Hernandez et
al., 1986) but not in central African populations (J. David, personal
communication) It is relevant that AdhF is relatively rare in
tropical Africa (David, 1982) where, on the basis of biogeographical
and phylogenetic evidence, i t is believed D. melanogaster originated (Lemeunier et al., 1986; David and Capy 1988).
The evolutionary history of D.melanogaster and the worldwide distribution of AdhFChD, which probably arose from a mutation in
Adh-F, (Gibson, Wilks and chambers, 1981) prompts the speculation that the
AdhFChD mutation-occurred in southern China and spread, possibly in
association with human migration, to North America and Australasia in
the nineteenth century. Although many introductions of D.melanogaster
from different countries are likely to have occurred in both North
America and Australia, Guangzhou (Canton) was a major trading port and
there is historical evidence (Huck, 1968) that Chinese migrants to N.
America and Australia in the mid-nineteenth century came mainly from
the southern provinces of Guangdong of which Guangzhou is the capital,
and Fujian, of which Xiamen and Fuzhou are the two largest cities. The
ships that transported the migrants carried fruit, vegetables and
fermented liquor from the port of embarkation and i t is possible that
samples of D. melanogaster accidently transported from Guangzhou were likely to have contained Adhs, AdhF and AdhFChD alleles at similar
frequencies and could have given rise to the widespread distribution of AdhFChD.
If Northern America and Australia were only recently colonised by
Chapter 2 28
lesser extent that in G6pdF) on these continents has developed over
the past century in contrast to mainland China where D. melanogaster
is likely to have been endemic for much longer. Singh and Rhornberg
(1987) have discussed two selective and two non-selective mechanisms
which could give rise to latitudinal variation. For example allele
frequencies might be tracking latitudinally varying environmental
factors or there may be gene flow between two distinct latitudinally
separate selective regimes. The non-selective causes include the
intermixing of differentiated populations and gradients in allele
frequencies deriving from change in seasonal cycles along a
latitudinal gradient. Notwithstanding the speculation about human
mediated dispersion of AdhFChD, the consistent Adh5 latitudinal cline,
at least in eastern Australia and eastern China, coupled with evidence
that transplanted populations change in Adh frequency towards the
recipient area (Oakeshott et al., 1988), is strongly suggestive of
some kind of balancing selection focussed on phenotypes to which
variation in the Adh region of the genome makes a significant
Table 2.1 Partial correlation coefficients for allozyme allele frequencies with latitude in Drosophila melanogaster populations, data were taken from Oakeshott et al. (1981, 1982, 1983a,b).
*p<0.05, **p<o.ol, ***p<0.001
Continent AdhS GpdhF Est-61.00 G6pcr Pgcr Odhs Acphs
*** * ** *** ** *
Australia -.75 -.23 .28 .44 .63 -.59 -.49
*** *** * * *** **
N. American -.48 -.57 .31 .32 .84 -.54 .04
***
Asia -.58
** * **
Table 2.2.2 Averages of allozyme frequencies in populations of D. melanogaster sampled from Japanese islands. Allele Adh3 GpdhF Est-6s OdhF
Acph F
G6pif
Data taken from Wadata et al, 1986. n = number of genes sampled.
n 8776 8756 8382 8680 7060 7842 HOKAIDO
43° N
0.20 0.84 0.88 0.98 0.92 0.76 HONSHU
36° N
0.27
0.74
0.85
0.95
1. 00
0.86 SHIKOKU 33°42'N 0.13 0.73 0.92 0.98 0.99 0.93 KYSHU 32°N 0.50 0. 72 0.95 0.98
1. 00
0.96 RYNKYN 27°N 0.79 0.89 0.60 0.76
1. 00
0.69
OGASAWARA
27° 30'N
0.61
0.78
0.60
1. 00
1. 00
,
"Iii
Table 2.3.1. Allele frequencies in the eight P.R.C. populations. The number of genes scored for each locus is shown in parenthesis at each site and the latitude of the site is indicated.
Hl\IKOU GUANGZHOU XIAMEN FUZHOU SHANGHAI XUZHOU JINAN LUDA
20° 02'N 23° 08'N 24° 27'N 26° 05'N 31° lO'N 34° 17'N 37° N 38° 54'N
Allele (220) (440) (330) (380) (380) (430) (390) (390)
Adhs 0.43 0.25 0.21 0.23 0.20 0.20 0.17 0.10
AdhF 0.43 0.39 0.64 0.66 0.80 0.80 0.76 0.86
AdhF.Ch.D 0 .14 0.36 0.15 0.10
-
-
0.06 0.04GpdhUF
-
-
0.13-
-
-
-
-GpdhF 0.81 0.66 0.39 0.30 0.44 0.54 0.46 0.51
Gpdhs 0.19 0.34 0.48 0.70 0.56 0.46 0.54 0.49
Est-6l.OO 0.96 0.96 0.98 0. 72 0.76 0.61 0.28 0.34
Est-61 · 1 O 0.04 0.04 0.02 0.28 0.24 0.39 0. 72 0.66
G6pif 0.86 0.94 0.92 0.80 0.98 1. 00 0.97 1. 00
G6pds 0.14 0.06 0.08 0.20 0.02
-
0.03-Pgml.20 0.05 0.05 0.10 0.06
-
0.08-
0.06Pgml.00 0.95 0.93 0.90 0.94 0.93 0.92 0.98 0.94
PgmO. 70
-
0.02-
-
0.07-
0.02-OdhF 1. 00 1. 00 1·. 00 0.99 1. 00 1. 00 1. 00 1. 00
Odhs
-
-
-
0.01-
-
-
-F 1. 00 1. 00 1. 00 0.92 1. 00 1. 00 0.94 0.97
Acph
Acph8
-
-
-
0.08-
-
0.06 0.03Pgif 1. 00 0.97 1. 00 0.97 0.95 1. 00 1. 00 1.00
Pgds
-
0.03-
0.03 0.05-
-
-- -- -- -- -- --- --·--- =
.
-Table 2.3.2
Partial correlation (£) and multiple regression coefficients (Q)
of angularly transformed allele frequencies on latitude and
longitude in (a) the P.R.C samples and (b) including data for
Japanese populations
lat long lat long
(a) -0. 72* -0.50 -0. 62
*
-0.34(b) -0.64* +0.53* -0.70* 0.54*
Esc-61 - 00 (a) -0.94** 0.52 -1.06* 0.23
(b) -0.49* 0.3 -0.55 0.31
G6pd! (a) 0.65* -0.06 0.73 0.48
(b) 0.19 -0.23 0.22 -0 .26
*p<0.05, **p<0.01.
P
<?,.rr.'a.(J Correle..f,rrr,S(!: )
(!)f
a/le
le-
-fr ef<-<e
r1Ct'e.-s ?uitt,1.a.f.
·fz.
o/e (
!010,h,d&) t-Jer~C'c;.ktt&-tecl
~,J,,-/e
-rl/i:- e·ft~-c.t
[image:48.614.55.603.19.745.2]Table 2.3.3 Partial correlation (r) and multiple regression coefficients (b) of angularly transformed allele frequencies on latitude (lat.),longitude (long.),maximun and minimun temperature (Tmax,Tmin)and rainfall(Rmax,Rmin) in
the P.R.C. populations.
Adh5
GpdhF
Est-61 · OO
G6pif
lat. long.
-. 72
.085
-.94
.65
*
P<0.05,*
*
**
-.50 -.64 .52 -.056**
P<0.01 Tmax .081 -.38 -.21 -.017 rTmin Rmax Rmin
.41 .17 .11
.52 -.029 -.37
.76 -.29 .47
-. 20 -.20 -.10
¥:
/~rf,r..f
eorreld,trns
( r )6f
cX,(/e/,
fl
b
lat. long. Tmax Tmin Rmax Rmin
*
*
*
*
-. 82 -.70 .64 .81 . 72 .39
*
-.46 -. 73 .10 .45 .52 -.057
**
*
**
*
-.93 -.37 .69 .91 .48 .81
*
• 71 .37 -.61 -.73 -.62 -.45
uf!..,i(!.,'eS CJ,'
M
07?e. Vtzr, t:>.t..f-e_ tuere.- 0z-lcvr /,,_r,;_pf4->h,
1~
-f11e(l'.ecrs
Figure 2.1 The locations of the eight P.R.C. populations. Also shown
are the locations of the eighteen Japanese populations (Watada, et
al., 1986) which comprise one sample from Hokkaido, eleven samples
from Honshu, one sample from Shikoku, one sample from Kyushu, three
[image:50.615.4.580.20.733.2]0. 0
,.
:z.
I
",
I I
,.,
/
J
\ \C\ C
'
0 ::,
'°
\
'-\./')
~
X C
~
-r
"
N
::,
-:::,
0
0
::,
C
e
•
N ~
er a.
a
j
~~
'
<?
;:o
Q.
...
. "\._
'<
"'-C ;,.- '< C .;;
GI
Before heal treatment
Afte.- incubation at .it3°C for 15 . seconds
AdhF I AdhFChD AdhFChD Adhf AdhfChD AdhF
..
__
..
QB
(
.
~~::_~~:·,
C0
Adh5 Adh5 Adh5 AdhF
- -
-Adh5 Adhf AdhfChD
-Adhf
. .
G : ) C )
· ... : ... _
..
-·
.
,..,:Jl.t·.
~ ~
~ ... ?l~i£:S;! ~
~ ~
···
·
t
~1t1J?
.
···
...
.
.
.
:
.
..
...
··
...···
·
.····
....
>
I
~
~AdhFChD AdhFChD Adh5
Adh5
I
Adh5-AdhfChD Adhf Adh5 AdhF AdhfChD
...<@;)
~==~=>
---
-:~::
~
C )
:::~:~~~~--:
:
-
~
-..... :· ~
c::::>
.
.
.
....
.
.
(±)
Figure 2.3 Adh5 frequencies and their relations to latitude (linear
regression) in the West Coast of U.S. (a) .total data (b) .data from