Int. J. Electrochem. Sci., 7 (2012) 9375 - 9389
International Journal of
ELECTROCHEMICAL
SCIENCE
www.electrochemsci.org
Electron Transfer and Electrocatalysis of Layer-by-Layer
(DNA/Cyt
c
-HRP)n Multilayer
Yonghai Song1,2, Yu Wang1,2, Li Wang1,2,* and Hongyu Liu1,2 1
Key Laboratory of Functional Small organic molecule, Ministry of Education, Jiangxi Normal University, Nanchang 330022, People’s Republic of China
2
College of Chemistry and Chemical Engineering, Jiangxi Normal University, Nanchang 330022, People’s Republic of China
*E-mail: [email protected]
Received: 3 August 2012 / Accepted: 6 September 2012 / Published: 1 October 2012
A multilayer bio-interphase composed of DNA, cytochrome c (Cyt c) and horseradish peroxidase (HRP) was developed by layer-by-layer assembling DNA and Cyt c-HRP on a gold electrode surface modified by a precursor film. The Cyt c was electrostatically immobilized on a mixed film consisting of biocompatible 11-mecraptoundecanoic acid and 6-mercapto-1-hexanol as the precursor film. This new multi-protein bio-interphase was used as a model system to investigate electron transfer and electrocatalytic performance of these two proteins in the multilayer. The assembly process was monitored by UV-vis spectroscopy and electrochemical technique. The (DNA/Cyt c-HRP)n multilayer modified electrode showed a pair of well-defined and nearly reversible peak of the protein Fe(III)/Fe(II) redox couples. The current response linearly increased with the amount of electroactive proteins up to 4 bilayers, showing the electrons were transferred over long distance within the multilayers. The (DNA/Cyt c-HRP)n also exhibited good electrocatalytic response to reduction of hydrogen peroxide (H2O2) and oxygen (O2), indicating a multi-step electron transfer chain from the electrode via the Cyt c-HRP composite to H2O2 and O2. This study will shed more light on the electron transfer within multi-protein arrangements and the development of biosensors.
Keywords:Multilayer; Bio-interphase; Cytochrome c; Horseradish peroxidase; Electron transfer
1. INTRODUCTION
to mimic the sequential electron transfer in real biological systems [2-8]. It was found that a multi-step electron transfer chain can be formed from the electrode via the Cyt c layers towards enzymes and finally to analyses [9]. And accordingly a series of biosensors with good-selectivity and high-sensitivity were developed [10-12]. To obtain higher high-sensitivity, there is still a need to increase the functional density which could be achieved by going beyond the monolayer arrangement [13-16]. Therefore it is necessary to construct multi-protein multilayer in which the proteins might effectively exchange electrons with the electrode without the need of mediator and understand the mechanism of electron transfer in the multilayer.
Layer-by-layer (LBL) self-assembly has been developed into a general approach for fabricating multilayer on solid surfaces. This molecular architecture method is mainly based on the alternate adsorption of oppositely charged species from their solutions with precise thickness control on the nanometer scale [17]. Electroactive multilayer assemblies combining the redox protein Cyt c and the enzyme laccase were fabricated by the LBL adsorption technique on gold electrodes and were shown to be capable of direct oxygen reduction [18]. Multilayer with embedded Cyt c, bilirubin oxidase (BOD) and poly(amiline sulfonic acid) (PASA) as counter polyelectrolyte were assembled on a Cyt c monolayers electrode by alternating incubation in solutions of PASA and Cyt c/BOD mixture [9]. Electron transfer between Cyt c and BOD with the PASA multilayer was achieved to study the communication in a protein stack. A polyelectrolyte multilayer combining Cyt c and xanthine oxidase was fabricated to develop sensor for selective response to hypoxanthine [5]. An efficient electrocatalytic biosensor for sulfite detection was developed by co-immobilizing sulfite oxidase and Cyt c with poly(aniline sulonic acid) in a LBL multilayer [19]. The results obtained by these multi-protein multilayer bio-interphases might be different from those in living organisms because these abiological materials in these bio-interphases disrupted the electron transfer. Multi-protein LBL self-assembly by combining Cyt c with SOx was developed by alternating incubation of a Cyt c monolayer electrode in a SOx/Cyt c mixture and a pure Cyt c solution without the use of any additional polymer [20]. In the LBL arrangement by protein-protein interaction, mediator-free electron transfer of the enzyme within the composite was achieved by taking advantage of direct interaction between the two functional biomolecules. Although electrostatic interactions between these two proteins with rather separated isoelectric points during the assembly process from a low ionic strength buffer were found to be sufficient for layer-by-layer deposition of components, the reproducibility and stability of protein bio-interphase were a serious problem needed to be solved in future. Recently, a novel multi-protein bio-interphase consisting of DNA, Cyt c and HRP was developed by assembling Cyt c, DNA and Cyt c-HRP on biocompatible 11-mercaptoundecanoic acid (MUA) - 6-mercapto-1- hexanol (MCH) modified gold (Au) electrode [21]. The bio-interphase constructed with biological molecules always showed a good reproducibility and stability [5-8], which activated us to construct a novel multi-protein multilayer bio-interphase by using DNA as a scaffold.
electrode communication [22]. Then negatively charged DNA molecules were assembled on the Cyt c/MUA-MCH/Au electrode based on electrostatic interaction to form a three-dimensional (3D) network as scaffold [23]. Finally, the (HRP-Cyt c/DNA)n/Cyt c/MUA-MCH/Au were obtained by alternating incubation of DNA and Cyt c/HRP mixture as a model system to study the mechanism of multienzyme-catalyzed reactions.
2. EXPERIMENTAL
2.1. Reagents and materials
Cytochrome c (Cyt c, 98%), horseradish peroxidase (HRP), 11-mecraptoundecanoic acid (MUA, 95%) and 6-mercapto-1-hexanol (MCH, 97%) were purchased from Sigma-Aldrich and used as received. λ-DNA was purchased from Shanghai Biotechnology Company (Shanghai, China). Other reagents were purchased from Beijing Chemical Reagent Factory (Beijing, China) and were of analytical reagent grade. Phosphate buffer solution (PBS, 0.2 M, pH 7.0) were used as supporting electrolyte and was prepared by mixing solution of 0.2 M Na2HPO4 and 0.2 M NaH2PO4. All solutions were prepared with ultra-pure water purified by a Millipore-Q System (18.2 M cm). A Cyt c solution and HRP solution were made in 0.2 M PBS (pH 7.0) and contained 400 μM Cyt c and 110 μM HRP, respectively. The concentration of λ-DNA solution was 100 μg mL-1
.
2.2 Preparation of modified electrode
(d)Cytc+HRP Au(a)MUA+MCHAu (b)Cytc Au (c)DNA Au
Au Reapeat (c)+(d)Au H2O2
H2O
+
(d)Cytc+HRP Au(a)MUA+MCHAu (b)Cytc Au (c)DNA Au
Au Reapeat (c)+(d)Au H2O2
H2O
+ Au
Au(a)MUA+MCHAuAu (b)Cytc AuAu (c)DNA AuAu
Au Au
Au Reapeat (c)+(d)AuAuAu H2O2
H2O
+
Scheme 1.Schematic representation of the construction procedure for the Cyt c-HRP/GO-CHIT/Cyt c/MUA-MCH/Au electrode and the direct electron transfer between immobilized bi-protein and the underlying Au electrode.
MUA-MCH/Au surface, each with intermediate drying at 4 ºC for 4 h and ultra-pure water rinsing. To obtain the required (DNA/Cyt c-HRP)n multilayer, the assembly of λ-DNA and mixture of Cyt c and HRP were repeated. In the assembly, the drying and rinsing step are both usually necessary and makes the films more stable or removes off those weakly bound molecules, respectively. Finally the resulted electrode was stored at 4 ºC for further use. The procedure for the modified electrode construction was shown in Scheme 1.
2.3 Preparation of samples for UV-vis spectroscopy
A quartz substrate was cleaned by firstly immersed in a mixed solution of H2SO4 (98%, w/v) and H2O2 (30%, w/v) with a volume ratio of 7/3 for 30 min. Then, it was flushed with ultra-pure water and dried in air at room temperature. The following procedure to fabricate (DNA/Cyt c-HRP)n multilayer on the quartz substrate are similar to that of the Au electrodes and then kept at 4 ºC for the experiments.
2.4 Apparatus
All electrochemical experiments were performed with a CHI 750D electrochemical workstation (Shanghai Chenhua Instruments Co., China). A three-electrode configuration was used with the modified Au electrode as the working electrode, a platinum wire as the auxiliary electrode, and a saturated calomel electrode (SCE) as the reference electrode. Cyclic voltammetric experiments were carried out in 10.0 mL 0.2 M PBS (pH 7.0). Electrolyte solutions were purged with high purity nitrogen prior to experiments and blanketed with nitrogen during electrochemical experiments. Atomic force microscopy (AFM) measurements were carried out with an AJ-III (Shanghai Aijian Nanotechnology, China) in tapping mode. Standard silicon cantilevers (spring constant 0.6–6 N m−1) were used at their resonance frequency (typically, 60–150 kHz). All AFM images were acquired at room temperature under the ambient conditions, and images were raw data except for flattening. UV– vis spectra were obtained by using a Lameda35 UV–vis spectrometer. All experiments were performed at an ambient temperature of 202 C.
3. RESULTS AND DISCUSSION
3.1. AFM characterization of the bio-interphase modified electrodes
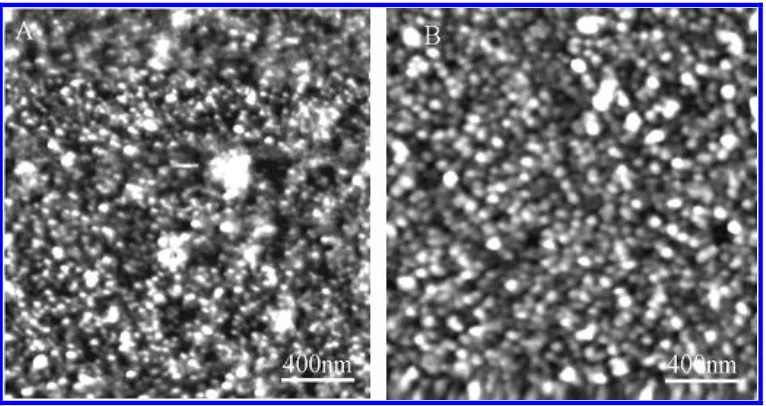
[image:5.596.108.491.131.334.2]
the number of bilayer increasing, the surface became rougher, as shown in Figure 1B. It may be result from a large number of the pores in the multilayer.
Figure 1. AFM images of (HRP-Cyt c/DNA)/Cyt c/MUA-MCH/Au (A) and (HRP-Cyt c/DNA)4/Cyt c/MUA-MCH/Au electrode (B).
3.2. Layer-by-layer assembly of (DNA/Cyt c-HRP)n multilayer
Figure 2. (A) UV-vis spectra of (DNA/Cyt c-HRP)n multilayer on quartz slide with different number of bilayer (n). (B) Plot of the absorbance at 408 nm versus number of bilayer.
UV-vis spectroscopy has proved to be a useful and facile technique to evaluate the growth process of multilayer[24] and was used in the present work to monitor the LBL growth of (DNA/Cyt c-HRP)n multilayer on quartz slide. As shown in Figure 2A, an obvious soret absorption band at about 408 nm appeared, which was characteristic of the adsorption caused by iron heme groups of Cyt c and
1 2 3 4 5
0.15 0.20 0.25
0.30
B
R=0.9950
A
b
s
o
rb
a
n
c
e
Number of bilayers
250 300 350 400 450 500
0.0 0.1 0.2 0.3 0.4
A
five bilayerone bilayer
A
b
s
o
rb
a
n
c
e
Wavelength / nm
[image:5.596.64.514.448.622.2]
HRP as described previously [25]. This absorption could be utilized to monitor the amount of Cyt c-HRP in the multilayer. The clear increase in the absorbance with the assembly step was indicative of the (DNA/Cyt c-HRP)n deposition on the substrate. The plot of the absorbance at 408 nm versus the number of (DNA/Cyt c-HRP)n multilayer showed a nearly linear increase in the amount of electroactive proteins up to 5 bilayers (Figure 2B), suggesting that the amount of Cyt c-HRP loaded in each bilayer was almost the same. The (DNA/Cyt c-HRP)n multilayer are built up in a regular and uniform way.
Figure 3. (A) Impendence plots of bare Au (a), MUA-MCH/Au (b), Cyt c/MUA-MCH/Au (c), DNA/Cyt c/MUA-MCH/Au (d), (HRP-Cyt c/DNA)n/Cyt c/MUA-MCH/Au (e-i: n=1-5) in the presence of 5 mM Fe(CN)6
3−/4−
with 0.1 M KCl as the supporting electrolyte. Inset is the Randles circuit. (B) Plot of the Rct versus number of bilayer.
Electrochemical impedance spectroscopy (EIS) was also employed to monitor the growth of (DNA/Cyt c-HRP)n multilayer. Figure 3A shows the results of EIS on various electrodes in the presence of the redox probe of 5 mM Fe(CN)6 3−/4− with 0.1 M KCl as the supporting electrolyte at the formal potential (0.15 V vs SCE). To give more detailed information about the electrical properties of these modified electrodes, the Randles circuit (inset of Figure 3A) was chosen to fit the impedance data [26]. In the Randles circuit, the resistance to charge transfer (Rct) and the diffusion impedance (W)
were both assumed in parallel to the interfacial capacity (Cdl). This parallel structure of Rct and Cdl
gave rise to a semicircle in the complex plane plot of Zim against Zre. The bare gold electrode exhibited
an almost straight line (curve a), which was characteristic of a diffusion-limited electrochemical process. After the assembly of MUA-MCH SAMs film on the electrode surface, an obvious semicircle part of the impedance spectrum (curve b) can be observed. The Rct was increased from 0.12 K cm2 to
4.56 K cm2
. The large Rct resulted not only from the hindrance of the nonconductive layer of
MUA-MCH toward Fe(CN)6 3−/4−, but also from the repulsive interaction between negatively charged MUA-MCH and Fe(CN)63−/4−. The assembly of Cyt c resulted in the slight increase of the semicircle part of the impedance spectrum (curve c) due to the hindrance of the macromolecular structure of Cyt c toward Fe(CN)63−/4−. The Rct was increased to 5.21 K cm2. After a similar Cyt c/MUA-MCH/Au was
immersed in the 100 ng μL−1 solution of DNA for 4 h in a separate experiment, the semicircle part of
1 2 3 4 5
8 10 12 14
B
R=0.9994
R
ct/ K
Number of bilayer
0 5 10 15
0 2 4 6
A
Rs Rct
W Cdl
-Z
''
/
k
Z' / k
[image:6.596.69.518.208.381.2]
the impedance spectrum obviously increased (curve d). The large Rct (7.43 K cm2) might mainly be
ascribed to the repulsive interaction between the negatively charged DNA/Cyt c/MUA-MCH/Au and Fe(CN)6 3−/4−, since DNA molecules were assembled on Cyt c/MUA-MCH/Au by electrostatic interaction and formed DNA network which would hindered the Fe(CN)6 3−/4−. With the increase of the bilayer number, the semicircle part of the impedance spectrum increased gradually (curves e–i). As shown in Figure 3B, the Rct values showed a nearly linear increase with the number of (DNA/Cyt
c-HRP)n multilayer, suggesting a uniform growth of the multilayer in the assembling process.
3.3Electrochemical behaviors of the (DNA/Cyt c-HRP)n multilayer modified electrodes
Cyclic voltammograms (CVs) was used to explore the electron transfer in the (DNA/Cyt c-HRP)n multilayer. Figure 4A showed CVs of (HRP-Cyt c/DNA)n/Cyt c/MUA-MCH/Au (curve a-e: n=1-5) in N2-saturated 0.2 M PBS (pH 7.0). The (DNA/Cyt c-HRP)n/Cyt c/MUA-MCH/Au electrode showed a pair of well-defined and nearly reversible reduction-oxidation peaks. The anodic peak potential was located at about 0.054 V and the cathodic peak potential was located at about -0.009 V. The pair of peaks were characteristic of Fe(III)/Fe(II) redox couples from iron heme groups of Cyt c and HRP [27,28]. The peak currents showed a linear increase with the number of (DNA/Cyt c-HRP)n up to 4, then leveled off, indicating electrons could transfer efficiently over long distance within the multilayer on the electrode. According to previous results for a polyelectrolyte multilayer arrangement of Cyt c and sulfonated polyaniline[29] and LBL arrangement of Cyt c and sulfite oxidase [20], long-distance electron transfer process might be ascribed to one of the following mechanisms: (1) electron transfer took place by percolation or the physical displacement of associated ions along a negatively charged phosphate backbone and electron migration within the DNA duplex, while the DNA stacked base pairs could be considered as a system of connected π electrons to transfer electrons [30]; (2) electron transfer occurred by direct interaction between neighboring Cyt c or HRP molecules, while DNA is responsible for stabilization of the arrangement [20]; (3) Cyt c and HRP could be wired by DNA, which would be a conductive polymer under specific conditions [29]; (4) electron transfer occurred by a face-to-face electron hopping between Cyt c and HPR or Cyt c [20].
Figure 4B shows the CVs of differently modified electrodes with multilayer of single protein (Cyt c or HRP) and bi-proteins (Cyt c-HRP) in 10.0 mL 0.2 M PBS (pH 7.0) at a scan rate of 0.1 V s−1. Obvious peak current appeared at the (HRP/DNA)4/Cyt c/MUA-MCH/Au (nHRP=1.6 nmol) electrode
(curve a) and (Cyt c/DNA)4/Cyt c/MUA-MCH/Au (nCyt c =1.6 nmol) (curve b), but they were
significantly lower than that of the (HRP-Cyt c/DNA)4/Cyt c/MUA-MCH/Au (nCyt c/nHRP=7:1; nCyt c+nHRP=1.6 nmol) electrode (curve c). Since the amount of electroactive proteins was the same at the
three electrodes, the larger peak current at (HRP-Cyt c/DNA)4/Cyt c/MUA-MCH/Au electrode (curve c) suggested a synergistic interaction between Cyt c and HRP in the multilayer. The (HRP-Cyt c/DNA)4/Cyt c/MUA-MCH/Au electrode also showed a narrow peak to peak separation (ΔEp=Epa−Epc,
64 mV) as compared with the (HRP/DNA)4/Cyt c/MUA-MCH/Au electrode (ΔEp=70 mV) and the
(Cyt c/DNA)4/Cyt c/MUA-MCH/Au electrode (ΔEp=68 mV). These results indicated that the
the electron communication between multi-proteins and the electrode. The electron transfer might occur by direct interaction between neighboring Cyt c and HRP (or Cyt c) molecules or by a face-to-face electron hopping between Cyt c and HPR (or Cyt c) [20].
Figure 4. (A) CVs of (HRP-Cyt c/DNA)n/Cyt c/MUA-MCH/Au (a-e: n=1-5) in N2-saturated 0.2 M PBS (pH 7.0). The inset is the plots of oxidation peak current versus the number of bilayer. (B) CVs of (HRP/DNA)4/Cyt c/MUA-MCH/Au (nHRP=1.6 nmol) (a), (Cyt c/DNA)4/Cyt
c/MUA-MCH/Au (nCytc =1.6 nmol) (b) and (HRP-Cyt c/DNA)4/Cyt c/MUA-MCH/Au (nCyt c/nHRP=7:1;
nCytc+nHRP=1.6 nmol) (c) in N2-saturated 0.2 M PBS (pH 7.0). The scan rate: 0.1 V s-1.
The above results suggested that the ratio of nCyt c/nHRP should have a profound effect on the
electron transfer. Figure 5A shows the effect of the ratio of Cyt c and HRP on electron transfer between mixed proteins and underlying electrode. A remarkable change of peak current was observed as the ratio of nCyt c/nHRP varied from 1:1 to 10:1. The peak current of the (HRP-Cyt c/DNA)4/Cyt
c/MUA-MCH/Au electrode increased gradually with the increase of nCyt c/nHRP ratio and reached the
maximum value at 7:1. To further increase the ratio of nCyt c/nHRP, the peak current turned to be
decreased on the contrary. Previous result proved that the direct interaction between Cyt c and HRP could result in the change of the symmetry properties of the porphyrin ring by changing the conformation of the protein [21]. The change of the symmetry properties of the porphyrin ring would further result in the change of the coordination in axial direction of the heme and accordingly enhanced electron transfer. If the electron transfer occurred by a face-to-face electron hopping between Cyt c and HRP or Cyt c molecules, the ratio of nCyt c/nHRP has no effect on the electron transfer. Therefore, this
experiment not only confirmed the CVs data for a synergistic interaction between Cyt c and HRP but also indicated the direct interaction between Cyt c and HRP molecules as a dominating electron transfer mechanism. The total amount of Cyt c-HRP might also play an important role in electron transfer between mixed proteins and underlying electrode. As shown in Figure 5B, the oxidation peak current of the (HRP-Cyt c/DNA)4/Cyt c/MUA-MCH/Au electrode increased gradually with the increase of the total amount of (nCyt c+nHRP) and reached the maximum value at 1.6 nmol due to the
increase of the amount of electroactive Cyt c-HRP. As the total amount of (nCyt c+nHRP) further
-0.2 -0.1 0.0 0.1 0.2
-1.5 -1.0 -0.5 0.0 0.5 1.0
1.5
B
c
b
a
i /
A
E / V (vs. SCE)
-0.2 -0.1 0.0 0.1 0.2
-1.5 -1.0 -0.5 0.0 0.5 1.0 1.5
1 2 3 4 5
0.2 0.4 0.6 0.8 1.0 1.2 1.4 1.6
ipea
k
/
A
Number of bilayer
e
a
i /
A
[image:8.596.63.517.159.334.2][image:9.596.64.539.207.392.2]
increased, the oxidation peak current turned to be decreased gradually. The decrease might be ascribed to the thick and dense Cyt c-HRP layer in the multilayer, especially the protein part of Cyt c-HRP, which hindered the electron transfer in reverse. The compacted structure of the (HRP-Cyt c/DNA)4/Cyt c/MUA-MCH/Au electrode with large number of Cyt c-HRP might also hinder electron transfer. This experiment not only denied a face-to-face electron hopping between Cyt c and HPR or Cyt c but also confirmed the three-dimensional porous structure played a crucial role in the long-distance electron transfer.
Figure 5. (A) The plot of oxidation peak current versus different molar ratio of nCyt c/nHRP to the
(HRP-Cyt c/DNA)4/Cyt c/MUA-MCH/Au (nCyt c+nHRP=1.6 nmol) modified electrode in N2-saturated
0.2 M PBS (pH 7.0). (B) The plot of oxidation peak current versus different total molar (nCyt c+nHRP) to the (HRP-Cyt c/DNA)4/Cyt c/MUA-MCH/Au (nCyt c/nHRP=7:1) modified electrode
in N2-saturated 0.2 M PBS (pH 7.0).
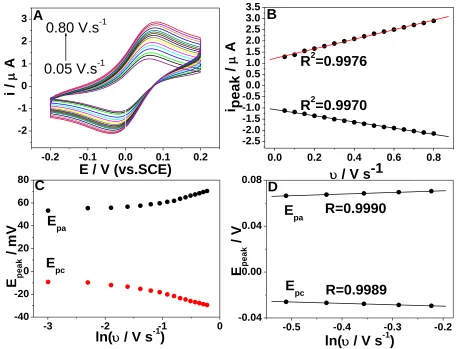
Figure 6A shows the CVs of the (HRP-Cyt c/DNA)4/Cyt c/MUA-MCH/Au (nCyt c/nHRP=7:1;
nCyt c+nHRP=1.6 nmol) in 0.2 M PBS (pH 7.0) at various scan rates. The peak current was enhanced as
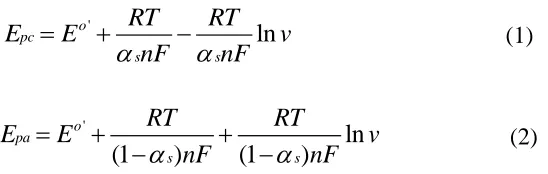
the scan rate increased. Both anodic and cathodic peak current were proportional to the scan rate from 0.05 to 0.8 V s−1 (Figure 6B). These results indicated that the electrode reaction involved a surface-controlled quasi-reversible electrochemical process. The electron-transfer coefficient (αs) and
electron-transfer rate constant (ks) could be determined based on Laviron theory [31]:
'
ln
o pc
s s
RT RT
E E v
nF nF
(1)
'
ln
(1 ) (1 )
o pa
s s
RT RT
E E v
nF nF
(2)
where n is the electron transfer number, R is the gas constant (R = 8.314 J mol−1 K−1), T is the temperature in Kelvin (T = 298 K) and F is the Faraday constant (F = 96493 C mol−1). Figure 6C
1 2 3 4 5 6 7 8 9 10 11
0.8 0.9 1.0 1.1 1.2 1.3 1.4 1.5
A
i /
A
n
Cyt c
:n
HRP1.0 1.2 1.4 1.6 1.8 2.0
0.9 1.0 1.1 1.2 1.3 1.4 1.5
B
i /
A
n
[image:9.596.170.444.619.706.2]
showed the plots of peak potential (Epc, Epa) versus the natural logarithm of the scan rate (ln υ). As the
scan rate ranging from 0.6 to 0.8 V s−1, the plots of Ep versus lnυ yielded two straight lines with slopes
[image:10.596.68.524.171.520.2]of -RT/αnF and RT/(1-α)nF for the cathodic and anodic peak, respectively (Figure 6D). αn was calculated to be 2.114 according to the above slopes.
Figure 6. (A) CVs of the (HRP-Cyt c/DNA)4/Cyt c/MUA-MCH/Au (nCyt c/nHRP=7:1; nCytc+nHRP=1.6
nmol) at different scan rates varied from 0.1 to 0.8 V s−1 with a step of 0.05 V s−1 in 0.2 M N2-saturated PBS (pH 7.0). (B) Plot of ipeak versus scan rate (υ). (C) Plots of the peak potential
(Epa, Epc) versus the natural logarithm of scan rate (ln υ) and (D) Plot of Epa and Epc versus the
natural logarithm of scan rate (ln υ) (υ=0.6, 0.65, 0.7, 0.75, and 0.8 V s−1 ).
According to the previous literature [32], assume 0.3 < α < 0.7, it could be concluded that n = 4, and α = 0.53. Therein, the redox reaction of Cyt c-HRP in the multilayer might belong to four electron-transfer process. It is obviously different from the single electron-transfer process of Cyt c or HRP [33-36], indicating a synergistic interaction between Cyt c and HRP occurred in the resulted multilayer. Assumed single electron transfer in each heme group of Cyt c or HRP, we could presume that only four Cyt c or HRP molecules took part in the redox reaction. Considered the optimal ratio of Cyt c and HRP is 7:1, it is possible to assume that three Cyt c and one HRP involved in the redox reaction. The other four Cyt c molecules might only play an important role in electron shuttling and
-0.2 -0.1 0.0 0.1 0.2
-2 -1 0 1 2 3
A
0.80 V.s
-10.05 V.s
-1i /
A
E / V (vs.SCE)
-0.5 -0.4 -0.3 -0.2
-0.04 0.00 0.04 0.08
D
R=0.9989
R=0.9990
E
pcE
paE
p e a k/ V
ln(
/ V s
-1)
-3 -2 -1 0
-40 -20 0 20 40 60 80
C
E
pcE
paE
p e a k/
m
V
ln(
/ V s
-1)
0.0 0.2 0.4 0.6 0.8
-2.5 -2.0 -1.5 -1.0 -0.5 0.0 0.5 1.0 1.5 2.0 2.5 3.0 3.5
B
R
2=0.9970
R
2=0.9976
i p
e
a
k
/
A
synergistic interaction between Cyt c and HRP. When nΔEp>200 mV, the electron transfer rate ks
could be estimated with the Laviron’s equation [31]:
/
s
k
nFv RT
(3)When the scan rate was 0.1 V s−1, the ks, (Cyt c-HRP) was calculated to be 8.24±0.20 s−1. The
[image:11.596.42.554.253.343.2]electron transfer rate together with some important parameters for various protein modified electrodes was listed in Table 1.
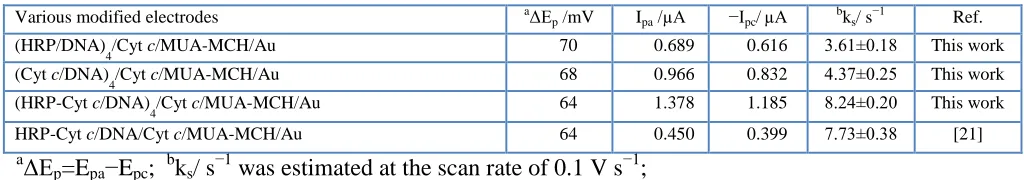
Table 1. Some important parameters for various modified gold electrodes.
Various modified electrodes aΔE
p /mV Ipa /µA −Ipc/µA bks/ s−1 Ref. (HRP/DNA)
4/Cyt c/MUA-MCH/Au 70 0.689 0.616 3.61±0.18 This work (Cyt c/DNA)
4/Cyt c/MUA-MCH/Au 68 0.966 0.832 4.37±0.25 This work (HRP-Cyt c/DNA)
4/Cyt c/MUA-MCH/Au 64 1.378 1.185 8.24±0.20 This work HRP-Cyt c/DNA/Cyt c/MUA-MCH/Au 64 0.450 0.399 7.73±0.38 [21]
aΔEp=Epa−Epc; b
ks/ s−1 was estimated at the scan rate of 0.1 V s−1;
The ks, (Cyt c-HRP) was larger than that of the other electrodes. The fast electron transfer might be
attributed to the following factors [21]. First, the synergistic interaction between HRP and Cyt c might result in an optical conformation to facilitate electron transfer. Second, the electron produced from one protein could transfer to electrode surface by the other protein. Last, the interaction between HRP and Cyt c might result in porous structure in the multilayer which was helpful for the electron transfer by the diffusion of electrolyte between proteins and electrode surface. Compared to the HRP-Cyt c/DNA/Cyt c/MUA-MCH/Au electrode [21], the (HRP-Cyt c/DNA)4/Cyt c/MUA-MCH/Au electrode also showed larger ks. The fast electron transport over four layer of (HRP-Cyt c/DNA)4 might be explained by the porous structure of the multilayer assembly. The arrangement of the multilayer in the biosensor could not be the alignment of one flat layer on the top of one another, but more likely to be a complex protein networks stabilized by DNA networks [21].
3.4. Electrocatalytic properties of the (DNA/Cyt c-HRP)n multilayer modified electrode
The electrocatalytic behaviors of the (HRP-Cyt c/DNA)4/Cyt c/MUA-MCH/Au (nCyt c/nHRP=7:1; nCyt c+nHRP=1.6 nmol) electrode towards the reduction of O2 and H2O2 were both
[image:12.596.62.519.126.467.2]
solution at low scan rate indicated that the constructed (HRP-Cyt c/DNA)4/Cyt c/MUA-MCH/Au electrode could be used as a sensor for O2 detection.
Figure 7. (A) CVs of the (HRP-Cyt c/DNA)4/Cyt c/MUA-MCH/Au electrode in N2-saturated (a), air-saturated (b) and O2-air-saturated (c) 0.2 M PBS (pH 7.0) at the scan rate of 0.005 V s−1. (B) CVs of the (HRP-Cyt c/DNA)4/Cyt c/MUA-MCH/Au electrode in N2-saturated 0.2 M PBS (pH 7.0) with successive addition of 2.5 mM H2O2 in N2-saturated 0.2 M PBS (pH 7.0) at the scan rate of 0.1 V s-1. (C) Current response to successive addition of H2O2 on (HRP/DNA)4/Cyt c/MUA-MCH/Au (a), (Cyt c/DNA)4/Cyt c/MUA-MCH/Au (b) and (HRP-Cyt c/DNA)4/Cyt c/MUA-MCH/Au (c) in 0.2 M PBS (pH 7.0), applied potential: -0.04 V. (D) Calibration curve between current and the concentration of H2O2.
Figure 7B showed the bioelectrocatalytic response of (HRP-Cyt c/DNA)4/Cyt c/MUA-MCH/Au (nCyt c/nHRP=7:1; nCyt c+nHRP=1.6 nmol) electrode towards the reduction of H2O2 in 0.2 M N2 -saturated PBS (pH 7.0). It could be seen that with the increasing of H2O2 concentration (varied from 0 to 7.5 mM), the reduction peak current increased obviously. While the oxidation peak current decreased accordingly, showing a typical electrocatalytic reduction process of H2O2. Figure 7C displayed the typical current-time curves of the (HRP/DNA)4/Cyt c/MUA-MCH/Au (nHRP=1.6 nmol)
(curve a), the (Cyt c/DNA)4/Cyt c/MUA-MCH/Au (nCyt c=1.6 nmol) (curve b) and (HRP-Cyt
c/DNA)4/Cyt c/MUA-MCH/Au (nCyt c/nHRP=7:1; nCyt c+nHRP=1.6 nmol) (curve c) electrode to the
0.0 0.2 0.4 0.6 0.8 1.0 1.2 1.4 1.6 1.8 0 50 100 150 200 250 D c b a
i
SCC
/
n
A
[H
2O2] / mM
-0.2 -0.1 0.0 0.1 0.2
-3 -2 -1 0 1
B
7.5 mM
0 mM
i
/
A
E / V (vs.SCE)
-0.4 -0.3 -0.2 -0.1 0.0 0.1 0.2
-0.20 -0.15 -0.10 -0.05 0.00
A
c
b
a
i /
A
E / V (vs.SCE)
0 100 200 300 400 500 600 700 800
-150 -100 -50 0
50 C
80 M
40 M
a b
c
i
SCC
/
n
A
[image:13.596.48.557.279.363.2]
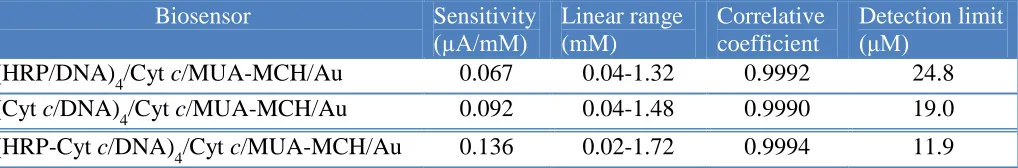
reduction of H2O2, respectively. The amperometric responses of the biosensors were studied by successively adding the H2O2 solution with different concentrations into 0.2 M N2-saturated PBS (pH 7.0) under stirring. Obviously, the bi-protein multilayer electrode showed the best amperometric response. Figure 7D showed the calibration curves of these biosensors. The sensitivity, the linear range, correlative coefficient and the detection limit of various protein modified electrodes were listed in Table 2. The results in Table 2 declared that (HRP-Cyt c/DNA)4/Cyt c/MUA-MCH/Au electrode possessed a better catalytic activity and sensitivity towards the reduction of H2O2. The good performances might result from the synergistic interaction between the two proteins and the multilayer construction.
Table 2. Comparison of the performance of biosensor based on mono-enzyme and bienzyme.
Biosensor Sensitivity
(µA/mM)
Linear range (mM)
Correlative coefficient
Detection limit (μM)
(HRP/DNA)4/Cyt c/MUA-MCH/Au 0.067 0.04-1.32 0.9992 24.8
(Cyt c/DNA)4/Cyt c/MUA-MCH/Au 0.092 0.04-1.48 0.9990 19.0
(HRP-Cyt c/DNA)4/Cyt c/MUA-MCH/Au 0.136 0.02-1.72 0.9994 11.9
3.5. Selectivity, stability, repeatability and reproducibility of the bi-protein multilayer modified electrode
The selectivity of the prepared sensor was examined by sequential additions of 0.2 mM H2O2, 2.0 mM ascorbic acid (AA) and 2.0 mM uric acid (UA) into the stirring 0.2 M N2-saturated PBS (pH 7.0). The results indicated that AA and UA had no obvious interference in the detection of H2O2 under the studied concentration. When the electrode was stored in 0.2 M N2-saturarted PBS (pH 7.0) for 10 days, the current response to 2.5 mM H2O2 only decreased 3.53% of the original current. The repeatability and reproducibility of the current signal for the same electrode and for electrode-to-electrode was estimated to be 3.89% and 4.71% (RSD, n=7), respectively.
4. CONCLUSIONS
the electron transfer of other mixed proteins in a multilayer bio-interphase and the construction of third-generation biosensors.
ACKNOWLEDGEMENTS:
This work was financially supported by National Natural Science Foundation of China (20905032, 21065005, 21165010), Young Scientist Foundation of Jiangxi Province (20112BCB23006), Foundation of Jiangxi Educational Committee (GJJ10389), the State Key Laboratory of Electroanalytical Chemistry (2008003), Scientific Research Foundation for the Returned Overseas Chinese Scholars, the Open Project Program of Key Laboratory of Functional Small organic molecule, Ministry of Education, Jiangxi Normal University (No. KLFS-KF-201214; KLFS-KF-201218), and State Education Ministry and Innovation Foundation for graduate student of Jiangxi Province (YC2011-S037).
References
1. L. Gorton, A. Lindgren, T. D. Larsson, F. Munteanu, T. Ruzgas and I. Gazaryan, Anal. Chim. Acta., 400 (1999)91.
2. C. Nowak, D. Schach, J. Gebert, M. Grosserueschkamp, R. B. Gennis, S. Ferguson-Miller, W. Knoll, D. Walz and R. L. C. Naumann, J. Solid State Electrochem., 15 (2011) 105.
3. K. M. Manesh, P. Santhosh, S. Uthayakumar, A. I. Gopalan and K. P. Leea, Biosens. Bioelectron., 25 (2010), 1579.
4. Z. H. Dai, J. C. Bao, X. D. Yang, H. X. Ju, Biosens. Bioelectron., 23 (2008) 1070.
5. R. Dronov, D. G. Kurth, H. Möhwald, F. W. Scheller and F. Lisdat, Electrochim. Acta., 53 (2007), 1107.
6. C. Yang, C. Xu and X. Wang, Langmuir, 28 (2012) 4580.
7. F. Wegerich, P. Turano, M. Allegrozzi, H. Möhwald and F. Lisdat, Langmuir, 27 (2011) 4202. 8. J. Fu, M. Liu, Y. Liu, N. W. Woodbury and H. Yan, J. Am. Chem. Soc., 134 (2012) 5516. 9. R. Dronov, D. G. Kurth, H. Möhwald, F. W. Scheller and F. Lisdat, Angew. Chem. Int. Ed., 47
(2008) 3000.
10. F. N. Crespilho, M. C. Esteves, P. T. A. Sumodjo, E. J. Podlaha and V. Zucolotto, J. Phys. Chem. C, 113 (2009) 6037.
11. R. M. Iost, J. M. Madurro, A. G. Brito-Madurro, L. Caseli, I. L. Nantes and F. N. Crespilho, Int. J. Electrochem. Sci., 6 (2011) 2965.
12. Q. Gao, Y. Y. Guo, W. Y. Zhang, H. L. Qi and C. X. Zhang, Sensor. Actuator. B-Chem., 153 (2011) 219.
13. M. V. Pishko, I. Katakis, S. E. Lindquist, L. Ye, B. A. Gregg and A. Heller, Angew. Chem. Int. Ed., 29 (1990), 82-84.
14. M. Campas and C. O. Sullivan, Anal. Lett., 36 (2003) 2551.
15. T. F. Schimidt, F. J. Pavinatto, L. Caseli, M. L. C. Gonzaga, S. A. Soares, N. M. P. S. Ricardo and J. O. N. Oliveira, J. Colloid Interf. Sci., 330 (2009) 84.
16. T. E. Goto, R. F. Lopez, R. M. Iost, F. N. Crespilho, L. Caseli, Langmuir, 27 (2011) 2667. 17. G. Decher, Science, 277 (1997) 1232.
18. T. Balkenhohl, S. Adelt, R. Dronov and F. Lisdat, Electrochem. Commun., 10 (2008) 914. 19. R. Spricigo, R. Dronov, F. Lisdat, S. Leimkühler and F. W. Scheller, Anal. Bioanal. Chem., 393
(2009) 225.
20. R. Dronov, D. G. Kurth, H. Möhwald, R. Spricigo, S. Leimkühler, U. Wollenberger, K. V. Rajagopalan, F. W. Scheller and F. Lisdat, J. Am. Chem. Soc., 130 (2008) 1122.
22. A. El Kasmi, J. M. Wallace, E. F. Bowden, S. M. Binet and R. J. Linderman, J. Am. Chem. Soc., 120 (1998) 225.
23. Y. H. Song, W. P. Lian, S. C. Zhao, L. Wang and Z. Li, Microsc. Res. Techniq., 73 (2010) 51. 24. C. Zhu, S. Guo, Y. Zhai and S. Dong, Langumir, 26(2010) 7614.
25. L. Wan, Y. Song, H. Zhu, Y. Wang and L. Wang, Int. J. Electrochem. Sci., 6 (2011) 4700.
26. H. O. Finklea, D. A. Snider, J. Fedyk, E. Sabatani, Y. Gafni and I. Rubinstein, Langmuir, 9 (1993) 3660.
27. E. Mohammed, N. R. Ignacio, D. Manuel, P. H. A. Maria, B. M. Dolores, H. H. C. JoséLuis, Electrochim. Acta., 53 (2008) 7131.
28. Y. Song, L. Wan, K. Cui, L. Liu, M. Zhang, J. Liao, L. Wang and Z. Li, J. Electroanal. Chem., 656 (2011) 206.
29. M. K. Beissenhirtz, F.W. Scheller, W. F. M. Stöcklein, D. G. Kurth, H. Möhwald and F. Lisdat, Angew. Chem. Int. Ed., 43 (2004), 4357-4360.
30. Y. H. Song, L. Wang, C. B. Ren, G. Y. Zhu and Z. Li, Sensor. Actuator. B-Chem., 114 (2006) 1001.
31. E. Laviron, J. Electroanal. Chem., 101 (1979) 19.
32. H. Y. Ma, N. F. Hu and J. F. Rusling, Langmuir, 16 (2000) 4969.
33. L. Zhang, Z. Shi, Q. Lang and J. Pan, Electrochem. Acta., 55 (2009) 641. 34. C. Xiang, Y. Zou, L. Sun and F. Xu, Electrochem. Commun., 10 (2008) 38. 35. S. Zong, Y. Cao, Y. Zhou and H. Ju, Langmuir, 22 (2006) 8915.
36. J. Xu, F. Shang, J. H. T. Luong, K. M. Razeeb and J. D. Glennnon, Biosens. Bioelectron., 25 (2010) 1313.