This is a repository copy of
Modeling Voiced Stop Consonants Using the 3D Dynamic
Digital Waveguide Mesh Vocal Tract Model
.
White Rose Research Online URL for this paper:
http://eprints.whiterose.ac.uk/151809/
Version: Accepted Version
Proceedings Paper:
Gully, Amelia Jane orcid.org/0000-0002-8600-121X and Tucker, Benjamin (2019) Modeling
Voiced Stop Consonants Using the 3D Dynamic Digital Waveguide Mesh Vocal Tract
Model. In: Proceedings of the International Congress of Phonetic Sciences 2019.
International Congress of Phonetic Sciences . Australasian Speech Science and
Technology Association Inc. .
[email protected] https://eprints.whiterose.ac.uk/
Reuse
This article is distributed under the terms of the Creative Commons Attribution-NonCommercial-NoDerivs (CC BY-NC-ND) licence. This licence only allows you to download this work and share it with others as long as you credit the authors, but you can’t change the article in any way or use it commercially. More
information and the full terms of the licence here: https://creativecommons.org/licenses/
Takedown
If you consider content in White Rose Research Online to be in breach of UK law, please notify us by
MODELING VOICED STOP CONSONANTS USING THE 3D DYNAMIC
DIGITAL WAVEGUIDE MESH VOCAL TRACT MODEL
Amelia J. Gully1, Benjamin V. Tucker2
1Department of Language and Linguistic Science, University of York, UK,2Department of
Linguistics, University of Alberta, Canada [email protected], [email protected]
ABSTRACT
Three-dimensional (3D) acoustic simulations of the vocal tract are showing significant promise for the
study of speech acoustics. Recent models have
demonstrated dynamic behaviour, but currently only vowels and sonorant consonants have been repro-duced, limiting the applications of such models. We present a method for producing voiced stop conso-nants in an intervocalic context, using a 3D digital waveguide mesh (DWM) simulation based on mag-netic resonance imaging data of the vocal tract. The synthetic output demonstrates appropriate formant transitions leading to several intelligible stop conso-nants. This method represents a step towards a com-plete phoneme inventory for 3D vocal tract models, and demonstrates the suitability of the 3D DWM vo-cal tract model for the simulation of dynamic speech elements. The proposed method also offers consid-erable opportunity for controlled perceptual study of the acoustics of voiced stop consonants.
Keywords: speech synthesis, stop consonants, vo-cal tract modeling, digital waveguide mesh.
1. INTRODUCTION
Three-dimensional (3D) acoustic simulations of the vocal tract, usually based on magnetic resonance imaging (MRI) data, have appeared in the literature over approximately the last decade (e.g. [12, 16, 1]). These detailed models offer unparalleled opportuni-ties for research into the physics of speech produc-tion and accurate simulaproduc-tion of speech. However, many 3D vocal tract models are static, capable of producing held vowels only. Although recent mod-els have been shown to be capable of synthesizing diphthongs and sonorants [6, 4], obstruents have not yet been simulated, limiting the use of 3D simula-tions to the study of isolated phonemes. This paper presents a method for synthesizing voiced stop con-sonants based on the 3D dynamic digital waveguide mesh (DWM) vocal tract model presented in [6].
A stop consonant occurs when there is a complete
occlusion of the vocal tract. Stop consonants have three phases based on the movement of the articula-tors: closure, hold, and release. The movement of the articulators results in formant transitions, which are important cues for identifying the place of the articulation of the stop consonant [3]. Stop con-sonants show a wide range of variability in natural speech, often omitting, or only partially realising, one of the above phases [17]. A 3D vocal tract sim-ulation capable of modelling all aspects of stop con-sonant variability would be of considerable value for controlled studies of their perception.
Stop consonants have been well studied using one-dimensional (1D) simulations of the vocal tract. For example [13, 14, 15] describe a 1D vocal tract model based on vocal tract area functions derived from MRI data. Stops in an intervocalic context are implemented as a closing gesture local to the occlusion location, superimposed on an underlying vowel-vowel transition across the rest of the tract. This approach has been found to appropriately re-produce the acoustics of stop consonant production. An alternative system [2] uses a 3D model of the vocal tract articulators, based on MRI data, to con-trol a 1D vocal tract simulation. However, a true 3D simulation method offers opportunities for more detailed study, particularly regarding acoustic phe-nomena not reproduced under the plane wave as-sumption inherent in 1D simulations.
sim-ulated in an intervocalic context using a 3D DWM technique. A longer-term aim of this research is to study the effect of varying model parameters on stop consonant perception.
2. METHOD
2.1. MRI data collection
Volumetric MRI data was collected for one phonetically-trained subject (female British English speaker, age 28) in a GE 3T Signa Excite MRI scan-ner, with the following parameters: 3D GRE
se-quence, TR 4.736ms, TE 1.68ms, FA 5◦, 80
contigu-ous 2mm sagittal slices with no gap. This resulted in a 16 second scan time. All static British English phonemes were captured and this study uses data for the vowels /i/ and /a/ and the hold phases of stop consonants /b/, /d/, /g/. Due to scan time limitations, it was not possible to obtain MRI data for stops in vowel-specific contexts, so the scan subject was in-structed to produce them in a ‘neutral’ (schwa) con-text. It was shown in [15] that consonant constric-tions can be implemented as a localized constriction on a vowel-vowel articulatory transition in a 1D vo-cal tract model. This study tests this approach with 3D volumetric data, superimposing the closures for /b/, /d/ and /g/ upon the vocal tract shapes for the vowels, as illustrated for /i/ in Figure 1.
The MRI data were segmented using the auto-matic region growing algorithm in itk-SNAP [18] and hand-corrected to remove leakage into sur-rounding tissues. An additional scan capturing the teeth was used to remove teeth from the segmenta-tions using a method similar to that of [19]. The segmentations were converted to 3D Cartesian grids, following [6], to permit DWM modelling.
2.2. The DWM model
The digital waveguide mesh (DWM) is a multidi-mensional numerical acoustic modeling technique, previously demonstrated for vocal tract modelling in [10, 12, 6], with [10] and [6] introducing a dynamic DWM vocal tract model in 2D and 3D respectively.
The 3D dynamic DWM approach models the vo-cal tract as part of a cuboid domain comprising a Cartesian mesh of short interconnected waveguides. Acoustic pressures are propagated throughout this domain during a simulation, and acoustic scattering
takes place where acoustic impedance (Z) changes.
Each waveguide is assigned a Z value
correspond-ing to air (Zair=399 Pa s m−3) or surrounding tissue
(Ztissue=83666 Pa s m−3), based on its equivalent
location in the MRI data [6]. By interpolating
be-Figure 1: Midsagittal profile from MRI data for vowel /i/, showing the locations of superimposed consonantal closures for /b, d, g/.
tween different impedance ‘maps’ over the course of a simulation, dynamic movement of the vocal tract is simulated. A source signal representing the glot-tal flow waveform is added sample-by-sample at a mesh location corresponding to the physical loca-tion of the glottis, and the output sound pressures are recorded at a mesh location corresponding to a microphone position close to the mouth, to obtain a synthetic speech waveform.
2.3. Articulation
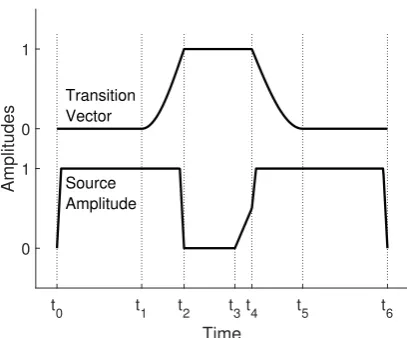
Articulation in the DWM simulation is modeled by interpolating between impedance maps. Simulat-ing /ibi/, for instance, would require two impedance maps—one each for /i/ and /b/—and at any time sample, the impedance values throughout the do-main will be some weighted combination of these. As a result, rather than true articulator movement during a transition, any location where the artic-ulator has been or will be takes on an intermedi-ate impedance value. This non-physical behaviour has been shown to produce perceptually-acceptable diphthongs in [6], but its applicability for obstru-ents is not yet known. The time-dependence of the weights is described by a transition vector varying between 0 (vowel) and 1 (stop; i.e. a complete oc-clusion of the vocal tract).
In [2], the transition vector between one set of vo-cal tract articulator positions and another is given as a sigmoid function. However, because the articula-tor approaches a ‘virtual target’ beyond vocal tract
boundaries, theairway closure is not released until
[image:3.595.346.507.124.296.2]Figure 2: Transition (top) and source amplitude (bottom) vectors for 3D dynamic DWM simula-tion of VCV utterances.
t0 t1 t2 t3t4 t5 t6
Time 0
1 0 1
Amplitudes
Transition Vector
Source Amplitude
shapes not articulator positions, the transition vector uses a quarter wavelength sine function to approxi-mate the resulting airway shape transition, as illus-trated in Figure 2. This results in abrupt transitions
atT =t2 andT =t4 where the occlusion is formed
or released by the action of the moving articulators.
2.4. Voice Source
The dynamic 3D DWM vocal tract model makes use of a source signal approximating the glottal flow (in this case the Rosenberg pulse [11]), which is input at a location in the model equivalent to the phys-ical position of the larynx [6]. The pitch contour of the source signal is obtained from recordings of the MRI subject’s speech averaged across VCV ut-terances. Jitter and shimmer are also added to the source signal to improve naturalness.
Since the simulation method does not currently feature interaction between the vocal tract and the voice source, the amplitude of the source signal is adjusted in conjunction with the transition vector, to mimic the natural onset and offset of phonation caused by the tract occlusion. As a result, it is pos-sible to precisely control voice onset time (VOT)— the duration between the release of the closure and the onset of phonation—which is another important acoustic cue for stop consonants [9]. An example source amplitude envelope, demonstrating a nega-tive VOT, can be seen in Figure 2.
The combination of articulator positions, transi-tion timings and VOTs are expected to result in intel-ligible simulated VCV utterances. The next section presents the results of these simulations.
3. RESULTS
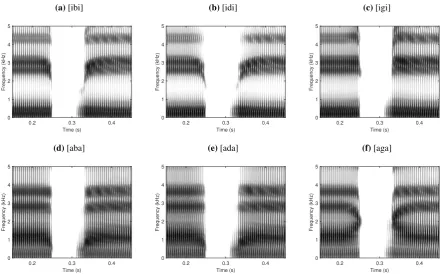
Spectrograms for the simulated /b, d, g/ in each con-text /i, a/ are shown in Figure 3 (pre-emphasis
ap-plied). The stops have an onset duration (t2−t1) of
50ms, a closure duration (t4−t2) of 80ms, a VOT
(t3−t4) of -20ms and an offset duration (t5−t4)
of 80ms. These parameters are within published ranges for stop consonants and were found to pro-vide acceptable results across all vowel/stop combi-nations, although different parameter combinations were more suitable for certain VCVs. Audio exam-ples are available at [7]. Impressions from informal listening are given below, but full perceptual testing is planned for the near future.
Simulations for /b/ (left column of Figure 3) show the decrease in F2 characteristic of a bilabial stop in both vowel contexts, with the decrease particu-larly significant for in the /i/ context given the high vowel F2. The audio data supports this, with /b/ in-telligible in both vowel contexts. Simulations for /g/ are illustrated in the right column of Figure 3. An appropriate F2 transition, and a clear F3 transition, are demonstrated for /aga/, leading to an audible /g/ sound. Almost no transition is visible for /igi/, per-haps owing to the already high F2 for /i/, and a /g/ is not reliably perceived. Finally, simulations for /d/ are shown in the centre column of Figure 3. The F2 transition for /idi/ is similar to that for /ibi/ albeit slightly shorter, and for /ada/ the second formant de-creases rather than increasing as expected. As a re-sult both of these stops sound like /b/ rather than /d/.
4. DISCUSSION
The successful simulations of /ibi/, /aba/ and /aga/ demonstrate that the 3D dynamic DWM vocal tract model is capable of synthesizing acceptable stop consonants. This is particularly encouraging given the non-physical nature of phoneme transitions us-ing the current method (as described in Section 2.3). Furthermore, this suggests that superimposing a consonant closure upon the vocal tract shape for a vowel is valid even in 3D simulations, providing fur-ther support to the hypothesis that articulators not directly involved in the occlusion have limited im-pact upon the acoustics of the resulting consonant, as previously demonstrated in 1D [14].
Figure 3:Spectrograms for simulated VCV utterances witht2−t1=50ms,t4−t3=20ms,t5−t4=80ms. Vowels
extend for 200ms either side of consonant closure but are cropped for clarity.
(a)[ibi]
0.2 0.3 0.4 Time (s)
0 1 2 3 4 5
Frequency (kHz)
(b)[idi]
0.2 0.3 0.4 Time (s)
0 1 2 3 4 5
Frequency (kHz)
(c)[igi]
0.2 0.3 0.4 Time (s)
0 1 2 3 4 5
Frequency (kHz)
(d)[aba]
0.2 0.3 0.4 Time (s)
0 1 2 3 4 5
Frequency (kHz)
(e)[ada]
0.2 0.3 0.4 Time (s)
0 1 2 3 4 5
Frequency (kHz)
(f)[aga]
0.2 0.3 0.4 Time (s)
0 1 2 3 4 5
Frequency (kHz)
the effect of gravity while supine in an MRI scanner has previously been observed in e.g. [5], resulting in an advanced tongue position. Hyperarticulation is a natural consequence of holding articulations for an MRI scan [5], but a 16-second hold phase is partic-ularly unnatural and may inherently result in a vocal tract shape that differs from that of normal speech. It is also probable that limitations of the simulation method, described in [6], such as having a single high value for the vocal tract wall impedance, or the non-physical phoneme transitions described above, contribute to erroneous formant transitions.
The absence of a burst at the release of the stop does not appear to have been necessary for the per-ception of /ibi/, /aba/ and /aga/, but may be another factor affecting the identification of the alveolar con-sonants. Work on the simulation method is ongo-ing, to address the flow issue among other
improve-ments. Furthermore, the optimum transition and
source amplitude vectors will have subtly different shapes for each place of articulation, which may also provide cues to place of articulation.
The major strength of the 3D vocal tract model-ing approach is that the user has fine-grained con-trol over the geometry of the vocal tract airway once
the model has been created. In addition to distance from the glottis, degree, length, and skewness of a constriction, as used in 1D models [14], it is pos-sible to exert precise control over all aspects of the closure. Furthermore, transition vectors can be de-fined for different parts of the vocal anatomy inde-pendently. Upcoming work will make use of this flexibility to explore the impact of different closure shapes upon the perception of stop consonants.
5. CONCLUSION
This paper has presented evidence that 3D acoustic simulations of the vocal tract are capable of produc-ing acceptable voiced stop consonants, representproduc-ing a step towards a full phoneme inventory for such models. Future work will involve detailed study of the impact of changes in timing and articulation pa-rameters on stop consonant perception.
ACKNOWLEDGMENTS
6. REFERENCES
[1] Arnela, M., Guasch, O., Dabbaghchian, S., Eng-wall, O. 2016. Finite element generation of vowel sounds using dynamic complex three-dimensional vocal tracts. Proc. 23rd Int. Congr. Sound Vib.
Athens, Greece.
[2] Birkholz, P. 2013. Modeling consonant-vowel coarticulation for articulatory speech synthesis.
PLoS One8(4). e60603.
[3] Cooper, F. S., Delattre, P. C., Liberman, A. M., Borst, J. M., Gerstman, L. J. 1952. Some experi-ments on the perception of synthetic speech sounds.
The Journal of the Acoustical Society of America
24(6), 597–606.
[4] Dabbaghchian, S., Arnela, M., Engwall, O., Guasch, O. 2018. Reconstruction of vocal tract ge-ometries from biomechanical simulations. Interna-tional Journal for Numerical Methods in
Biomedi-cal Engineering0(0).
[5] Engwall, O. 2000. Are static MRI measurements representative of dynamic speech? Results from a comparative study using MRI, EPG and EMA.
Proc. INTERSPEECHBeijing, China. 17–20.
[6] Gully, A. J., Daffern, H., Murphy, D. T. 2018. Diphthong synthesis using the dynamic 3D digital waveguide mesh. IEEE/ACM Trans. Audio Speech
and Language Process.26(2), 243–255.
[7] Gully, A. J., Tucker, B. V. Aug. 2019. Audio from: ’Modeling voiced stop consonants using the 3D dy-namic digital waveguide mesh vocal tract model’.
http://doi.org/10.5281/zenodo.2616613.
[8] Halle, M., Hughes, G. W., Radley, J. A. 1957. Acoustic properties of stop consonants. J. Acoust.
Soc. Am.29(1), 107–116.
[9] Lisker, L., Abramson, A. S. 1964. A cross-language study of voicing in initial stops: Acous-tical measurements.Word20(3), 384–422. [10] Mullen, J., Howard, D. M., Murphy, D. T. 2007.
Real-time dynamic articulations in the 2-D waveg-uide mesh vocal tract model. IEEE Trans. Audio
Speech and Language Process.15(2), 577–585.
[11] Rosenberg, A. E. 1971. Effect of glottal pulse shape on the quality of natural vowels.J. Acoust. Soc. Am.
49(2), 583–590.
[12] Speed, M., Murphy, D. T., Howard, D. M. 2014. Modeling the vocal tract transfer function using a 3D digital waveguide mesh.IEEE/ACM Trans.
Au-dio Speech and Language Process.22(2), 453–464.
[13] Story, B. H. 2005. A parametric model of the vocal tract area function for vowel and consonant simula-tion.J. Acoust. Soc. Am.117(5), 3231–3254. [14] Story, B. H., Bunton, K. 2010. Relation of vocal
tract shape, formant transitions, and stop consonant identification. J. Speech Lang. Hear. Res.53(6), 1514–1528.
[15] Story, B. H., Bunton, K. 2017. An acoustically-driven vocal tract model for stop consonant produc-tion.Speech Commun.87, 1–17.
[16] Takemoto, H., Mokhtari, P., Kitamura, T. 2010. Acoustic analysis of the vocal tract during vowel
production by finite-different time-domain method.
J. Acoust. Soc. Am128(6), 3724–3738.
[17] Warner, N., Tucker, B. V. 2011. Phonetic variabil-ity of stops and flaps in spontaneous and careful speech.J. Acoust. Soc. Am.130(3), 1606–1617. [18] Yushkevich, P. A., Piven, J., Hazlett, H. C., Smith,
R. G., Ho, S., Gee, J. C., Gerig, G. 2006. User-guided 3D active contour segmentation of anatom-ical structures: significantly improved efficiency and reliability.Neuroimage31(3), 1116–1128. [19] Zhang, J., Honda, K., Wei, J. 2018. Tooth
visu-alization in vowel production mr images for three-dimensional vocal tract modeling.Speech