Int. J. Electrochem. Sci., 8 (2013) 3687 - 3695
International Journal of
ELECTROCHEMICAL
SCIENCE
www.electrochemsci.org
Effects of Microporous Layer on PBI-based Proton Exchange
Membrane Fuel Cell Performance
Chun-Ting Liu, Min-Hsing Chang*
Department of Mechanical Engineering, Tatung University, Taipei 104, Taiwan *
E-mail: [email protected]
Received: 17 January 2013 / Accepted: 9 February 2013 / Published: 1 March 2013
This study investigates the influence of microporous layer (MPL) on the performance of a high-temperature proton exchange membrane fuel cell utilizing a phosphoric-acid-doped polybenzimidazole (PBI) electrolyte. The effects of MPL compositions including polytetrafluorethylene (PTFE) and carbon black are considered. Under the same catalyst loading, phosphoric acid doping level, and operation conditions, the fuel cell performance is measured to evaluate the importance of MPL and determine the optimal PTFE content and carbon loading. The method of electrochemical impedance spectroscopy is employed to characterize the variations in the ohmic resistance and polarization losses within the cell. The results show that both the PTFE content and carbon loading in the MPL may affect the cell performance significantly. The MPL with a PTFE content of 40 wt% and carbon loading of 1.0 mg cm-2 is found to give the optimal cell performance.
Keywords: Polybenzimidazole; Microporous layer; Polytetrafluorethylene; Carbon loading.
1. INTRODUCTION
assemblies (MEAs) [3-7] or prepared MEAs with a fixed polytetrafluorethylene (PTFE) content and carbon loading in the microporous layer (MPL) [8-19]. The influences of the PTFE content of the gas diffusion layer (GDL) and the PTFE and carbon loadings in the MPL on the cell performance are usually ignored. The gas diffusion media generally consist of a layer of substrate such as carbon paper or cloth with an MPL coating on the surface facing the proton conduction membrane. As pointed out by Seland et al. [10], the carbon paper or cloth is generally wet-proofed by incorporating PTFE in its fiber structure. The substrate is wet-proofed to prevent it from getting soaked during the spraying procedure in the MPL coating process and reduce the penetration of carbon powder into the substrate. The coating of MPL on the substrate surface before the deposition of a catalyst layer has been found to be beneficial because the MPL coating can prevent the catalyst particles from penetrating into the substrate and ensure a good electronic bonding between the substrate and the catalyst layer. The MPL is generally made up of PTFE and carbon powder; PTFE is used to enhance the bonding between the MPL and the substrate rather than enhancing the water management in a PBI-based high-temperature fuel cell. Lobata et al. [20] first considered the influence of the PTFE loading in the GDL on the cell performance. They used commercial Toray graphite paper as the GDL and found that the lower the PTFE content, the better was the cell performance. Accordingly, they suggested that the PTFE content in the carbon paper should be as low as possible. Their results showed that carbon paper loaded with 10% PTFE might provide good mechanical properties while causing only a slight degradation in the cell performance. They further considered the effect of carbon loading in the MPL [21] and found that for a GDL made of carbon paper, the optimal carbon loading is 2 mg cm-2 for both the anode and the cathode sides. So far very few studies have performed related investigations. Motivated by this, in the present study, we performed systematic measurements to determine the effect of the PTFE content and carbon loading in the MPL on the performance of a PBI-based PEM fuel cell. The MEA was fabricated using a commercial PBI membrane with carbon cloths (used as the GDLs). The GDL surface was coated on one side with MPL having different PTFE contents and carbon loadings. Accordingly, the optimal composition of the MPL could be evaluated by testing the variation in the cell performance.
2. EXPERIMENTAL
The PBI membrane used in these experiments is made of Advent® (series number GSM006077); the membrane thickness is 50 m before the doping of phosphoric acid. For the preparation of the MEA, the PBI membrane was first immersed in an 85 wt% phosphoric acid bath at 60C to achieve proton conduction. The doping level was estimated from the change in membrane weight before and after doping, and it was controlled to approximately 6.7 molecules of acid per repeat unit of PBI. To prepare the GDEs, a GDL made of carbon cloth (E-TEK Inc., B1ASWP Designation A, 400m thick, 30% wet-proofed) was used as the substrate; then, it was deposited by spraying an MPL on the surface facing the PBI membrane. The MPL consists of Vulcan XC-72R carbon black and PTFE. In order to determine the optimal composition of the MPL, the loadings of carbon powder and PTFE within the MPL were adjusted within the ranges of 0.5~2.0 mg -2
cm and 0% ~ 60 wt%, respectively. After coating the MPL, the catalyst layer was deposited onto the MPL to form the GDE. The catalyst ink was prepared from Pt/C powder (20 wt% Pt on Vulcan XC-72, E-TEK Inc.), PBI solution (5 wt% in N,N-dimethylacetamide (DMAc)), and DMAc as solvent. The platinum catalyst loading was 1.0 mg -2
cm . To remove DMAc, the GDE was dried in an air circulation oven after the deposition of catalyst layer and then sintered at 190 C for 2 h. Next, the GDE was wetted with a 10 wt% phosphoric acid solution for one day in order to absorb the acid. Finally, the doped PBI membrane was sandwiched between the two GDEs to form the MEA. The reaction area on the MEA was 2 cm × 2 cm. The same GDEs, on both the anode and the cathode sides, were used in all the experiments.
The experimental measurements focus on determining the effect of the MPL composition on the fuel cell performance, and the optimal composition of the MPL. Accordingly, the cell performance was measured under different loadings of carbon black and PTFE contents. A Hephas® P-300 fuel cell test station was employed to measure the cell performance and obtain polarization curves. Pure hydrogen and compressed air were used as the fuel and the oxidant, respectively. The flow rates of hydrogen and air were controlled by mass flow controllers (MFCs) fixed at 150 sccm and 350 sccm, respectively. Before measuring the polarization curve, the MEA was first conditioned at a fixed potential of 0.6 V for 24 h to ensure that the cell performance is stabilized and produces steady current. The polarization curves were obtained by scanning the cell potential from an open circuit voltage (OCV) to 0.3 V and then recording the resulting current densities. The Electrochemical impedance spectroscopy (EIS) measurements were also performed to characterize the contributions to the cell resistance. A frequency response analyzer (FRA) module coupled with an Autolab PGSTAT 302N potentiostat was employed in the EIS measurements. The impedance spectra were recorded by sweeping frequencies over the range of 10 mHzto 10 kHz with the amplitude of the AC current held at 5% of that of the DC current. The obtained spectra were further analyzed by an equivalent circuit to investigate the characteristics of the cell performance.
3. RESULTS AND DISCUSSION
was determined by evaluating the variation in the polarization curves at different carbon loadings. Second, the influence of the different PTFE contents in the MPL was measured while keeping the carbon loading constant in the tests. Accordingly, the optimal composition of the MPL was determined.
Current density (mA/cm )
C
e
ll
v
o
lt
a
g
e
(V
)
P
o
w
e
r
d
e
n
s
it
y
(m
W
/c
m
)
0 200 400 600 800
0 0.2 0.4 0.6 0.8 1
0 50 100 150 200 250 300
0.5 mg cm 1.0 mg cm 1.5 mg cm 2.0 mg cm
2
2
-2 -2
-2 -2
Frame 00115 Nov 2012
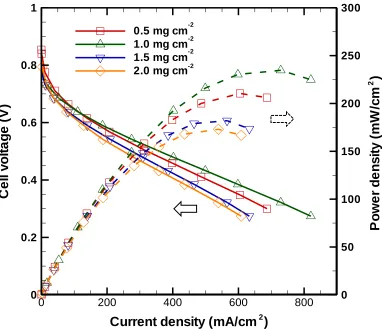
Figure 1. Polarization and corresponding power density curves at different carbon loadings in the MPL. The PTFE content is fixed at 40 wt%.
The polarization curves at different carbon loadings with a 40% PTFE content in the MPL are shown in Fig. 1. Clearly, the variation of carbon loading in the MPL significantly affects the cell performance. With an increase in the carbon loading from 0.5 to 1.0 mgcm-2, the limiting current density increased from 690 to 820 mA -2
[image:4.596.108.490.170.499.2]
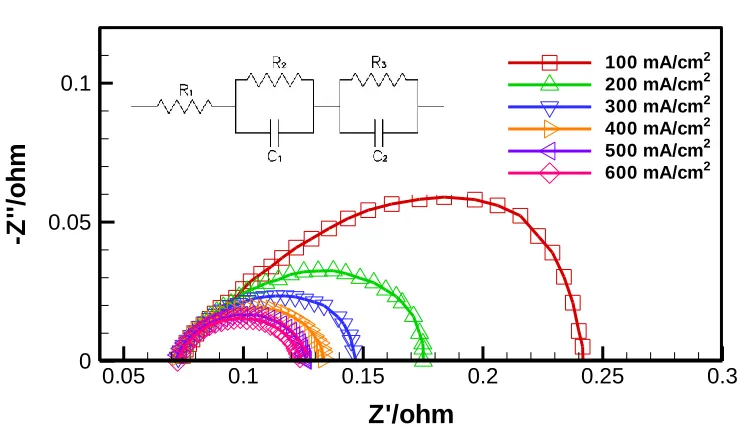
EIS was also used to investigate the cell performance and provide further understanding of the effect of carbon loading. Impedance spectra at a typical carbon loading of 0.5 mg -2
cm as a function of the current density are illustrated in Fig. 2.
Z'/ohm
-Z
''
/o
h
m
0.05 0.1 0.15 0.2 0.25 0.3
0 0.05 0.1
100 mA/cm 200 mA/cm 300 mA/cm 400 mA/cm 500 mA/cm 600 mA/cm
2 2 2 2 2 2
Figure 2. Impedance spectra at different current densities for a typical case of carbon loading of 0.5 mgcm-2 in the MPL.
[image:5.596.95.465.160.375.2][image:6.596.50.498.199.285.2]
loadings in the MPL are given in Table 1 at the operating current density of 600 mAcm-2. It can be observed that the variation in R1 with the carbon loading in MPL is limited. The ohmic resistance is mainly due to the membrane resistance and the resistance arising from the electrode structure. Its value depends on the doping level of the acid in the membrane as well as the composition in the electrodes.
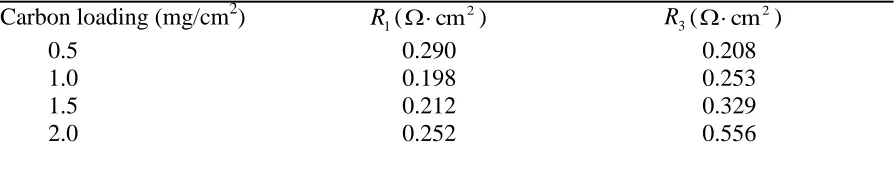
Table 1. Ohmic (R1) and polarization (R3) resistances at different carbon loadings in MPL.
Carbon loading (mg/cm2) R1( 2
cm
) R3( 2
cm
)
0.5 0.290 0.208 1.0 0.198 0.253 1.5 0.212 0.329 2.0 0.252 0.556
The membrane resistance is supposed to be constant in all the cases with the same doping level of phosphoric acid [3]. Thus, the magnitude of R1 changes slightly with the variation of carbon loading in the MPL since the coating of MPL could affect the condition of electronic bonding between the gas diffusion medium and the catalyst layer. The results show that the minimum ohmic resistance was obtained with the carbon loading of 1.0 mgcm-2. However, the polarization resistance increases gradually with the carbon loading and rises rapidly when the carbon loading is over 1.0 mgcm . This -2 indicates that an increase of carbon loading in MPL could lower the kinetic and mass transfer conditions in the electrode. Higher carbon loading may reduce the effectiveness of the catalyst layer coated on the substrate. Combining the effects of both R1 and R3 , the result indicates that the enhancement in the cell performance from carbon loading 0.5 to 1.0 mgcm-2 is mainly due to the reduction in the ohmic resistance. Once the carbon loading increases further to 1.5 mgcm-2 or more, the polarization resistance becomes dominant and causes the cell performance to degrade significantly.
Current density (mA/cm )
C e ll v o lt a g e (V ) P o w e r d e n s it y (m W /c m )
0 200 400 600 800
0 0.2 0.4 0.6 0.8 1 0 50 100 150 200 250 300 PTFE 0% PTFE 15% PTFE 30% PTFE 40% PTFE 50% PTFE 60% 2 2
Frame 00115 Nov 2012
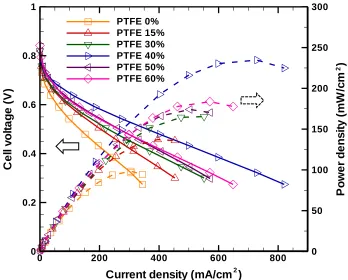
Figure 3. Polarization amd corresponding power density curves at different PTFE contents in the MPL. The carbon loading is fixed to 1.0 mgcm . -2
[image:7.596.125.473.100.380.2]However, the influence of the PTFE content of the high-temperature PBI-based PEM fuel cell is usually ignored as the operating temperature is generally over 120C, and thus, the flooding problem can be resolved naturally.
Table 2. Ohmic (R1) and polarization (R3) resistances at different PTFE contents in MPL.
PTFE content (wt %) R1( 2 cm
) R3( 2
cm
)
15 0.237 0.556 30 0.194 0.394 40 0.202 0.258 50 0.227 0.302 60 0.233 0.311
[image:7.596.56.497.555.646.2]
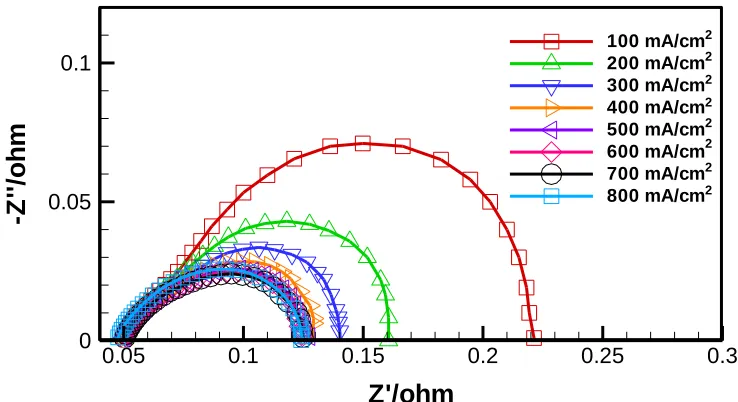
polarization resistance is still the dominant mechanism. Using the same technique of equivalent circuit analysis, we can obtain the variations in the ohmic resistance and polarization resistance with the PTFE content in MPL at an assigned current density; the results are shown in Table 2 at the operating current density of 400 mA -2
cm .
Z'/ohm
-Z
''
/o
h
m
0.05 0.1 0.15 0.2 0.25 0.3
0 0.05 0.1
100 mA/cm 200 mA/cm 300 mA/cm 400 mA/cm 500 mA/cm 600 mA/cm 700 mA/cm 800 mA/cm
2 2 2 2 2 2 2 2
Figure 4. Impedance spectra at different current densities for a typical case of PTFE content of 40 wt% in the MPL.
It can be observed that the ohmic resistance has a minimum at the case of 30% PTFE content and then increases slightly with increasing PTFE content. Note that the difference in R1 between the cases of 30% and 40% is quite limited. The polarization resistance R3 is relatively larger at 15% PTFE content. It appears to decrease rapidly with increasing PTFE content, reaches a minimum at 40%, and then increases slowly with PTFE content. This result indicates that the PTFE content in the MPL may affect the reaction kinetics and gas diffusion condition in the electrode significantly and should be a dominant factor in the determination of cell performance. An appropriate PTFE content may enhance the effectiveness of the catalyst layer and thus reduce the corresponding polarization resistance. The overall effect of R1 and R3 shows that the case of 40% PTFE content in the MPL could give the optimal cell performance. An increase in the PTFE content beyond 40% may slightly enhance both the ohmic and polarization resistances and thus causes the degradation of the cell performance.
4. CONCLUSIONS
[image:8.596.95.464.164.365.2]
the MPL is quite important in achieving the optimal performance of a PBI-based fuel cell. The optimal composition of the MPL is found to be a carbon loading of 1.0 mg -2
cm with PTFE content of 40%. The cell performance is more sensitive to the variation of the PTFE content; furthermore, the EIS results show that the polarization resistance in a PBI-based high-temperature fuel cell can be influenced significantly by the PTFE content of the MPL. Further studies focusing on the effect of different carbon powders and hydrophobic agents in the MPL will be interesting and necessary to enhance the performance of a PBI-based high-temperature fuel cell system.
ACKNOWLEDGMENTS
The authors gratefully acknowledge the financial support from National Science Council of Taiwan through the grant NSC 97-2221-E-036-036.
References
1. Y. L. Ma, J. S. Wainright, M. H. Litt, R. F. Savinell, J. Electrochem. Soc., 151 (2004) A8-A16. 2. R. He, Q. Li, A. Bach, J. O. Jensen, N. J. Bjerrum, J. Membrane Sci., 277 (2006) 38-45.
3. A.R. Korsgaard, R. Reshauge, M. P. Nielsen, M. Bang, S. K. Kar, J. Power Sources, 162 (2006) 239-245.
4. N. H. Jalani, M. Ramani, K. Ohlsson, S. Buelte, G. Pacifico, R. Pollard, R. Staudt, R. Datta, J. Power Sources, 160 (2006) 1096-1103.
5. Y. Tang, J. Zhang, C. Song, J. Zhang, Electrochem. Solid-state Letts., 10 (2007) B142-B146. 6. J. Zhang, Y. Tang, C. Song, J. Zhang, J. Power Sources, 172 (2007) 163-171.
7. C. Y. Chen, W. H. Lai, J. Power Sources, 195 (2010) 7152-7159.
8. J. Hu, H. Zhang, Y. Zhai, G. Liu, J. Hu, B. Yi, Electrochim. Acta 52 (2006) 394-401. 9. J. Hu, H. Zhang, Y. Zhai, G. Liu, B. Yi, Int. J. Hydrogen Energy, 31 (2006) 1855-1862. 10.F. Seland, T. Berning, B. Borresen, R. Tunold, J. Power Sources, 160 (2006) 27-36. 11.G. Liu, H. Zhang, J. Hu, Y. Zhai, D. Xu, Z. Shao, J. Power Sources, 162 (2006) 547-552. 12.Y. Zhai, H. Zhang, G. Liu, J. Hu, B. Yi, J. Electrochem. Soc., 154 (2007) B72-B76. 13.K. Scott, S. Pilditch, M. Mamlouk, J. Appl. Electrochem., 37 (2007) 1245-1259.
14.14 O. E. Kongstein, T. Berning, B. Borresen, F. Seland, R. Tunold, Energy, 32 (2007) 418-422. 15.J. Lobato, P. Canizares, M. A. Rodrigo, J. J. Linares, Electrochim. Acta, 52 (2007) 3910-3920. 16.S. Yu, L. Xiao, B. C. Benicewicz, Fuel Cells, 8 (2008) 165-174.
17.E. U. Ubong, Z. Shi, Z. Wang, J. Electrochem. Soc., 156 (2009) B1276-B1282. 18.M. Mamlouk, K. Scott, Int. J. Hydrogen Energy, 35 (2010) 784-793.
19.J. Lobato, P. Canizares, M. A. Rodrigo, J. J. Linares, F. J. Pinar, Int. J. Hydrogen Energy, 35 (2010) 1347-1355.
20.J. Lobato, P. Canizares, M. A. Rodrigo, C. Ruiz-Lopez, J. J. Linares, J. Appl. Electrochem., 38 (2008) 793-802.
21.J. Lobato, P. Canizares, M. A. Rodrigo, D. Ubeda, F. J. Pinar, J. J. Linares, Fuel Cells, 10 (2010) 770-777.
22.X. Yuan, J. C. Sun, M. Blanco, H. Wang, J. Zhang, D. P. Wilkinson, J. Power Sources, 161 (2006) 920-928.