Int. J. Electrochem. Sci., 7 (2012) 2320 - 2333
International Journal of
ELECTROCHEMICAL
SCIENCE
www.electrochemsci.org
Adsorption Behaviour of Cefapirin on Mild Steel in
Hydrochloric Acid Solution
Ashish Kumar Singh1, 2,*, Eno E. Ebenso1, M. A. Quraishi2
1
Department of Chemistry, School of Mathematical and Physical Sciences, North- West University (Mafikeng Campus), Private Bag X2046, Mmabatho 2735, South Africa
2
Department of Applied Chemistry, Institute of Technology, Banaras Hindu University, Varanasi 221 005 (India)
*
E-mail: [email protected]
Received: 12 February 2012 / Accepted: 19 February 2012 / Published: 1 March 2012
The adsorption behaviour of cefapirin (CFP) on mild steel (MS) in 1 M HCl solution was studied using potentiodynamic polarization, electrochemical impedance spectroscopy (EIS) and weight loss techniques. The surface morphology of the MS after its exposure to 1 M HCl solution with and without 400 ppm CFP was examined using scanning electron microscopy (SEM). The value of activation energy (Ea), Arrhenius factor, enthalpy and entropy for the MS corrosion inhibition and the
thermodynamic parameters such as adsorption equilibrium constant (Kads), free energy of adsorption
(Gads0 ), adsorption heat (Hads0 ) and adsorption entropy (Sads0 ) values were calculated and discussed. The adsorption behaviour of CFP is experimentally investigated by contact angle measurement on mild steel surface. The hydrophobic character of MS increased with increasing concentration of CFP. The results showed that CFP performed excellent inhibiting effect for the corrosion of the MS.
Keywords: Kinetic parameters, Adsorption, Corrosion, SEM
1. INTRODUCTION
containing nitrogen, sulphur and oxygen atoms are of growing interest in the field of corrosion and industrial chemistry as corrosion poses serious problem to the service lifetime of alloys used in industry [1-5].
Many corrosion inhibitors used in aqueous heating and cooling systems are generally toxic and generate health hazards. This toxic property limits the field of their applications. However there is a great demand for nontoxic corrosion inhibitors. The development of new corrosion inhibitors of non-toxic type, which do not contain heavy metals and organic phosphates, remains very important [6-9].
[image:2.596.115.482.313.471.2]Cefapirin is the commercial name of (7R)-8-oxo-3-((prop-1-en-2-yloxy) methyl)-7-(pyridine-4-ylthio) acetamido)-5-thia-1-azabicyclo [4, 2, 0] oct-2-ene-2-carboylic acid. It is a broad-spectrum first generation cephalosporin antibiotic.This paper reports the use of electrochemical impedance spectroscopy (EIS), potentiodynamic polarization, weight loss, scanning electron microscopy (SEM) and contact angle measurement to investigate the nature of adsorption of cefapirin (CFP) on mild steel surface. The structure of CFP is shown in Fig. 1.
Figure 1. Structure of cefapirin (CFP) molecule
2. EXPERIMENTAL
2.1. Inhibitor
Stock solution of CFP was made in 10:1 ratio of water: ethanol mixture to ensure solubility. This stock solution was used for all experimental purposes.
2.2. Mild steel sample
2.3. Electrochemical measurements
A three-electrode cell consisting of carbon steel working electrode (WE), a platinum counter electrode (CE) and saturated calomel electrode (SCE) as a reference electrode, was used for electrochemical measurements. All experiments were performed in atmospheric condition without stirring. Prior to the electrochemical measurement, a stabilization period of 30 min was allowed, which was proved to be sufficient to attain a stable value of Ecorr.
The EIS measurements were carried out in a frequency range from 100 kHz to 0.00001 kHz under potentiodynamic conditions, with amplitude of 10 mV peak-to peak, using AC signal at Ecorr.
The potentiodynamic polarization curves were recorded in the potential range of -250 to +250 mV (SCE) with scan rate 1 mV s-1. All potentials were measured against SCE.
2.4. Weight loss measurements
Weight loss experiments were done according to the method described previously [10]. Weight loss measurements were performed at 308 K for 3 h by immersing the mild steel coupons into acid solution (100 mL) without and with various amounts of inhibitors. After the elapsed time, the specimen were taken out, washed, dried and weighed accurately.
The inhibition efficiency (WL%) and surface coverage () was determined by using the following equations:
0 i WL
0
% w w 100
w
(1)
0 i
0
w w
w
(2)
Where, w0 and wi are the weight loss value in the absence and presence of inhibitor.
2.5 Scanning electron microscopy (SEM)
The carbon steel specimens (size 1.0 cm × 1 cm × 0.025 cm) were abraded with emery paper (320 –1200 grade) then were washed with distilled water and acetone. After immersion in 1 M HCl without and with addition of 400 ppm of CFP at 308 K for 3 h, steel specimens were cleaned with distilled water; dried using a cold air blaster, and then the surface was investigated using a Jeol JSM-5400 (SEM).
2.6 Contact angle measurements (static sessile drop method)
remove surface contamination like grease, dust or organic traces that could influence contact angle measurements through surface pinning of the liquid drop and or contamination of the liquid when the latter is put into contact with the sample surface. Aqueous acid solutions with different concentrations of the CFP were prepared and the samples were then immersed into these solutions for 3 h. Upon removal from the solutions, the samples were dried by means of gently nitrogen flow. Contact angle measurements were performed using the static sessile drop method with a Ramé-Hart goniometer (Netcong, USA).
3. RESULTS AND DISCUSSION
3.1 Electrochemical impedance spectroscopy
Impedance method provides information about the kinetics of the electrode processes and simultaneously about the surface properties of the investigated systems.
A B
[image:4.596.70.519.339.688.2]C
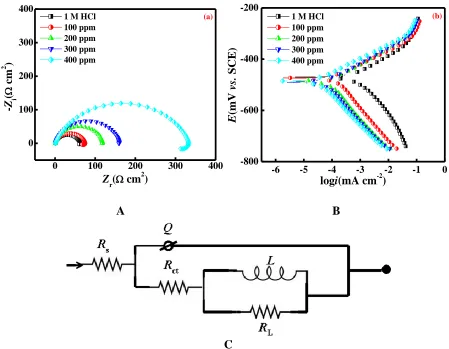
Figure 2. (a) Nyquist plots, (b) Typical polarization curves for corrosion of mild steel in 1 M HCl in the absence and presence of different concentrations of CFP and (c) the electrochemical equivalent circuit used to fit the impedance measurements.
0 100 200 300 400 0
100 200 300 400
(a)
1 M HCl 100 ppm 200 ppm 300 ppm 400 ppm
-Z i
(
cm
2 )
Zr( cm2) -6 -5 -4 -3 -2 -1 0
-800 -600 -400 -200
(b)
E
(mV
vs.
SCE)
logi(mA cm-2)
The shape of impedance gives mechanistic information. The method is widely used for investigation of corrosion inhibition processes [11]. Nyquist plots of mild steel in 1 M HCl solution in the absence and presence of different concentrations of CFP are presented in Fig. 2a. It follows from Fig. 2a that a high frequency (HF) depressed charge-transfer semicircle was observed followed by a well defined inductive loop in the low frequency (LF) regions. The HF semicircle is attributed to the time constant of charge transfer and double-layer capacitance [12, 13]. The LF inductive loop may be attributed to the relaxation process obtained by adsorption species as
-ads
Cl and Hads on the electrode surface [14].
To get more accurate fit of these experimental data, the measured impedance data were analysed by fitting in to equivalent circuit given in Fig. 2c. The equivalent circuit consists of the double-layer capacitance (Cdl) in parallel to the charge transfer resistance (Rct), which is in series to the
parallel of inductive elements (L) and RL. The presence of L in the impedance spectra in the presence
[image:5.596.16.585.376.479.2]of the inhibitor indicates that mild steel is still dissolved by the direct charge transfer at the CFP-adsorbed mild steel surface [15].
Table 1. Electrochemical parameters derived from EIS and potentiodynamic polarization for mild steel in absence and presence of different concentrations of CFP
One constant phase element (CPE) is substituted for the capacitive element to give a more accurate fit, as the obtained capacitive loop is a depressed semi-circle. The depression in Nyquist semicircles is a feature for solid electrodes and often referred to as frequency dispersion and attributed to the roughness and other inhomogenities of the solid electrode [16]. The CPE is a special element whose admittance value is a function of the angular frequency (ω), and whose phase is independent of the frequency. The admittance and impedance of CPE is given by;
n CPE 0( )
Y Y i (3)
where, Y0 is the magnitude of CPE, i is an imaginary number ( 2
1
i ) and n / ( / 2)in which α is the phase angle of CPE.
The point of intersection between the inductive loop and the real axis represents (Rs + Rct). The
electrochemical parameters, including Rs, Rct, RL, L, Y0 and n, obtained from fitting the recorded EIS Inhibitor
conc. (ppm)
Rs (Ω
cm2)
Q (10-6 ×
Ω-1
sn cm-2)
n L
(H)
Rct(Ω
cm2)
RL(Ω
cm2) Rct%
-Ecorr
(mV vs. SCE)
icorr
(μA
cm-2)
ba (mV
dec-1)
bc (mV dec-1) P%
- 1.3 164 0.811 13 16 1 - 469 730 73 127 -
100 0.6 87 0.856 52 65 9 75 475 180 67 164 75
200 1.0 55 0.894 1 117 2 86 489 100 69 162 86
300 1.2 51 0.885 2 158 2 90 492 75 70 145 89
using the electrochemical circuit of Fig. 2c are listed in Table 1. Cdl values derived from CPE
parameters according to equation (4) are listed in Table 1. n 1
dl 0( max)
C Y (4)
where, max is angular frequency (max= 2πfmax) at which the imaginary part of impedance
(-Zi) is maximal and fmax is AC frequency at maximum.
3.2 Potentiodynamic polarization measurements
Polarization measurements were carried out in order to gain knowledge concerning the kinetics of the cathodic and anodic reactions. Fig.2a shows the results of the effect of CFP concentration on the cathodic and anodic polarization curves of mild steel in 1 M HCl, respectively. It could be observed that both the cathodic and anodic reactions were suppressed with the addition of CFP, which suggested that the CFP reduced anodic dissolution and also retarded the hydrogen evolution reaction.
Electrochemical corrosion kinetics parameters, i.e. corrosion potential (Ecorr), cathodic and
anodic Tafel slopes (ba, bc) and corrosion current density (icorr) obtained from the extrapolation of the
[image:6.596.29.577.436.496.2]polarization curves, were given in Table 1.
Table 2. Electrochemical parameters derived from EIS and potentiodynamic polarization for mild steel in absence and presence of different concentrations of CFP
Inhibitor concentration (ppm)
Ea (kJ mol
-1
) λ (mmy-1) *
H
(kJ mol-1) *
S
(J K-1 mol-1)
- 42.21 5.3 × 10⁸ 39.55 -86.75
400 73.69 5.2 × 10¹² 71.04 -10.35
Fig. 2b represents the potentiodynamic polarization curves of mild steel in 1M HCl in the absence and presence of various concentrations of the CFP. It can be seen from the Fig. 2b that, in the presence of inhibitor, the curves are shifted to lower current regions, showing the inhibition tendency of the CFP. There was no definite trend observed in the Ecorr values in the presence of CFP. In the
present study, shift in Ecorr values is in the range of 20-22 mV suggested that CFP acted as mixed type
of inhibitor [17, 18]. The values of various electrochemical parameters derived by Tafel polarization of all the inhibitors are given in Table 1. Investigation of Table 1 revealed that the values of ba change
slightly in the presence of CFP where as more pronounced change occurred in the values of bc,
3.3 Weight loss measurements
3.3.1 Effect of inhibitor concentration
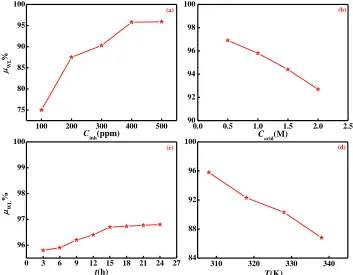
The variation of inhibition efficiency (μWL %) with inhibitor concentration is shown in Fig.3a.
Better inhibition efficiency at higher concentration may be attributed to larger coverage of metal with inhibitor molecules.
3.3.2 Effect of acid concentration
The variation of inhibition efficiency (μWL %) with concentration of acid solution is shown in
Fig.3b. It can be seen that CFP acted as an efficient inhibitor in the studied concentration range.
3.3.3 Effect of immersion time
Fig.3c showed the effect of immersion time (3-24 h) at 308 K on the inhibition efficiency of CFP at 400 ppm concentration. Fig.3c showed that CFP inhibits the corrosion of mild steel for all immersion times. The inhibition efficiency of CFP gradually increased first from 3 to 15 h and thereafter almost constant suggesting the formation of persistent film on the metal surface.
3.3.4 Effect of temperature
100 200 300 400 500
75 80 85 90 95 100
0.0 0.5 1.0 1.5 2.0 2.5
90 92 94 96 98 100
0 3 6 9 12 15 18 21 24 27
96 97 98 99 100
310 320 330 340
84 88 92 96 100
(a)
WL
Cinh(ppm)
(b)
Cacid(M)
(c)
WL
%
t(h)
(d)
T(K)
[image:7.596.121.474.448.723.2]
The values of inhibition efficiencies obtained from weight loss measurement for the optimum concentration of CFP (400 ppm) in 1 M HCl are shown in Fig.3d. The inhibition efficiency of CFP decreased gradually with increasing temperature.
3.3.5 Thermodynamic activation parameters
The dependence of corrosion rate on temperature can be expressed by the Arrhenius equation and transition state equation [20, 21]:
a R
log( ) log
2.303 E C
RT
(5)
* *
R exp exp
RT S H
C
Nh R RT
(6)
where Ea apparent activation energy, the pre-exponential factor, H* the apparent enthalpy of activation, S* the apparent entropy of activation, h Planck’s constant and N the Avogadro number, respectively. The apparent activation energy and pre-exponential factors at 400 ppm concentration of CFP can be calculated by linear regression between logCR and 1/T (Table 2). All the linear regression coefficients are close to 1, indicating that corrosion of mild steel in hydrochloric acid can be explained using the kinetic model.
2.9 3.0 3.1 3.2 3.3
0.0 0.5 1.0 1.5 2.0 2.5
2.9 3.0 3.1 3.2 3.3
-2.5 -2.0 -1.5 -1.0 -0.5 0.0
(a)
1 M HCl 400 ppm
log
C R
(m
m
y
-1 )
[(1/T).103]K-1
(b)
log
C R
/
T
(m
m
y
-1 K -1 )
[(1/T).103]K-1
Figure 4. Arrhenius plots in absence and presence of 400 ppm concentration of CFP for (a) log CR
versus 1/T and (b) log (CR/T) versus 1/T
[image:8.596.73.527.452.628.2]
According to equation [5], corrosion rate (CR) is being effected by both Ea and λ. In general, the influence of Ea on the mild steel corrosion was higher than that of λ on the mild steel corrosion.
However, if the variation in λ was drastically higher than that ofEa, the value of λ might be the dominant factor to determine the mild steel corrosion. In the present case, Ea and λ decreased in the presence of inhibitor (the higher Ea and lower λ led to lower corrosion rate). Hence, it is clear that increment of Ea is the decisive factor affecting the corrosion rate of mild steel in 1 M HCl.
The relationship between log (CR T) and 1T is shown in Fig. 4b. The value of ΔH* and *
ΔS were calculated and presented in Table 2. The positive sign of enthalpy reflect the endothermic nature of steel dissolution process meaning that dissolution of steel is difficult [22].
On comparing the values of the entropy of activation (Δ *
S ) given in Table 2, it is clear that entropy of activation increased in the presence of CFP than in the absence of inhibitor. The increment of Δ *
S reveals that increase in disordering takes place on going from reactant to the activated complex [23].
3.3.6 Adsorption isotherm
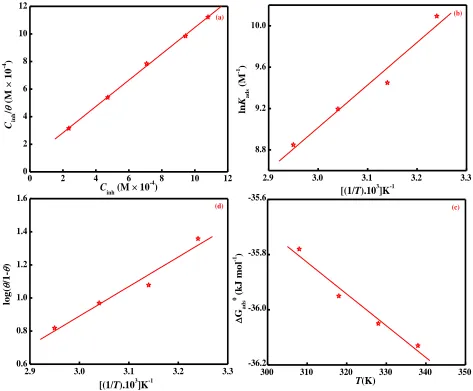
The adsorption on the corroding surfaces never reaches the real equilibrium and tends to reach an adsorption steady state. When corrosion rate is sufficiently decreased in the presence of inhibitor, the adsorption steady state has a tendency to attain quasi-equilibrium state. Now, it is reasonable to consider quasi-equilibrium adsorption in thermodynamics using the appropriate adsorption isotherm. The degree of surface coverage (θ) for the inhibitor was obtained from average weight loss data. Different adsorption isotherms were tested in order to find the best fitted adsorption isotherm for adsorption of CFP on the surface of mild steel from 1 M HCl solution. Since, the linear regression coefficient of Langmuir adsorption isotherm is found more close to unity hence, was found best fit. With regard to the Langmuir adsorption isotherm, the surface coverage (θ) of the inhibitor on the mild steel surface is related to the concentration (Cinh) of the inhibitor in the bulk of the solution according
to the following equation:
ads inh
ads inh
1 K C
K C
(7)
where,Kads is the equilibrium constant for the adsorption/desorption process. This equation can be rearranged to
inh
inh ads
1 C
C K
(8)
From the intercepts of the straight lines on the Cinh -axis (Fig. 5a), Kads can be calculated which is related to free energy of adsorption,Gadsο as given by equation 9.
ο
ads ln (55.5 ads)
G RT K
(9)
The negative values of Gadsο ensure the spontaneity of the adsorption process and stability of the adsorbed film on the mild steel surface [1, 25]. It is usually accepted that the value of Gadsο around -20 kJ mol-1 or lower indicates the electrostatic interaction between charged metal surface and charged organic molecules in the bulk of the solution while those around -40 kJ mol-1 or higher involve charge sharing or charge transfer between the metal surface and organic molecules [26].
0 2 4 6 8 10 12
0 2 4 6 8 10 12
300 310 320 330 340 350
-36.2 -36.0 -35.8 -35.6
2.9 3.0 3.1 3.2 3.3
0.6 0.8 1.0 1.2 1.4 1.6
2.9 3.0 3.1 3.2 3.3
8.8 9.2 9.6 10.0 (a) C in h / ( M × 1 0 -4 )
Cinh (M × 10-4)
(c)
Gad
s
0 (
k J m o l -1 ) T(K) (d) log ( /1- )
[(1/T).103]K-1
(b) ln K ad s ( M -1 )
[image:10.596.60.533.285.676.2][(1/T).103]K-1
Assuming thermodynamic model, corrosion inhibition of mild steel in the presence of CFP can be better explained, therefore, heat of adsorption and entropy of adsorption were calculated.
According to Van’t Hoff equation [27, 28]:
ο ads ads
lnK H constant
RT
(10)
[image:11.596.13.580.319.406.2]To calculate heat of adsorption lnKads was plotted against1/T, as shown in Fig. 5b. The straight lines were obtained with slope equal to (Hadsο R)and intercept equal to( ΔSadsο Rln1/55.5). The calculated values of heat of adsorption and entropy of adsorption are listed in Table 3. Under the experimental conditions, the adsorption heat could be approximately regarded as the standard adsorption heat (Hadsο ).
Table 3. Thermodynamic parameters for the adsorption of CFP on the mild steel at 400 ppm concentration.
Temperature (K) 0 ads G
(kJ mol-1)
Kads
(M × 104
)
* 0 ads
H
(kJ mol-1)
* 0 ads
S
(J K-1 mol-1)
† 0 ads
H
(kJ mol-1)
† 0 ads
S
(J K-1 mol-1)
†† 0 ads
H
(kJ mol-1)
308 -35.78 2.42 -34.37 4.90 -34.21 5.70 5.70
318 -35.95 1.27
328 -36.05 9.86
338 -36.13 6.97
The thermodynamic parameters Hadsο and Sadsο can also be calculated from the following equation:
ο ο ο
ads ads ads
G H T S
(11)
A plot of Gadsο vs. T gave straight line (Fig. 5c) with the slope equal toΔSadsο , and the value of ΔHadsο can be calculated from intercept.
An estimate of heat of adsorption was obtained for the trend of surface coverage with temperature as follows:
ο ads inh
log log log
1 2.303 H A C RT
(12)
A plot of log
1
versus 1/T is given in Fig. 5d. The slope
Hadsο 2.303R
of the graph gives the value of heat of adsorption.
3.4 Scanning electron microscopy
The SEM images of mild steel surfaces are given in Fig. 6 a-c. The inspection of Fig. 6a, which is the micrograph of the mild steel surfaces exposed to 1 M HCl revealed that the specimen surface was strongly damaged in the absence of inhibitor. Fig. 6b showed the SEM image of the mild steel surface exposed to the 1 M HCl with the addition of 400 ppm CFP. There are no pits and cracks observed in the micrograph except polishing lines. The Fig. 6c showed polished mild steel surface.
c
50 m
a
b
cc
50 m
a
50 m
50 m
a
b
Figure 6. (a) Scanning electron micrograph of mild steel surface exposed to free acid solution, (b) scanning electron micrograph of inhibited mild steel (1 M HCl + 400 ppm CFP) and (c) scanning electron micrographs of polished mild steel surface
3.5 Contact angle of acid solution on mild steel surface
[image:12.596.102.497.210.537.2]
0 100 200 300 400 500 10
20 30 40 50 60 70 80
[image:13.596.185.415.68.248.2]Cinh/ppm
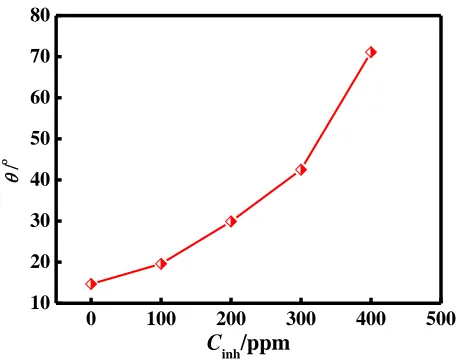
Figure 7. Contact angle, θ, of acid solutions containing different concentrations of CFP on mild steel surface
4. MECHANISM OF INHIBITION
It has been assumed that organic inhibitor molecule establish its inhibition action via the adsorption of the inhibitor onto the metal surface. The adsorption process is affected by the chemical structures of the inhibitors, the nature and charged surface of the metal and the distribution of charge over the whole inhibitor molecule. In general, owing to the complex nature of adsorption and inhibition of a given inhibitor, it is impossible for single adsorption mode between inhibitor and metal surface.
The adsorption and inhibition effect of CFP in HCl solution can be explained as follows: CFP might be protonated in the acid solution as follows:
CFP+ Hx [CFPH ]x x (13)
Thus, in aqueous acidic solutions, the CFP exists either as neutral molecules or in the form of cations (protonated CFP). Generally, two modes of adsorption could be considered. The neutral CFP may be adsorbed on the metal surface via the chemisorption mechanism, involving the displacement of water molecules from the metal surface and the sharing of electrons between the N atoms and iron. The CFP molecules can be also adsorbed on the metal surface on the basis of donor–acceptor interactions between π-electrons of nitrile group and carbonyl group and vacant d-orbital of iron. The dπ- dπ bonds are also formed by the overlap of 3d-electrons of Fe-atom to vacant 3d-orbital of S-atom. In another hand, it is well known that the steel surface has positive charge in acid solution [29], so it is difficult for the protonated CFP to approach the positively charged steel surface (H3O+/metal interface)
5. CONCLUSIONS
(a) CFP was found to be a good inhibitor for mild steel corrosion in acid medium.
(b) The inhibition efficiency of CFP decreased with temperature, which leads to an increase in activation energy of the corrosion process.
(c) EIS results were interpreted using an equivalent circuit in which a constant phase element (CPE) including an inductive element (L) was used in order to give more accurate fit to the experimental results.
(d) Potentiodynamic polarization curves revealed that CFP is a mixed-type inhibitor.
References
1. A. K. Singh, M. A. Quraishi, Corros. Sci. 51 (2009) 2752.
2. A. Popova, E. Sokolova, S. Raisheva, M. Christov, Corros. Sci. 45 (2003) 33 3. A. Popova, M. Christov, A. Vasilev, Corros. Sci. 49 (2007) 3290
4. M. Lebrini, M. Lagrenee, H. Vezin, L. Gengembre, F. Bentiss, Corros. Sci. 47 (2005) 485. 5. Z. A. Chikh, D. Chebabe, A. Dermaj, N. Hajjaji, A. Srhiri, M. F. Montemor, M. G. S. Ferreira, A.
C. Bastos, Corros. Sci. 47 (2005) 447
6. M. A. Quraishi, A. Singh, V. K. Singh, D. K. Yadav, A. K. Singh, Mater. Chem. Phys. 122 (2010) 114.
7. A. K. Singh, M. A. Quraishi, J. Appl. Electrochem. 41 (2011) 7.
8. A. S. Ekop, N. O. Eddy, Australian Journal of Basic and Applied Sciences, 2 (2008) 1258. 9. N. O. Eddy, E. E. Ebenso, Int. J. Electrochem. Sci. 5 (2010) 731.
10.A. K. Singh, M. A. Quraishi, Corros. Sci. 52 (2010) 1529.
11.A. A. Hermas, M. S. Morad, M. H. Wahdan, J. Appl. Electrochem. 34 (2004) 95.
12.C. Deslouis, B. Tribollet, G. Mengoli, M. M. Musiani, J. Appl. Electrochem. 18 (1988) 374. 13.S. S. Abdel Rehim, H. H. Hassan, M. A. Amin, Appl. Surf. Sci., 187 (2002) 279.
14.A. K. Singh, M. A. Quraishi, Corros. Sci. 52 (2010) 1373.
15.A. K. Singh, M. A. Quraishi, J. Appl. Electrochem. 40 (2010) 1293. 16.M. Mahadavian, M. M. Attar, Corros. Sci. 48 (2006) 4152.
17.A. K. Singh, M. A. Quraishi, Corros. Sci. 52 (2010) 152. 18.A. K. Singh, M. A. Quraishi, Corros. Sci. 53 (2011) 1288.
19.A. K. Singh, S. K. Shukla, M. Singh, M. A. Quraishi, Mater. Chem. Phys. 129 (2011) 68. 20.X. Li, L. Tang, Mater. Chem. Phys. 90 (2005) 286.
21.E. A. Noor, A. H. Al-Moubaraki, Mater. Chem. Phys. 110 (2008) 145 22.N. M. Guan, L. Xueming, L. Fei, Mater. Chem. Phys. 86 (2004) 59
23.M. A. Quraishi, I. Ahamad, A. K. Singh, S. K. Shukla, B. Lal, V. Singh, Mater. Chem. Phys. 112 (2008) 1035.
24.L. Tang, X. Li, Y. Si, G. Mu, G.H. Liu, Mater. Chem. Phys. 95 (2006) 26
25.H. Keles, M. Keles, I. Dehri, O. Serindag, Colloids Surf. A: Physicochem. Eng. Aspects 320 (2008) 138
26.F. Bentiss, C. Jama, B. Mernari, H. El Attari, L. El Kadi, M. Lebrini, Mi. Traisnel,M.Lagrenée, Corros. Sci. (2009), doi:10.1016/j.corsci.2009.04.009
27.T. P. Zhao, G. N. Mu, Corros. Sci. 41 (1999) 1937 28.L. Tang, G. Mu, G. Liu, Corros. Sci. 45 (2003) 2252