This is a repository copy of A Comparison of Friction Modifier Performance using Two Laboratory Test Scales.
White Rose Research Online URL for this paper: http://eprints.whiterose.ac.uk/131828/
Version: Accepted Version
Article:
Buckley-Johnstone, L., Harmon, M., Lewis, R. orcid.org/0000-0002-4300-0540 et al. (2 more authors) (Accepted: 2018) A Comparison of Friction Modifier Performance using Two Laboratory Test Scales. Proceedings of the Institution of Mechanical Engineers. Part F: Journal of Rail and Rapid Transit. ISSN 0954-4097 (In Press)
[email protected] https://eprints.whiterose.ac.uk/
Reuse
Items deposited in White Rose Research Online are protected by copyright, with all rights reserved unless indicated otherwise. They may be downloaded and/or printed for private study, or other acts as permitted by national copyright laws. The publisher or other rights holders may allow further reproduction and re-use of the full text version. This is indicated by the licence information on the White Rose Research Online record for the item.
Takedown
If you consider content in White Rose Research Online to be in breach of UK law, please notify us by
1
Article Type: Article
Corresponding Author: Matthew Harmon, Centre for Doctoral Training in
Integrated Tribology, University of Sheffield, United Kingdom
Email: [email protected]
A Comparison of Friction Modifier Performance using Two
Laboratory Test Scales
L. Buckley-Johnstone1, M. Harmon2, R. Lewis2, C. Hardwick3 and R. Stock4
1 Department of Mechanical Engineering, University of Sheffield,United Kingdom
2 Centre for Doctoral Training in Integrated Tribology, University of Sheffield,
United Kingdom
3 L.B. Foster Rail Technologies Ltd, Sheffield, United Kingdom
4 L.B. Foster Rail Technologies Ltd, Burnaby, Canada
Abstract
This paper describes two methods for assessing friction modifier performance carried
out at two different test scales. Study A used wear data from a full-scale rig test at
voestalpine Schienen GmbH [1] and compared it to wear data from twin disc tests
using the SUROS test machine at The University of Sheffield. Study B compared
‘retentivity’ data from a full-scale rig at The University of Sheffield and SUROS tests.
2
assumptions made in the full-scale contact calculation introduce large spread into the
results. There was a greater correlation between the two data sets at more severe
contact conditions. Study B showed a different baseline coefficient of traction
between the two scales and that a longer test length is required to fully evaluate the
‘retention’ of the friction modifier on the full-scale rig. The article expands on a
previous conference presentation [2] on the same subject. Additional information on
the test procedure and test rigs is included here. Surface and sub-surface analysis of
SUROS test samples has also been added. The analysis has shown that applying
friction modifier leads to a similar wear mechanism as for dry contact, but wear is less
severe and there is less subsurface deformation. A discussion describing the
differences in test scales and comparing lab tests to field operation is also included.
Keywords: wheel rail contact, friction modifier, scaling, twin disc testing, wear rate
1
Introduction
Friction modifiers (FM) are used to provide an intermediate coefficient of friction in
the wheel-rail interface, (usually between 0.3-0.4) thereby improving energy
efficiency of the railways by ensuring friction is not too high. The intermediate friction
level will also ensure safe train operation by not compromising traction and braking
of the train. Friction modifiers also produce a positive gradient on creep curves. A
positive gradient on creep curves prevents roll-slip oscillations which can lead to
3
The ability to perform controlled testing of wheel-rail interaction is vital to improve
the understanding of the wheel-rail interface. Under most circumstances, it is
uneconomical to perform testing under fully representative conditions. Access to track
and instrumented rolling stock is limited, expensive and difficult to control, which
leads to the need for representative laboratory tests. There are many different scales
and styles of test facility that exist to allow for representative contact conditions within
controllable environments. These can range from simple table top tribometers through
to full-scale component tests. It is often the case that small-scale test rigs give results
quickly, cheaply, and with more control over parameters than larger, more complex
test rigs. Reducing the complexity of the test rig to gain control over different
parameters is at the expense of accurately portraying the system, which can lead to
differences between results from laboratory and in-service observations.
Understanding the fundamental operating and tribological principles of the system to
be tested is key to designing representative small-scale tests.
The aim of this work was to compare the performance of a water based friction
modifier when subjected to two different scales of laboratory experiments. The two
scales were: 1) twin disc using 47 mm diameter discs; 2) full-scale linear test rig using
a full size wheel (diameter approximately 900 mm). These separate, but comparable,
test regimes have looked at the performance of the FM with respect to wear amounts
and coefficient of traction levels. Study A compared wear and Tγ/A data for dry and
4
evolution, retention and baseline levels where a single application of FM was applied
initially.
2
Background
Top of rail (TOR) FMs are widely used in the North American heavy haul
environment as well as in passenger/transit systems all over the world. There are a
number of different material concepts with regard to materials for TOR application,
which has led to confusion. However, a paper has recently been published [4] which
has clearly defined FMs according to their “drying behaviour” and how to differentiate
them from TOR lubricant materials. FMs are particles suspended in water, which
quickly evaporates in the wheel-rail contact leaving behind solid particles to mix with
the existing third body layer to provide the optimised friction level. Non-drying
materials provide the optimised friction level through a mixed lubrication mechanism
(TOR lubricants and sub-classes). In addition to these two classes, solid stick FM’s
are also available which are applied to the wheel, and provide intermediate friction
levels though similar mechanisms.
The benefits of friction modifiers are well documented. They reduce rolling contact
fatigue (RCF) and wear by reducing lateral forces in curves[3-4], and also lead to a
reduction in noise [5–10]. There are also reductions in low frequency vibrations [10]
(which leads to reduced corrugations and improved ride comfort) and reduced fuel
5
impact of FM’s on track isolation circuits [12] or braking capabilities, which are
important safety aspects of any product to be applied to the rail.
A recent field test using a TOR lubricant (a hybrid material containing water and oil)
[13] showed that the friction coefficient was highly dependent on the amount of TOR
lubricant applied. If too much is applied then the friction coefficient is too low for safe
operation of the train. Additionally, if the amount of TOR lubricant applied is too little
then the friction coefficient is above the desired, intermediate, levels. This supports
the statement that TOR lubricants work in the mixed mode lubrication regime and that
a very close control of application rates is necessary to obtain a desired friction level
[4].
Recent research has focussed on the optimisation of the application of FM’s, i.e. how
much to apply and when, how far down the track the effect lasts and how it interacts
with oxides on the rail [11, 15-16]. Most of the current research has been either field
studies or full-scale rig studies, both of which are costly in terms of time and money.
Therefore, if twin disc test results are shown to provide scalable results, then research
can be carried out at a faster rate and lower cost. This is because small-scale twin disc
rigs can be used to carry out large test programs quickly, meaning many variables can
be tested in a relatively short timeframe. A small number of the most promising results
6
To be able to compare wear data from different test rigs a Tγ/A approach is used. T
refers to the tractive force, γ is the amount of slip in the contact and A is the contact
area. Relating wear to Tγ is an approach widely used to predict the wheel profile
evolution within multi-body dynamic simulations. Originally, it was used as an
empirical wear index as wear is related to the energy lost due to creepage in the
wheel-rail interface [16]. Tγ is divided by the contact area in this work to allow scaling
between small-scale specimens and full-scale test rigs. Whilst using the Tγ/A approach
allows comparisons of the test rigs to be made, how each individual parameter affects
performance cannot be analysed. This approach was first used by Bolton and Clayton
[17] in twin disc tests and has since been used in full-scale tests [18].
3
Test Methodology
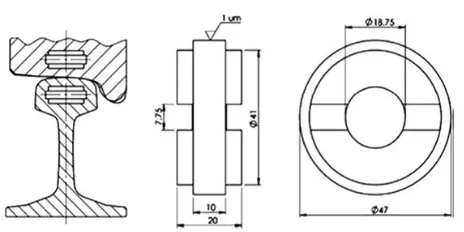
Both studies used the SUROS test rig [15] for the twin disc tests, a schematic of the
rig is shown in Figure 1. The discs are machined from rail and wheel steel with the
dimensions shown in Figure 2. Both studies include results from full-scale rigs. Study
A used data from tests run on the full-scale rolling rig at voestalpine Schienen GmbH
[1] and Study B the full-scale wheel-rail rig at The University of Sheffield shown in
7
[image:8.595.181.413.331.447.2]Figure 1- Schematic of the SUROS twin disk tester
Figure 2- Dimensions of SUROS test specimen
Figure 3- Full-scale test rigs at: left) voestalpine Schienen GmbH [19], right)
[image:8.595.139.458.474.676.2]8
3.1
Study A
Full-scale tests on the voestalpine rig used vertical and lateral loads of 23 tonnes and
4 tonnes, respectively. Full details of the rig’s operation have been previously outlined
[1, 16]. Dry tests were run as well as tests with FM sprayed on to the railhead every
250 wheel passes for a duration of 10,000 wheel passes. A wheel pass is one
movement of the wheel through the test area. The wheel and rail are separated whilst
the rail returns to its starting position so that the wheel is always passing over the test
section in the same direction. Wheel and rail profile measurements were performed
both pre and post-testing using a Greenwood Engineering MiniProf. This allows wear
to be calculated, the difference between the post-test profile and the pre-test profile is
the amount of material lost during the test. From the change in area the weight loss
per cycle was calculated. Creep and traction were not able to be controlled or
measured, so VAMPIRE® simulations and field tribometer measurements were used
when calculating Tγ/A values, with allowances for extremities of conditions, hence
the large error bars presented in the Results section.
The following assumptions have been made to calculate the wear rate for the full-scale
data [19]:
• The contact patch dimensions were generated using the VAMPIRE® Rail
Vehicle Dynamics Software, see Figure 4.
9
• The creep was estimated to be 0.5 %. This value was obtained from evaluating
a creepage distribution vector plot as shown in Figure 5. The creepage plot
was simulated using VAMPIRE® [19].
• The coefficient of friction was assumed to be 0.5-0.6 for dry tests and
0.28-0.35 for FM tests. Friction was not measured during the tests, but the range
specified is typical of coefficient of friction tribometer measurements in the
[image:10.595.200.392.323.491.2]field.
Figure 4- Pressure distribution to approximate conformal contact conditions [19]
[image:10.595.202.400.544.704.2]10
Twin disc tests were performed for which the maximum Hertzian contact pressure
was predicted to be 900 MPa, with creep values ranging from 0-5 % in dry conditions
and with FM. These values were chosen to be representative of wheel tread/rail head
contact. The nominal rail disc speed was set at 400 rpm which gave a surface speed
of 1 m/s. FM was reapplied every 250 cycles. Tests were run for 25,000 cycles where
one cycle is one revolution of the disc.
3.2
Study B
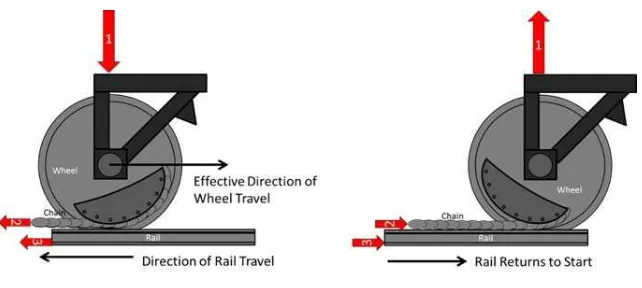
The Sheffield full-scale rig, as shown in Figure 3, comprises of a section of rail on a
slide bed, which can be brought into contact with a fixed-axle-location wheel (nominal
diameter 900 mm), which is free to rotate in bearing housings. Three hydraulic
actuators are used to control the normal load, rail velocity and slip of the contact.
Figure 6 shows a schematic of how the different actuators work. The normal actuator
(1) is set vertically above the wheel, and a ‘pancake’ load cell is used to measure the
applied load. The rail velocity is controlled through a horizontal actuator (3) which
moves the slide bed with the mounted rail - velocity is measured using a linear variable
differential transformer (LVDT). The final actuator is mounted on the slide bed (2),
and is linked, via a chain, to the rim of the wheel. This actuator moves at a set velocity
relative to the slide bed actuator to produce a slippage at the wheel-rail contact. The
force required to produce this relative movement is equal to the frictional force within
11
Figure 6- Full-scale rig diagram
FM was applied evenly to a section of the rail head using a brush. A normal load
application of 86 kN was applied, which equates to a maximum contact pressure of
about 1,500 MPa. Due to limited actuator pressure the rail velocity was restricted to
40 mm/s. The low velocity is one of the main limitations of this test rig when
comparing its operation to field operation. Retention tests were run for 800 wheel
passes with a fixed creep of 2 %. The wheel always travels in the same direction. The
wheel and rail are separated at the end of each pass and the rail returned to its starting
position to begin the next wheel pass.
In the twin disc tests a comparable contact stress was used, 1,500 MPa maximum
Hertzian contact pressure, and tests were run at 2 % slip. Tests were run at a nominal
rail disc speed of 400 rpm, with the driven wheel disc at a higher speed to generate
the slippage. Before testing, 0.1 g of the FM product was evenly applied to the rail
disc only. The traction coefficient was measured over 5,000 cycles of testing for
measurement of a creep curves, and ran with a slippage of 2 % until the traction
12
4
Results
4.1
Study A
Figure 7 shows the traction curves from two twin disc tests at different slip levels with
FM reapplied every 250 passes. It is clear in both graphs that traction levels sharply
drop when FM is reapplied. This could be due to the nature of the product which is
applied wet, after which the contact dries out/is worn away leading to an increase in
traction, although the traction coefficient never reaches the level where it is designed
to operate in (0.3-0.4). Another interesting observation is that during the first few
applications of FM, the maximum traction coefficient decreases. Both of these
observations seen in this twin disc test have been observed previously in other twin
disc research [20]. This type of test is useful in analysing what happens when the FM
is first applied, but it is difficult to draw other conclusions due to it not representing
[image:13.595.143.456.510.692.2]field conditions closely enough.
13
Figure 8 displays wear rate data from previous twin disc tests for dry, wet and grease
conditions [21] with the results from the twin disc FM tests overlaid. It shows that the
FM has a significantly lower wear rate at all slip values tested when compared to other
[image:14.595.148.450.211.416.2]conditions.
Figure 8- Ty/A wear rate data for twin disc tests with different contaminants [22]
Tγ/A versus wear rate for both twin disc and full-scale in both lubrication conditions
is shown in Figure 9. Error bars show the range of values when variation in full-scale
14
Figure 9- Ty/A wear rate data twin-disc/full-scale comparison for dry and applied friction modifier conditions.
It is clear that applying FM significantly reduces the wear rate. The wear rate when
the FM is applied is much higher in the full-scale test than in the twin disc test. This
is because even though the amount of product used was scaled down to be appropriate
for the size of the discs; all of the product on the disc ends up in the contact whereas
on the full-scale rig (FSR) not all the product applied ends up in the contact.
Additionally the size and shape of the contact is different in the two different test rigs.
4.1.1 Surface Appearance
The rail discs from the twin disc results presented in Figure 8 were analysed to show
the differences in wear features. Figure 10 shows surface images of the rail disc after
testing at differing slip levels with FM. A dry comparison for 5 % slip from previous
15
machining marks are still clearly visible indicating low wear. At 5 % slip (Figure 10A)
there are abrasive scratches present, but there are still machining marks visible. There
are also abrasive scratches in the dry (Figure 10B) case, but no machining marks
present, which indicates that the wear is more severe in the dry case. This is due to the
way the friction modifier works. It dries very quickly forming a solid third body layer
on the surface of the discs and leads to a lower traction coefficient compared to a dry
contact. At 10 % slip (Figure 10D) there is larger material loss than the lower slip
levels indicated by the black areas. There are also areas of grey indicating some form
of third body layer is present, likely to be a mixture of dried friction modifier product,
[image:16.595.141.451.376.602.2]oxide and wear debris.
16
4.1.2 Subsurface Morphology
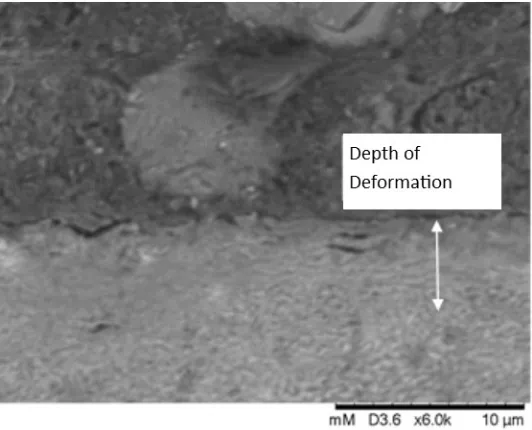
Figure 11 shows the subsurface deformation of the rail disc after testing at 10 % slip
with friction modifier. This depth of deformation is less than 10 μm. This is
considerably less than the depth of deformation in the dry condition reported in
previous work which is a minimum of 420 μm for the conditions tested [21]. The rail
discs were sectioned perpendicular to the rolling direction, polished, and nital solution
[image:17.595.165.431.326.541.2]was applied to show the microstructure.
Figure 11- Subsurface deformation of rail disc after testing with friction modifier 1500MPa, 10% slip
4.2
Study B
Retention curves for FM for both types of testing are shown in Figures 12-13 for twin
disc and full-scale tests respectively. Figure 12 shows a much lower baseline
coefficient of traction than that of the full-scale tests. Figure 13 shows a rapid
17
required to ensure optimum traction. However, the full-scale tests were not run for
long enough to see a return to dry levels of traction, therefore the test should in future
[image:18.595.131.468.191.367.2]be extended until a dry level traction coefficient is reached.
Figure 12- Retention curve for Fm at 2% slip and 1500MPa in a twin-disc test
Figure 13- Retention curve for FM at 2% slip and 1500 MPa in FSR test
The initial evolution of traction and longevity of FM retained in the contact is similar
in both cases. The lower baseline traction coefficient shown in Figure 12 is believed
[image:18.595.153.454.424.596.2]18
of the product ending up in the contact in the twin disc test, whereas in the full-scale
test less FM ends up in the contact.
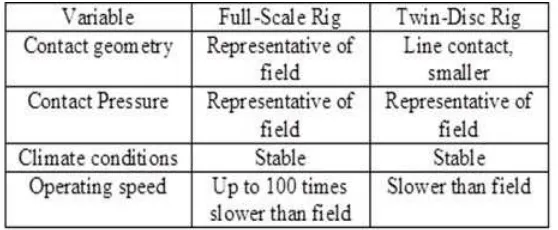
Neither test is completely representative of the field. Table 1 summarises the main
differences between the FSR, twin-disc and field conditions. These differences have
been identified in other published work [22]. For operating speed some twin-disc rigs
could be representative of field operations, however, SUROS is slower than typical
[image:19.595.158.437.322.437.2]field operation.
Table 1- Differences between FSR and twin-disc approach compared to field conditions
There are also a number of differences that affect all lab testing when trying to
replicate field conditions. They are:
• The same wheel contacts the same section of rail whereas in the field a wheel
travels down a long section of ‘fresh’ track. This has an effect on the surface
condition and geometry as well as the temperature of the contact. High
temperatures can build up due to the cyclic reloading of the test specimens and
lack of heat transfer away from the contact (in particular in twin-disc testing).
19
rigs are always the same. Whereas, in the field the steering forces are
constantly changing as a wheelset self-steers during curving.
• The contact point and load is always the same, whereas in the field different
profiled wheels in a variety of worn conditions with different axle loads run
on the same track.
• The longitudinal forces provided by a train’s traction system will vary the slip
level in the contact as the train changes its levels of braking/acceleration. This
will cause changes to the wear and damage mechanisms/rates as the amount
of slip changes. Whereas in lab tests, the longitudinal forces are controlled via
determining the slip level and is kept constant for the duration of the test.
• The environment within the lab is relatively constant when compared to
normal track conditions, which can vary greatly in time and location.
• Contamination of the wheel and rail, for example by leaves, ballast dust etc.,
has not been simulated in these lab tests.
The differences outlined above will result in a discrepancy between actual
performance in the field and performance in the laboratory. However, these
differences (in particular controlling the load and slip level in contact, and only using
one wheel) are necessary in order to simplify the component being tested (in this case
wheel/rail contact). This allows an increase in controllability of the tests in the
laboratory and different parameters investigated (in this case the effect of FM on
20
between the absolute values in the laboratory and the field, the trends and relationships
are expected to be the same.
The ‘retentivity’ measured in these tests, could give an indication of product “carry
down” and how durable it is, i.e., how many wheel passes occur before the effects of
the product are no longer seen. Further work is required to prove these links. Unlike
lubricants [23] there are no ‘certification’ tests to define the performance of a friction
modifier. Therefore, if the ‘retentivity’ is shown to be linked to performance then
these tests could form the basis of an approval process.
5
Conclusions
5.1
Study A
• Taking account of the assumptions made with respect to the full-scale data
(contact patch size, traction coefficient, creepage) it can be said that reasonable
correlation exists between small-scale and full-scale tests.
• For dry contact conditions, it can be seen that the full-scale data sits within the
bounds of the twin disc data (see Figure 9).
• When friction modifier is applied, the full-scale wear rate is higher than in the
twin-disc tests. This is due to proportionally more FM ending up in the contact
21
5.2
Study B
• Absolute/baseline friction coefficients differ between twin disc (0.11) and
full-scale (0.31) tests.
• Evolution of friction modifier traction coefficient shows similarities between
the two test methods used.
• Further testing is needed to fully evaluate the retention in a full-scale contact.
This would be done by increasing the number of cycles until the traction
coefficient reaches 0.5
• The tests described in this paper could be used as a basis to define approval
tests for FM’s, there are currently no standards for approval for these products.
References
[1] R. Stock, D. T. Eadie, D. Elvidge, and K. Oldknow, “Influencing rolling contact fatigue through top of rail friction modifier application - A full scale wheel-rail test rig study,” Wear, Vol. 271, No. 1–2, Elsevier B.V., pp. 134– 142, May 2011.
[2] L. Buckley-Johnstone, M. Harmon, R. Lewis, C. Hardwick, and R. Stock, “Assessment of friction modifiers performance using two different laboratory test-rigs,” Third Int. Conf. Railw. Technol. Res. Dev. Maint., pp. 1–16, 2016.
[3] D. T. Eadie, J. Kalousek, and K. C. Chiddick, “The role of high positive friction (HPF) modifier in the control of short pitch corrugations and related phenomena,” Wear, Vol. 253, No. 1–2, pp. 185–192, Jul. 2002.
22
[5] D. T. Eadie and M. Santoro, “Top-of-rail friction control for curve noise mitigation and corrugation rate reduction,” J. Sound Vib., Vol. 293, pp. 747– 757, 2006.
[6] D. T. Eadie, M. Santoro, and J. Kalousek, “Railway noise and the effect of top of rail liquid friction modifiers: Changes in sound and vibration spectral distributions in curves,” Wear, Vol. 258, No. 7–8, pp. 1148–1155, Mar. 2005.
[7] S. L. Grassie, “Rail corrugation: Advances in measurement, understanding and treatment,” Wear, Vol. 258, No. 7–8, pp. 1224–1234, Mar. 2005.
[8] M. Tomeoka, N. Kabe, M. Tanimoto, E. Miyauchi, and M. Nakata, “Friction control between wheel and rail by means of on-board lubrication,” Wear, Vol. 253, No. 1–2, pp. 124–129, Jul. 2002.
[9] A. Matsumoto et al., “Creep force characteristics between rail and wheel on scaled model,” Wear, Vol. 253, No. 1–2, pp. 199–203, Jul. 2002.
[10] D. T. Eadie, M. Santoro, K. Oldknow, and Y. Oka, “Field studies of the effect of friction modifiers on short pitch corrugation generation in curves,” Wear, Vol. 265, No. 9–10, pp. 1212–1221, Oct. 2008.
[11] K. Chiddick, B. Kerchof, and K. Conn, “Considerations in choosing a top-of-rail (TOR) material,” in AREMA Annual Conference and Exposition, 2014, pp. 1–21.
[12] R. Lewis, E. A. Gallardo, J. Cotter, and D. T. Eadie, “The effect of friction modifiers on wheel/rail isolation,” Wear, Vol. 271, No. 1–2, pp. 71–77, May 2011.
[13] J. Lundberg, M. Rantatalo, C. Wanhainen, and J. Casselgren, “Measurements of friction coefficients between rails lubricated with a friction modifier and the wheels of an IORE locomotive during real working conditions,” Wear, Vol. 324–325, No. 1, pp. 109–117, Feb. 2015.
[14] X. Lu, J. Cotter, and D. T. Eadie, “Laboratory study of the tribological properties of friction modifier thin films for friction control at the wheel/rail interface,” Wear, Vol. 259, No. 7–12, pp. 1262–1269, Jul. 2005.
[15] D. I. Fletcher and J. H. Beynon, “Development of a machine for closely controlled rolling contact fatigue and wear testing,” J. Test. Eval., Vol. 28, No. 4, p. 267, 2000.
23
[17] P. J. Bolton and P. Clayton, “Rolling-sliding wear damage in rail and tyre steels,” Wear, Vol. 93, No. 2, pp. 145–165, Dec. 1984.
[18] I. J. McEwen and R. F. Harvey, “Full-scale wheel-on-rail testing: comparisons with service wear and a developing theoretical predictive model,” Lubr. Eng., Vol. 41, No. 2, pp. 80–88, 1985.
[19] D. T. Eadie et al., “The effects of top of rail friction modifier on wear and rolling contact fatigue: Full-scale rail-wheel test rig evaluation, analysis and modelling,” Wear, Vol. 265, No. 9–10, pp. 1222–1230, Oct. 2008.
[20] K. Matsumoto et al., “The optimum design of an onboard friction control system between wheel and rail in a railway system for improved curving negotiation,” Veh. Syst. Dyn., Vol. 44, No. sup1, pp. 531–540, 2006.
[21] C. Hardwick, R. Lewis, and D. T. Eadie, “Wheel and rail wear-Understanding the effects of water and grease,” Wear, Vol. 314, No. 1–2, pp. 198–204, Jun. 2014.
[22] R. Stock, D. Eadie, and K. Oldknow, “Rail grade selection and friction management: a combined approach for optimising rail-wheel contact,” Ironmak. Steelmak., Vol. 40, No. 2, pp. 108–114, 2013.
![Figure 4- Pressure distribution to approximate conformal contact conditions [19]](https://thumb-us.123doks.com/thumbv2/123dok_us/1918234.150769/10.595.202.400.544.704/figure-pressure-distribution-to-approximate-conformal-contact-conditions.webp)

![Figure 8- Ty/A wear rate data for twin disc tests with different contaminants [22]](https://thumb-us.123doks.com/thumbv2/123dok_us/1918234.150769/14.595.148.450.211.416/figure-wear-rate-data-twin-tests-different-contaminants.webp)