871
Bubble Mapping Method for Transient Taylor Bubble Flows
S Iacovides, M Wang*, Q Wang
School of Chemical and Process Engineering, University of Leeds, Leeds, UK
*Email: [email protected]
ABSTRACT
The phenomenon of Taylor bubbles is usually created in gas-liquid flows and is commonly found in many chemical and process industries. Therefore, the visualisation and understanding of their flow dynamics is of crucial importance for the industries. Electrical Resistance Tomography (ERT) is generally used as non-intrusive method for the visualisation of multiphase flows. However, due to its low spatial resolution, the sharp interfaces as well as the small bubbles are not able to be seen. A newly established method, called bubble mapping, enables three-dimensional visualisation of gas bubble size and distribution in gas-water flows. Bubble mapping (BM) is based on the transformation of the cross-sectional gas concentration tomograms to air bubbles. This paper specialises on the visualisation of the Taylor bubble and its dynamic transient. Taylor bubble has been generated using the University of Leeds facilities by applying low water superficial velocity and gas. Tomograms containing Taylor bubble and bubble transient are captured with ERT sensors. Based on the conductivity difference between water and gas, the bubble can be visualised. The performance of the bubble mapping method for visualise the size and shape of the Taylor bubble, as well as bubble flow dynamics, were explored, providing this potential to examine and reveal the transient dynamics of two phase flow in an opaque pipe.
Keywords Electrical Tomography, Taylor bubble, Visualisation, Transient Dynamics
Industrial Application Oil and gas
1 INTRODUCTION
Multiphase flow can be simply defined as every mixture which contains more than one distinct phase flowing simultaneously in a system (Yeon & Tu, 2010). Such flows are very common in petroleum industries as well as in many other industries including pharmaceutical and food (NelTechnology). The dynamics of a multiphase flow in an industrial setting are highly important as they determine optimal design parameters and operational conditions (Wang et al., 2016). Hence, multiphase flow characteristics are typical of vital importance. Visualisation can provide an understanding of the flow dynamics for safety, production and process quality.
872
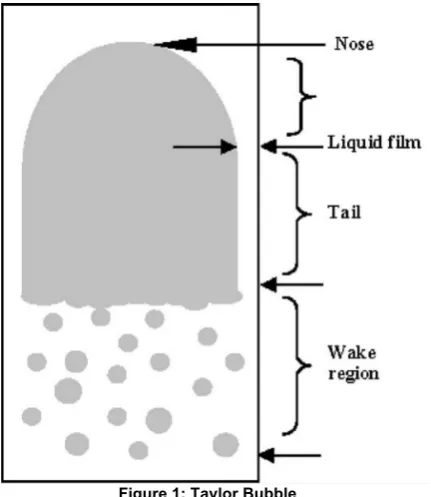
Figure 1: Taylor Bubble
Electrical Resistance Tomography (ERT) is a non-intrusive technique which in its simplest form can be used to produce a two-dimensional (2D) visualisation. For the visualisation of a multiphase flows several interpretation methods are used, including colour mapping and surface extraction. However these methods provide limited flow feature data.
A novel Bubble Mapping method can exploit ERT tomogram data to generate 3D images of multiphase flows to enhance visibility of flow features. This technique allows visualisation of various flow patterns for both vertical and horizontal pipes (Wang et al., 2017). In contrast with other techniques, it is able to reveal the small bubbles which are distributed and large bubbles with distinctive boundary in a water continuous phase of the flow. The Bubble Mapping method is able to define objects larger than 5% of the vessel size. It is based on look up tables (LUT) indexed by bubble distribution and size with a surface generating algorithm.
The first step of this new approach is to filter the data to reduce measurement noise. The spatial information is analysed to give the size of the small bubbles, and temporal information gives the superficial velocity of the gas phase; and shows data acquisition speed. For accurate visualisation, both spatial and temporal limits are used to define the dimensions of an interrogation Cell (IC) which defines bounds for the corresponding LUT. This is used to identify small bubbles based on the translation of values which fully or partially occupy an IC. Threshold numbers are used for the calculations. In the case where the gas volume fraction is more that 40% in an IC then a large bubble is assumed. When is less than 5%, it assumed to be due to noise and ignored. When small bubbles are identified, their size is estimated and position revealed.
The next step is to integrate neighbouring bubbles and to form estimated large bubbles. When a cluster of cells with high gas is identified, this is interpreted as a large bubble and it’s boundary is defined. The final stage of the method is the synthesis of a 3-Dimensional image. A comparison of a High-Speed camera view, the corresponding Colour Mapping image, and the image from the Bubble Mapping method, from is illustrated in Figure 2 (Wang et al, 2016).
873
Figure 2: Comparison for High-Speed camera, Colour Mapping method and Bubble Mapping method for multiphase flow visualisation (Wang et al, 2016).
The main aim of this research is to visualise 3D Taylor bubbles and transient dynamics using the bubble mapping method.
2 EXPERIMENTAL METHODOLOGY
The experimental process was conducted with two steps. Firstly, the evaluation of the software capability by revealing horizonal and vertical flow regimes. Existing flow data used with the Bubble mapping method and comparing them with the expected flow regimes according to the defined flow regimes maps. Secondly, a new test was conducted focusing on revealing the Taylor bubble formation.
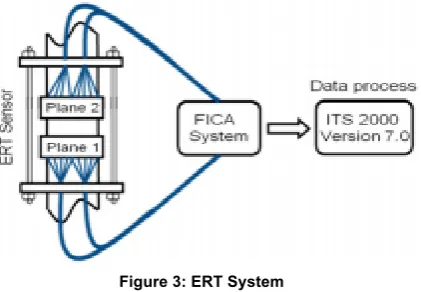
The ERT system used in the study consisted of a dual plane sensor, a data acquisition and software to export the data, as illustrated in Figure 3. The two planes of the ERT sensor have a separation of 0.05m each with 16 stainless steel electrodes distributed peripherally. Cross sectional images were produced by the ERT system, which represents the electrical conductivity of the flow in the cross section of pipe. ERT measurements were collected using the FICA tomography system, able to provide tomograms at up to 800 frames/s (Wang et al, 2005). The resulting tomograms were exported to form the primary data for the study using ITS P2000 data process software (Industrial Tomography Systems, 2005).
Figure 3: ERT System
Concentration distribution tomograms from previous studies at the National Engineering Laboratory (NEL) at Glasgow, were used to evaluate the capability of the Bubble Mapping method in visualising multiphase flows. Data from various flow regimes in the previous test matrix were chosen for the study. The following data is used for the Bubble Mapping trials:
• Start frame of the visualisation.
• Total frames required to be visualised.
• DAS; ERT system frames rate (e.g. 125 frames/s). • Water threshold value, 0.05.
[image:3.595.211.422.501.647.2]874
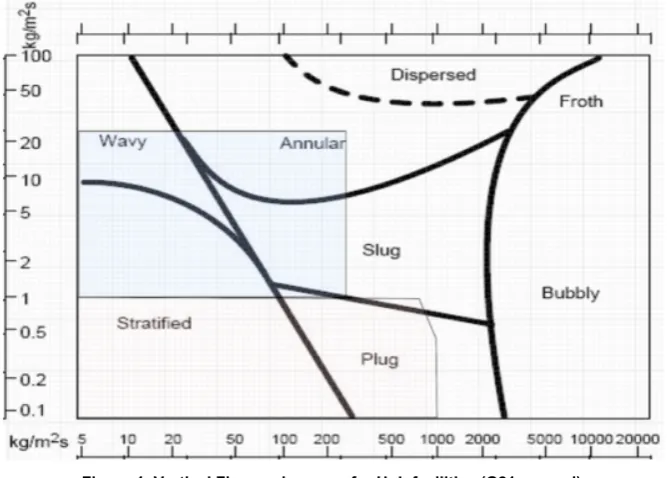
Figure 4: Vertical Flow regime map for UoL facilities (G21 manual)
The test matrix used was based room temperature values of water density of 997 kg/m3 and air density 1.225 kg/m3. Five tests were used with conditions shown in Table 1 to obtain a fully
[image:4.595.81.532.552.633.2]developed Taylor bubble.
Table 1: Test Matrices of the experiment done
Water Superficial Velocity (m/s) Gas Superficial Velocity (m/s)
1 0.010 0.067
2 0.024 0.067
3 0.077 0.067
4 0.071 0.051
5 0.084 0.084
3 RESULTS - ANALYSIS
3.1. Evaluation of bubble mapping method875
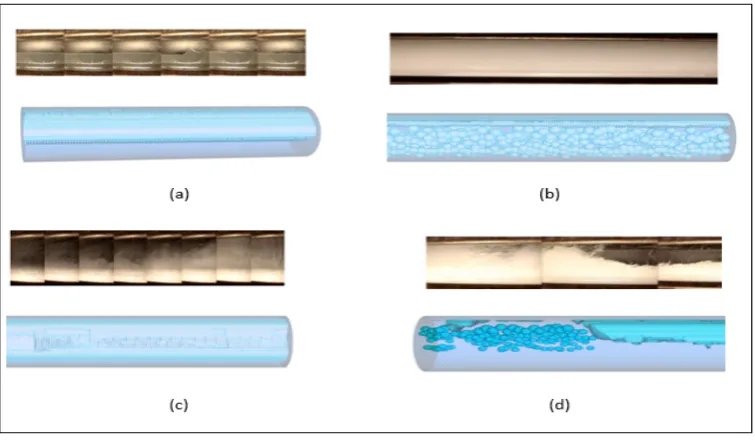
Figure 5: Visualization of horizontal flow regimes by Bubble Mapping Method (a) stratified, (b) bubbly, (c) annular and (d) slug flow
[image:5.595.177.447.382.626.2]Figure 6 illustrates the images extracted for the vertical pipe. As this figure shows, the (a) bubbly, (b) slug (c) plug and (d) annular flow regimes have been successfully visualised in a 3D form. Based on the text matrix of each data and the photographic recording during the experiments, the accuracy of this method has been therefore confirmed.
Figure 6: Visualization of vertical flow regimes by Bubble mapping Method. (a) bubbly, (b) slug (c) plug and (d) annular flow
3.2 Tayor bubble visualisation and formation
876
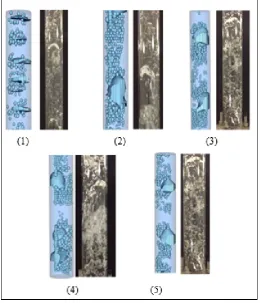
Figure 2: Generation and Visualisation of the Taylor bubble
In order to confirm once more that the bubble mapping has been visualised accurately, the mean gas concentration has been exported for certain number of frames which have been visualised during the experiment as Figure 8 shows.
Figure 3: Comparison of the exported image with the mean gas concentration graph.
[image:6.595.123.484.450.646.2]877
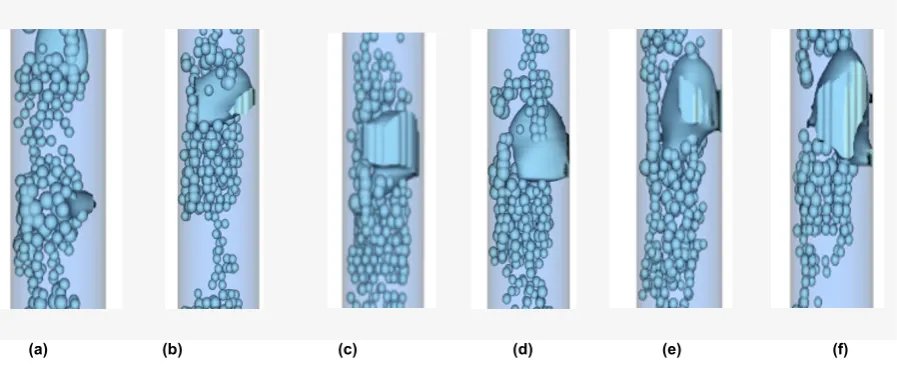
[image:7.595.89.538.72.258.2](a) (b) (c) (d) (e) (f) Figure 4: Transient dynamics of Taylor bubble
For the generation of the body of the Taylor bubble, the drag and the buoyancy forces are the forces affecting the shape and the velocity of the bubble. As the bubble starts to develop, as shown in Figure 9 (c), the bubbles in front of the Taylor bubble are coming together This is due to the increasing velocity of the Taylor bubble which occurs due to its high buoyancy force. The bubble swarming continues to occur as the Taylor bubble moves upward to the pipe as Figures 9 (e), (f) and (g) reveal. Finally, a fully develop Taylor bubble is generated. The tail and the wake of the bubble which are clearly shown on Figure 9 (g) are generated as a result of the backflow which occurs due to drag force which drags the liquid downwards at the area of the body of the Taylor bubble.
4 CONCLUSIONS
The understanding of Taylor bubbles is important in industries due to pressure drop and possible subsequent damage to a plant. The visualisation of multiphases flows in an opaque environment is important since transparent pipes are difficult to be installed in industries whilst the fluids used are mostly blur. Using Electrical Resistance Tomography (ERT) and a new methodology for data processing, called Bubble Mapping, a clear image of the transient dynamics of the taylor bubble has been visualised for the first time ever. The combination of these methods overcome, the ERT’s main limitation of low spatial resolution. Using the flow loop of the University of Leeds, a Taylor bubble has been generated by subsequently achieving its successful visualisation, for the first time in an opaque pipe. This article expresses in detail how the Taylor bubble has been generated and visualised on a step by step process with tomograms. The visualisation of its transisient dynamics reveals how the drag and byoyancy forces applied during the formation of a fully developed Taylor Bubble. The visualisation of a taylor bubble is therefore now possible and is expected to provide a solution to several industries as this can prevent potential plant damages.
REFERENCES
ITS-Industrial Tomography Systems,2005: P2000 Electical resistance Tomogtaphy System ITS 2000 version 5.0 Software. Operating Manual [Accessed 1 April] Available from: http://www.leeds.ac.uk/olil/pdfs/P2000ManualDec2005.pdf
MANDAL, T., DAS, G., & DAS, P. (2009). Liquid Taylor Bubbles Rising in a Vertical Column of a Heavier Liquid: an Approximate Analysis. Journal of Fluids Engineeting. [Online] 131(1) [Accessed 20 March] Avainable from:
http://fluidsengineering.asmedigitalcollection.asme.org/article.aspx?articleid=1478214
878