Early post operative serum growth hormone levels as a
predictor of outcome after surgery for growth hormone (GH)
secreting pituitary adenoma.
DEPARTMENT OF NEUROLOGICAL SCIENCES CHRISTIAN MEDICAL COLLEGE
VELLORE
CERTIFICATE
This is to certify that the dissertation titled “Early post operative serum growth hormone levels as a predictor of outcome after surgery for growth hormone (GH) secreting
pituitary adenoma” is the bonafide original work of Dr. Pratheesh. R. submitted in partial fulfillment of the rules and regulations, for Branch-II M.Ch. Neurosurgery, Part-III examination of the Tamil Nadu Dr. M.G.R. Medical University to be held in February 2009.
Signature of the Guide Dr. Ari G. Chacko
Professor of Neurosurgery
Department of Neurological Sciences Christian Medical College
ACKNOWLEDGEMENT
I would like to express my gratitude to all those who gave me the possibility to complete this thesis.
I am deeply indebted to my guide, Prof. Dr. Ari. G. Chacko for his stimulating
suggestions and encouragement, which helped me in this study and writing of this thesis. I would also like to thank Dr. Geeta Chacko, Professor and Head, Neuropathology, for her valuable suggestions and support.
A special note of thanks to Miss. Pearline, CHTC, for helping me out with the statistics.
Table of contents
Page. No.
1. List of figures……….. 5
2. List of tables………. 7
3. Aim……… 8
4. Introduction………. 9
5. Literature review……… 20
6. Materials and Methods……….. 49
7. Results………. 52
8. Case reports……… 67
9. Discussion……… 87
10. Recommendations………. 97
11. References………. 98
List of figures
Figure Legends
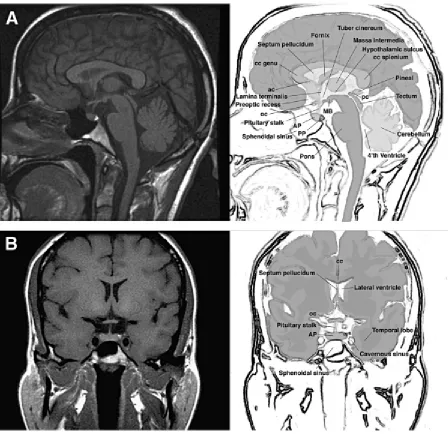
1. Normal anatomy of the human hypothalamic- pituitary unit in sagittal (A) and coronal planes (B).
2. Graph showing log (serial intraoperative GH measurements) versus time 3. Bar diagram showing distribution of microadenomas and macroadenomas 4. 1st postoperative day basal GH level vs. Remission.
5. 7th postoperative day suppressed GH level vs. Remission. 6. Bar diagram comparing remission rates based on size.
7. Bar diagram comparing remission rates based on preoperative GH level. 8. Flowchart showing the various treatment modalities used in the treatment of acromegaly.
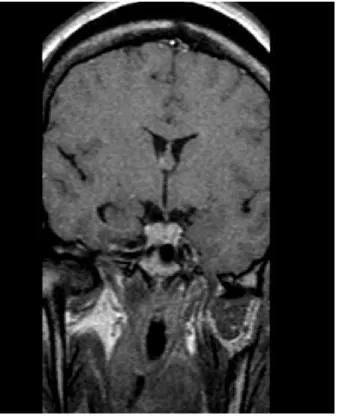
9. MRI (Patient 1)
10. Temporal profile of GH level (Patient 1) 11. MRI (Patient 2)
12. Temporal profile of GH level (Patient 2) 13. MRI (Patient 3)
14. MRI (Patient 3)
15. Temporal profile of GH level (Patient 3) 16. MRI (Patient 4)
17. MRI (Patient 4)
19. MRI (Patient 5)
20. Temporal profile of GH level (Patient 5) 21. MRI (Patient 6)
22. Temporal profile of GH level (Patient 6)
List of Tables
Table Legend 1. Clinical features of acromegaly
2. Surgical results in literature for acromegaly 3. Various treatment modalities in acromegaly.
AIM
To evaluate the prognostic value of early post operative GH measurements with regards to remission of the disease after surgery for GH secreting pituitary adenomas.
INTRODUCTION
Anatomy and physiology
The pituitary (Figure 1) is a bean-shaped gland located at the base of the brain in the midline. It measures 0.6 cm x 0.9 cm x 1.3 cm and an average gland weighs 0.6 grams. The gland lies within the bony sella turcica. The pituitary is composed of two anatomically and functionally distinct parts: the neurohypophysis and the adenohypophysis.
The neurohypophysis is composed of the infundibulum, the pituitary stalk, and the pars nervosa of the pituitary. The cell types of the neurohypophysis include pituicytes, which are modified glial cells, and the axonal processes of neurons whose cell bodies are located in the hypothalamus. The neurohypophysis stores and releases the hypothalamic hormones oxytocin and vasopressin.
The adenohypophysis is of ectodermal origin, embryologically derived from Rathke's pouch. It has three regions, the pars distalis or anterior lobe, the pars intermedia or intermediate lobe and the pars tuberalis, an extension of epithelium that wraps around the infundibulum of the pituitary stalk.
factors that determine hormone production are transcription factors that target specific hormone genes. Somatotrophs, lactotrophs, mammosomatotrophs, and thyrotrophs all derive from growth hormone (GH)-producing precursors.
GH-producing somatotrophs are located in the lateral wings of the anterior pituitary and account for approximately 50% of the cell population. By light microscopy they are strongly acidophilic cells with centrally located nuclei and diffuse cytoplasmic positivity for GH. Mammosomatroph cells expressing both prolactin and GH arise from the acidophilic stem cell and immunostain mainly for prolactin.
The pituitary receives its vascular supply from the superior, middle, and inferior hypophyseal arteries, all of which originate from the internal carotid arteries.
Growth Hormone and Insulin-like Growth Factor-1
adipocytes where it induces the break down of triglycerides and suppresses the reuptake and accumulation of lipids. GH secretion is further regulated by its target growth factor, IGF-I, which participates in a hypothalamic pituitary peripheral regulatory feedback system. GH stimulates IGF-I, which exerts a negative-feedback effect on the hypothalamus and pituitary. IGF-I stimulates hypothalamic SRIF release and inhibits pituitary GH gene transcription and secretion.
Acromegaly
In 1886, Pierre Marie (1) published the first clinical description of disordered somatic growth and proportion and proposed the name acromegaly. Cushing, Davidoff, and Bailey (2, 3) documented the clinicopathologic features of acromegaly and demonstrated clinical remission of soft tissue signs after adenoma resection. The prevalence of acromegaly is estimated to range from 38 to 69 cases/million, and the annual incidence of new patients is 3 or 4 per million (4). Acromegaly is caused by pituitary tumors secreting GH or very rarely by extrapituitary disorders. GH secreting pituitary adenomas constitute 10% of all pituitary tumors (5). Regardless of the etiology, the disease is characterized by elevated levels of GH and IGF-I, with resultant signs and symptoms of hypersomatotrophism.
Feedback loops involve both GH and IGF-1 that have inhibitory autocrine effects on the pituitary and hypothalamus. In acromegaly, GH hypersecretion from pituitary adenomas and rarely from ectopic sources in some malignant tumors continues unchecked since these inhibitory feedback loops are non-functional.
adenomas are composed of distinct somatotrophs expressing GH and lactotrophs expressing PRL. Monomorphous acidophil stem cell adenomas arise from the common GH and PRL stem cell and also often contain giant mitochondria and misplaced GH granule exocytosis. They grow rapidly, are invasive, and manifest with predominant features of hyperprolactinemia (8).
Manifestations of acromegaly are caused by either central pressure effects of the pituitary mass or peripheral actions of excess GH and IGF-I. Central features of the expanding pituitary mass are common to all pituitary masses. In acromegaly, headache is often severe and debilitating. Local signs are especially important presenting features because a higher preponderance of macroadenomas (>65%) is encountered in acromegaly, as compared to mostly microadenomas for PRL-secreting tumors (9). The clinical features are summarized in Table 1.
Table -1
CLINICAL FEATURES OF ACROMEGALY
LOCAL TUMOR EFFECTS Cranial nerve palsy Headache
Pituitary enlargement Visual field defects SOMATIC EFFECTS Acral Enlargement
Thickness of hand and feet soft tissue Cardiovascular
Asymmetric septal hypertrophy Cardiomyopathy
Congestive heart failure Hypertension
Left-ventricular hypertrophy Colon
Polyps
Acroparesthesia
Arthralgias and arthritis Carpal tunnel syndrome Gigantism
Hypertrophy of frontal bones Jaw malocclusion
Prognathism
Proximal myopathy Pulmonary
Narcolepsy
Sleep apnea—central and obstructive Sleep disturbances
Skin
Hyperhidrosis Oiliness Skin tags
VISCEROMEGALY Kidney
Salivary gland Spleen
Thyroid Tongue
ENDOCRINE AND METABOLIC EFFECTS Carbohydrate
Diabetes mellitus
Impaired glucose tolerance
Insulin resistance and hyperinsulinemia Electrolytes
Increased aldosterone Low renin
Lipids
Hypertriglyceridemia Minerals
Hypercalciuria, increased 1,25(OH)2D3
Urinary hydroxproline
Pancreatic islet cell tumors Reproduction
Decreased libido, impotence, low sex hormone–binding globulin Galactorrhea
Menstrual abnormalities Thyroid
Goiter
LITERATURE REVIEW:
Clinical, biochemical and radiological diagnosis
The diagnosis of acromegaly is usually made clinically on the history and typical external appearance. GH and IGF-1 levels are elevated in acromegaly (15). In contrast to GH levels, plasma levels of IGF-I are more stable, and an elevated IGF-I level in a patient with appropriate clinical suspicion is almost always indicative of acromegaly(16). For accurate control comparison, the IGF-I level must be age and gender matched.
When growth hormone is measured in healthy persons with the use of standard assays, the level is usually undetectable (<0.2 µg per liter throughout most of the day), but
there are approximately 10 intermittent pulses of growth hormone per 24 hours, most often at night, when the level can be as high as 30 µg per liter(19). In normal individuals GH suppression occurs after a glucose load. Improved assays with increased sensitivity have suggested that serum GH levels should normally be suppressed following an oral glucose load to less than 0.057 ng/mL in men and less than 0.71 ng/mL in women (20). Freda et al (21) showed that in normal subjects the nadir GH level after a glucose load is less than 0.14 ng/ml. The exact mechanism is not known but it is considered to be due to somatostatin release in response to glucose load. In acromegaly the basal GH levels are elevated and there is failure of GH suppression after an oral glucose load. This response is due to impaired somatostatin response or tumoral resistance to suppression by somatostatin (22). Post glucose suppression GH levels increase in one third of patients, remain unchanged in one third, or fall modestly in one third (23, 24). The following are the criteria defining diagnosis of acromegaly (25) as proposed by the consensus statement in 2000.
Random GH< 0.4 ug/l and normal IGF-1, excludes acromegaly
Following a clinical and biochemical diagnosis of acromegaly, magnetic resonance imaging studies confirm the presence of a pituitary adenoma that is then classified as micro- or macro when they are <10 or >10 mm in maximum diameter. MRI (26) is excellent in determining tumor invasion into the sphenoid sinus or cavernous sinuses and encasement of the internal carotid arteries all of which are factors that limit the extent of resection.
PATHOLOGY AND CLINICAL CORRELATION
The classification of GH adenomas into sparsely granulated (SG) and densely granulated (DG) types has been discussed earlier. Yamada et al (27) compared the clinical and endocrinological characteristics, neuroimaging findings, surgical outcome, and conventional histological findings (including immunohistochemistry) with the electron microscopic appearance of 31 growth hormone (GH)-producing adenomas. Sparsely granulated adenomas were found to more frequently affect younger women and also were more likely to be macroadenomas and invasive. The authors did not find any significant difference in the basal serum GH and insulin-like growth factor I levels. Light microscopy showed that densely granulated adenomas were mainly acidophilic and were immunopositive not only for GH but also for prolactin , the beta subunit of thyroid-stimulating hormone and the alpha subunit of glycoprotein hormone, whereas SG
adenomas were almost all chromophobic and only revealed immunopositivity for
Obari et al (29) in a study on 104 GH cell adenomas found that sparsely granulated variant was associated with younger age, higher frequency of macroadenomas and were more invasive.
MORTALITY RATES IN ACROMEGALY
Patients with biochemically uncontrolled acromegaly perform significantly worse on health related quality of life questionnaires than those in remission or discordant remission status (31).
CARDIAC DISEASE
Symptomatic cardiac disease is present in about 20% of patients and is a major cause of morbidity and mortality (32). Hypertension is present in about 50% of patients with active acromegaly, and half of these have evidence of left ventricular dysfunction. Cardiovascular disease accounts for about 60% of deaths in patients with acromegaly, and the presence of cardiovascular disease at the time of diagnosis portends high mortality rates, despite improved cardiac function after effective GH and IGF-I control.
CANCER
to GH levels, rather than enhanced incidence of the disease in acromegaly. Cardiovascular disease, respiratory disorders, diabetes, and malignancy account for enhanced (threefold) mortality in acromegaly (32, 35). In 194 patients with acromegaly, life expectancy was reduced, and cardiovascular disorders accounted for 24% of deaths, followed by respiratory (18%) and cerebrovascular disease (14%).
Diabetes mellitus, occurring in 20% of patients, was associated with 2.5 times the predicted mortality, and hypertension was present in about half of all patients. (36)
WHAT DECIDES CRITERIA FOR CURE?
despite treatment but the standard mortality rate (SMR: ratio between observed and expected number of deaths) can be normalized by achieving serum GH concentrations less than 1 to 2 micrograms/ml and by normalizing IGF-1 levels. One drawback of this study, is that the majority of patients received pituitary radiation as part of their treatment and this is likely to have contributed to the hypopituitarism seen in the treated group and may be a confounding factor in the analysis. Interestingly, Lindholm et al (43) recently showed that pituitary insufficiency after surgery for nonfunctional pituitary adenomas had no effect on mortality in men but the SMR was significantly higher in women. They speculate that the difference was likely to be due to insufficient gonadal replacements in women. The effect of radiotherapy on mortality in acromegaly was also highlighted by Ayuk et al (42) who found that even after controlling for GH levels, patients who underwent radiation had increased mortality with cerebrovascular disease being the predominant cause of death. These authors also found that younger patients may be at greater risk with persistent disease than older patients but that raised IGF-1 levels did not adequately predict mortality.
PREDICTORS OF CURE:
Valdemarsson et al (99) looked at the role of intraoperative GH levels in predicting long term of pituitary surgery. Venous blood samples for GH were drawn at the beginning of the operation and then intraoperatively, when the surgeon considered the tumour to have been removed (= 0min); and then 10, 20, 30, 40, 60, 90, 120 and 180min. To calculate a mean early postoperative GH level 5-7 blood samples were drawn on the 7th post operative day after surgery. The t 1/2 GH (Figure 2) was calculated from the intraoperative blood samples drawn at 0, 10, 20, 30 and 40min. Growth hormone elimination was assumed to follow first order kinetics and the slope of the graph between time and serum GH level was used to calculate the half life of GH. A calculated GH half life of <31 min had a positive predictive value of 72%. However they found that mean post operative GH at one week had a predictive value of 100% when <2.6 ng/ml. Another paper published by the same group (100) showed that a mean serum GH level of < 2 ng/ml sampled within the first postoperative week was found to have 77% specificity and a predictive value at 97% for a satisfactory effect with regard to the outcome of the operation as evaluated 3 months later (the definition of cure being post glucose suppression GH level of < 2 ng/ml or a normalized IGF-1).
10min
20min
40min
Time (minutes)
ln
(G
H
conc
e
n
tr
a
tion ng
/m
l)
(8ng/ml) (4ng/ml) (2ng/ml)10min
20min
40min
Time (minutes)
ln
(G
H
conc
e
n
tr
a
tion ng
/m
l)
(8ng/ml) (4ng/ml) (2ng/ml)Similarly Osman et al (94) found that a minimum GH of < or = 2 mU/l during an OGTT (oral glucose tolerance test) was achieved in 67.4% of patients with intrasellar tumours, compared with 27.3% with extrasellar tumours.
Kaltsas et al (95) showed that patients who achieved remission had significantly lower preoperative mean GH levels than patients who were not cured (median, 31 mU/L vs. 78.5 mU/L, P < 0.01).
De et al (53) showed that if the preoperative GH level was < 10 ng/ml then there was 86% chance of remission. Similarly Shimon et al (39) in their study showed only a 20% chance of remission if the preoperative GH level was more than 50 ng/ml.
Shimon et al preop GH > 50 ng/ml only 20% chance for remission.
Ahmed at al (48) and Lissett et al (59) demonstrated significant increase in the remission rates over time with increase in the surgeon’s experience.
Studies that looked at electron microscopy features of growth hormone adenomas found that sparsely granulated adenomas were more invasive and had lower surgical cure rates (27, 29). Densely granulated growth hormone adenomas were also found to be more responsive to octreotide treatment (28).
The post operative factors which have been evaluated, include growth hormone levels and IGF-1 levels for assessing disease response to surgery and predicting long term remission. Most studies have used basal/random GH values as an indicator of disease activity and the response to surgery (40, 63, 67, 94, 97, and 98).
Kaltsas et al (95) evaluated 67 patients with acromegaly. At 7 days following transsphenoidal surgery, GH secretion was assessed by calculating the mean serum GH from a five-point GH “day curve,” samples being collected at 0830 h, 1100 h, 1300 h, 1700 h, and 1900 h. The authors took an early postoperative GH level of < 5ng/ml as "safe". Relying on a single GH measurement alone, 9 of the 23 patients with a single postoperative mean GH level less than 5 mU/L obtained at least one GH value of
Takahashi et al (101) examined IGF-1 and glucose suppressed GH levels within the first postoperative month, and correlated it with cure at final follow-up (as documented by a normalized IGF-1 level). The mean follow-up period was 7 years, and they found that patients who attained both normalized IGF-1 and glucose suppressed GH < 1ng/ml, stayed cured. However, even in patients who did not meet both criteria within the first postoperative month, glucose-suppressed GH < 1.5 ng/ml, or glucose-suppressed GH < 4 ng/ml coupled with early IGF-1 normalization indicated the possibility of cure. None of the patients with an early glucose-suppressed GH > 4 ng/ml, achieved cure.
TREATMENT OF GH-SECRETING PITUITARY ADENOMAS
Definition of cure or remission in acromegaly
ng/ml, treatment goals should restore GH levels to less than 1.0 ng/ml during an OGTT and normalize age- and gender-related IGF-I levels.(Consensus statement, 2000).
When to assess for cure?
The timing of postoperative testing may also be important, and recent evidence from Kaltsas et al,(95) suggests that early assessment may be as effective as more traditional analyses in which formal testing of the GH axis is delayed until 1 month or more after surgery. They found no differences in remission rates assessed at 1–3 wk compared with more than 4 wk after surgery and propose that early measurement of IGF-I is prognostically useful. This is in contrast to others who have suggested that early postoperative analysis may be inaccurate (25). However IGF-1 as an indicator of cure is significant at 3 or more months after surgery (102).
Surgery:
surgical cure, reoperation for surgically accessible residual or recurrent tumor seen on MRI should be considered (45).
Results of surgery
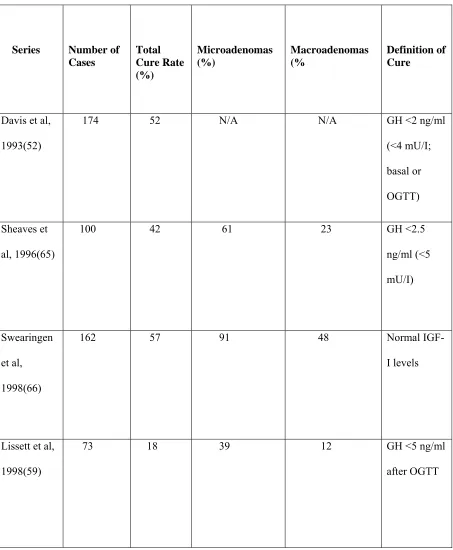
Cure rates: Several recent series have reported on the results of transsphenoidal surgery. Symptomatic relief occurs in nearly 95% of cases (68). Cure rates with the stringent criteria of nadir GH levels < 1.0 ng/ml during a GTT vary from 35.5% to 84.4% (see table 2). With less strict criteria the remission rates are higher: 76% when < 5 ng/ml GH levels were used (46) to 94% when < 10 ng/ml was the criterion for cure (47).
Table:2
PRIMARY TRANSSPHENOIDAL SURGERY FOR GH-SECRETING PITUITARY
ADENOMA
Series Number of
Cases Total Cure Rate (%) Microadenomas (%) Macroadenomas (% Definition of Cure
Davis et al,
1993(52)
174 52 N/A N/A GH <2 ng/ml
(<4 mU/I;
basal or
OGTT)
Sheaves et
al, 1996(65)
100 42 61 23 GH <2.5
ng/ml (<5
mU/I)
Swearingen
et al,
1998(66)
162 57 91 48 Normal
IGF-I levels
Lissett et al,
1998(59)
73 18 39 12 GH <5 ng/ml
Series Number of
Cases Total Cure Rate (%) Microadenomas (%) Macroadenomas (% Definition of Cure Abosch et al, 1998 (40)
254 76 75 71 GH <5 ng/ml
(<10 mU/I)
Ahmed et
al,
1999(48)
97 — 90 56 Basal GH
≤2.5 ng/ml
(<5 mU/I),
OGTT GH
<1 ng/ml (<2
mU/I), normal IGF-I levels Biermasz et al, 2000(49)
59 41 NA NA Basal GH ≤
2.5 ng/ml
Series Number of
Cases Total Cure Rate (%) Microadenomas (%) Macroadenomas (% Definition of Cure
Laws et al,
2000(58)
117 67 87 51 Basal GH
<2.5 ng/ml
(<5 mU/I),
OGTT GH <1
ng/ml (<2 mU/I), normal IGF-levels) Fahlbusch, 2001(41)
490 56 78 50 Basal GH <5
ng/ml (<10
mU/I), OGTT
GH <2 ng/ml
(<4 mU/I),
normal IGF-I
levels
Kreutzer et
al, 2001(57)
57 70.2 NA NA OGTT GH <1
ng/ml (<2
Series Number of
Cases Total Cure Rate (%) Microadenomas (%) Macroadenomas (% Definition of Cure
De et al,
2003(53)
90 63 79 56 OGTT GH
<1 ng/ml (<2
mU/I),
normal
IGF-levels
Minniti et
al, 2003(61)
92 55 80 50 OGTT GH
<1 ng/ml (<2
mU/I),
normal
IGF-levels
De et al,
2003(53)
90 63 79 56 OGTT GH
<1 ng/ml (<2
mU/I),
normal
IGF-levels
Nomikos et
al, 2005(62)
668 57.3 75.3 50.3 OGTT GH
<1 ng/ml (<2
mU/I),
normal
Series Number of
Cases Total Cure Rate (%) Microadenomas (%) Macroadenomas (% Definition of Cure Abbasioun et al, 2006(47)
104 94.2 NA NA Basal GH< 10
ng/ml
Boeving et
al, 2006(50)
28 35.5 NA NA Basal GH
≤2.5 ng/ml
(<5 mU/I),
OGTT GH <1
ng/ml (<2
mU/I), normal
IGF-I levels
Boeving et
al, 2006(50)
28 35.5 NA NA Basal GH
≤2.5 ng/ml
(<5 mU/I),
OGTT GH <1
ng/ml (<2
mU/I), normal
Series Number of
Cases
Total Cure Rate (%)
Microadenomas (%)
Macroadenomas (%
Definition of Cure
Santoro et al,
2007(64)
109 61 85 55 OGTT GH <1
ng/ml (<2
mU/I), normal
IGF-levels
Gondim et al,
2008(56)
33 84.84 100 78.2 OGTT GH <1
ng/ml (<2
mU/I), normal
Presurgical treatment with somatostatin analogs:
Radiotherapy
The role of radiotherapy (RT) in acromegaly is almost entirely restricted to those patients who fail previous surgery, since pituitary dysfunction and delay to remission limit its utility. As primary therapy, conventional RT is known to reduce tumor mass, GH levels and pituitary function predictably with time. Further growth is prevented in 99% of patients; GH levels progressively decrease to 50% of baseline by 2 years and 75% of baseline by 5 years. Further decrease in GH levels are seen at 10 and 15 years and 90% of those surviving at 15 years have levels < 5 ng/ml. Using more stringent criteria of cure, post suppression GH levels < 1ng/ml after a GTT, were seen in 9% of patients at 2 years, 29% at 5 years, 52% at 10 years and 77% at 15 years when radiation was used as an adjunct to surgery (74). Fifty percent of patients who underwent treatment with both radiation therapy and surgery have reported hypopituitarism, and the incidence can increase with time from exposure for up to 20 years post treatment (75, 76). Minniti et al (74) noted progressive hypopituitarism, which was present in 33% of patients at baseline and increased to 57%, 78% and in 85% of patients at 5 10 and 15 years after RT, respectively.
gonadal deficiency. Losa et al (85) looked at stereotactic radiosurgery without concomitant GH-suppressive drugs in 83 patients with residual or recurrent GH-secreting adenomas. The rate of remission (GH level < 2.5 ng/ml) was 52.6% at 5 years. The 5-yr cumulative risk of new onset hypogonadism, hypothyroidism, or hypoadrenalism was 3.6%, 3.3% and 4.9% respectively.
Medical Therapy
Macroadenomas tended to show a more impressive response than microadenomas with >50% size reduction in 70% of cases, though two of three tumors that disappeared were microadenomas. Invasiveness, however was not reverted, though in a few cases those tumors that showed doubtful invasion proved to have clear borders separate from the cavernous sinus wall with treatment. These findings are supported by more recent studies (90) that have shown significant tumor size reduction and GH normalization at 6 months; though the results were worse for macroadenomas with only 45% of patients achieving GH levels < 2.5 ng/ml. At the present time, surgery and medical therapy complement each other in the overall management of acromegaly. Recent data points towards a role for surgical debulking in improving response to somatostatin agonists in tumors that are only partially sensitive to these drugs (71, 91).
The disadvantages of octreotide are that it tends to produce gastrointestinal side effects and predisposes to the development of gallstones. While it requires thrice-daily subcutaneous injections, long acting formulations of somatostatin analogs (octreotide LAR and lanreotide) are as effective but some patients may not respond to these drugs optimally or become intolerant.
treatment with this drug therefore patients need to be monitored for visual deterioration and tumor growth on MRI. The efficacy of pegvisomant is dose dependent and IGF-1 levels have been normalized in those patients who were surgical failures or who were resistant to or intolerant of somatostatin analogs (93).
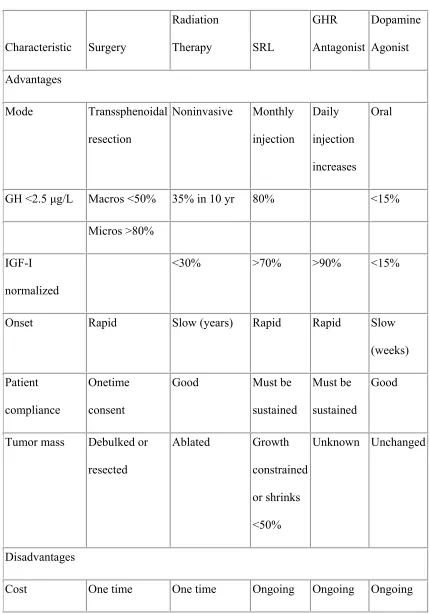
Table 3. compares the advantages and disadvantages of the various treatment modalities for acromegaly.
Table 3- Various treatment modalities in acromegaly. Characteristic Surgery Radiation Therapy SRL GHR Antagonist Dopamine Agonist Advantages Mode Transsphenoidal resection Noninvasive Monthly injection Daily injection increases Oral
GH <2.5 µg/L Macros <50% 35% in 10 yr 80% <15%
Micros >80%
IGF-I normalized
<30% >70% >90% <15%
Onset Rapid Slow (years) Rapid Rapid Slow
(weeks) Patient
compliance
Onetime consent
Good Must be
sustained
Must be sustained
Good
Tumor mass Debulked or resected Ablated Growth constrained or shrinks <50% Unknown Unchanged Disadvantages
Characteristic Surgery Radiation Therapy SRL GHR Antagonist Dopamine Agonist Hypopituitarism <10% >50% None Very low None
MATERIALS AND METHODS:
Study design:
Retrospective analysis of a prospectively maintained database.
Study population:
Patients with acromegaly who underwent transsphenoidal surgery at the Department of Neurosurgery from the time period May 2001 till January 2007.
The patient information was recorded in a proforma (Appendix-1) which included patient details, pre- operative, intraoperative and post operative data along with details of follow-up.
All patients had a complete hormonal evaluation and magnetic resonance imaging of the brain.
Tumors were classified as microadenomas when they were <10 mm and macroadenomas were those that were 10 mm or larger. Wilson’s modification (104) of Hardy’s staging system graded the macroadenomas into A, B, C, D or E. Invasion was defined as involvement of the cavernous sinuses, sphenoid sinus or intraoperative evidence of dural invasion.
Criteria for preoperative diagnosis of acromegaly: 1. Clinical evaluation
2. Elevated basal serum growth hormone levels of > 2.5 ng/ml
(100 gm)
4. Histopathology reported as Growth hormone secreting pituitary adenoma.
Early post operative serum growth hormone levels were measured on the first morning after surgery (basal level) and seventh day (post suppression with 100 mg oral glucose) following transsphenoidal surgery.
The GH hormone assay was done on Immulite-2000 using a Diagnostic Products Corporation kit. It is a solid phase, 2-site chemiluminescent immunometric assay, using murine monoclonal anti-HGH antibody and rabbit polyclonal anti-HGH antibody, conjugated to alkaline phosphatase. The sensitivity of the assay is 0.01 ng/ml with linearity upto 40 ng/ml.
Histopathological evaluation included immunostaining for cytokeratin to classify the growth hormone secreting adenomas into sparsely/densely granulated adenomas. The detailed histopathological methodology is enumerated in Appendix-2.
Criteria for remission:
1. Glucose suppressed serum growth hormone level of less than 1 ng/ml.
2. IgF-1 level in the normal range for age (IgF-1 levels were available and standardized at our institution only after July 2004).
Analysis:
RESULTS:
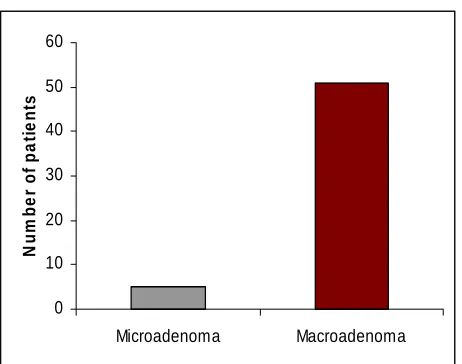
A total of 72 patients underwent transsphenoidal surgery for acromegaly between May 2001 till January 2007. Their ages ranged from 16 to 75 years (mean 37.5) and there were 36 women and 36 men. Three patients did not have clinical features of acromegaly, the diagnosis being made on biochemical and immunohistochemical basis. In the remaining 69 patients, the duration of acromegaly ranged from 3 months to 15 years (mean 52 months). Preoperative vision was affected in 25 cases (35%). Twenty five (35%) patients had diabetes, 27 (37%) had hypertension (HT) and 13 (18%) had both HT and diabetes. There were 6 microadenomas and the remaining 66 were larger than 10 mm. Of the macroadenomas, 16 were Hardy’s stage A, 16 Stage B, 23 Stage C, 5 Stage D and 6 Stage E. Mixed GH-PRL tumors were seen in 16 patients. Immunostaining for cytokeratin was available for 67 out of the 72 patients and in 52 of the 56 patients with follow-up. Based on the immunostaining for cytokeratin, tumours were classified into sparsely or densely granulated somatotroph adenomas. In the 52 patients, 25 patients had sparsely granulated growth hormone adenomas and the rest were densely granulated.
Follow-up was available in 56 patients (77.77%) ranging from 3 months to 65 months (median 21 months).
0 10 20 30 40 50 60
Microadenoma Macroadenoma
N
u
m
b
er
o
f
p
a
ti
en
[image:54.612.185.416.218.400.2]ts
Figure 3
Early post operative GH levels as a predictor of cure:
1st post operative day GH level (Figure 4) of > 2 ng/ml had a negative predictive value (NPV) of 96.4%, positive predictive value (PPV) of 76.4%, sensitivity of 92.85% and a specificity of 87.1%. The P value was <0.05.
This meant that if a patient who underwent transsphenoidal surgery for acromegaly, has a 1st postoperative day GH level of more than 2 ng/ml, it is almost certain that he won’t be cured (NPV of 96.4%). Similarly if the value is less than 2 ng/ml, then he has a high chance of cure (PPV of 76.4%). That this test is significant is confirmed by the high sensitivity and specificity.
Similarly the 7th post operative day GH level (Figure 5) of > 2ng/ml had a negative predictive value of 88.36%, positive predictive value of 72.5%, sensitivity of 81.25% and specificity of 79.16%. The P value was <0.05.
Thus, similar to the 1st postoperative day value, the 7th postoperative day value of more than 2 ng/ml was associated with high chance of failure and a value of less than 2 ng/ml correlated to a high chance of cure. Here again the sensitivity and specificity were significant.
27
4
1
13
1st postoperative day basal
GH level vs. remission
<2 ng/ml
>2 ng/ml
YES
NO
GH Level
Remission
Negative predictive value 96.4%
Postive predictive value 76.4%
Sensitivity 92.85%
Specificity 87.1%
P value <0.05
Figure 4.
19
5
3
13
7th postoperative day glucose suppressed
GH level vs. remission
<2 ng/ml
>2 ng/ml
YES
NO
GH Level
Remission
Negative predictive value 86.36%
Postive predictive value 72.5%
Sensitivity 81.25%
Specificity 79.16%
P value <0.05
Figure 5.
Other predictors:
The remission rates based on Hardy’s grade: (Figure 6)
Microadenoma: 60% (3/5)
Grade A- 35.7% (5/14) Grade B- 54.5% (6/11) Grade C- 47% (8/17) Grade D- 25% (1/4) Grade E- 0% (0/6)
The p-value on a Chi square test for determining the significance of size was 0.45 with lower Hardy’s grade (A,B,C) having an odd’s ratio of 6.61 for cure.
Remission with relation to preoperative random GH value: (Figure 7)
The patients were divided into 2 groups based on the mean preoperative GH level.
Remission rates based on size Figure 6
3 2
5 9
6 5
8 9
1 3
0 6
0 2 4 6 8 10 12 14 16 18
Microadenoma A B C D E
Non-remission
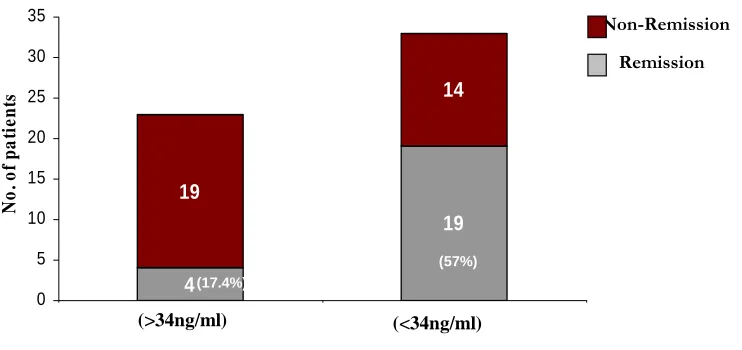
Figure 7 Non-Remission (57% ) (17.4%) 4 19 19 14 0 5 10 15 20 25 30 35 1 2 No . o f p a ti e n ts (<34ng/ml) (>34ng/ml) (GH Level) Remission (57%) (17.4%)
Remission rates and invasiveness:
In the non-invasive adenomas, the overall cure rate was 44.4% (16 out of 36 patients), whereas in the invasive group, the cure rate was 35% (7 out of 20 patients). The p-value was 0.49.
Remission rates and duration of symptoms:
Based on the duration of symptoms, the patients were divided into 2 groups. Patients with duration of symptoms less than 24 months had an overall cure rate of 41% (7 out of 17 patients). Patients with duration of symptoms more than 24 months had the same cure rate of 41% (16 out of 39 patients). The p-value was 0.99.
Remission rates association with immunostaining characteristics:
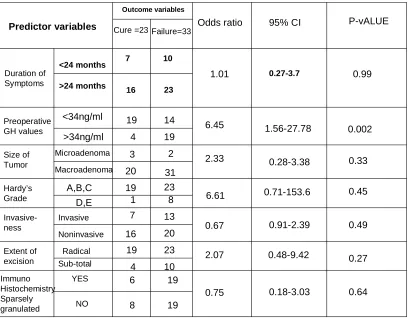
Table 4 shows the results of the univariate analysis for each variable for predicting a cure. Included in the analysis are 56 patients who had follow-up GH levels. A univariate analysis was performed using the variables: duration of symptoms, preoperative GH levels, size of tumor, Hardy’s stage, invasiveness, extent of excision and whether the tumour was sparsely granulated or not. These were compared with the outcome variables – cure or failure (cure- glucose suppressed level of GH < 1 ng/ml). Duration of symptoms more than 24 months had an Odd’s ratio of predicting non-remission of 1.01. Macroadenomas were 2.33 times likely to have non-remission as compared to microadenomas. Invasiveness was found to be not significant in predicting the outcome (Odd’s ratio of 0.67). A radical excision of the adenoma had a 2 times greater chance of remission as compared to non-remission. Electron microscopy findings (sparsely granulated adenomas) also were not significant in predicting cure (Odd’s ratio of 0.75).
Preoperative growth hormone level of < 34 ng/ml meant that there was a 6.45 times greater possibility of cure as against a level of > 34 ng/ml. (95% CI 1.56-28.78, p-value 0.002).
Similarly, a lower Hardy’s grade of tumour (A, B, C) had a 6.61 times of remission as compared to Hardy’s grade D or E tumours (95% CI 0.71-153.6, p-value 0.45).
Predictor variables Cure =23 Failure=33 Odds ratio 95% CI P-vALUE Duration of Symptoms <24 months >24 months 7 10 16 23
1.01 0.27-3.7 0.99
0.002 0.33 0.45 0.49 0.27 1.56-27.78 0.28-3.38 0.71-153.6 0.91-2.39 0.48-9.42 6.45 2.33 6.61 0.67 2.07 23 14 19 2 31 23 8 13 20 10 19 4 3 20 19 1 7 16 19 4 <34ng/ml >34ng/ml Microadenoma Macroadenoma A,B,C D,E Invasive Noninvasive Radical Sub-total Preoperative GH values Size of Tumor Hardy’s Grade Invasive-ness Extent of excision Immuno Histochemistry Sparsely granulated Outcome variables YES NO 6 19 8 19
[image:64.612.141.549.124.442.2]Cure rates and multimodality treatment:
At follow-up, based on nadir post glucose suppression GH levels, sixteen patients (28.5%) were in remission after surgery (mean follow-up 20 months), while 40 (71.5%) were surgical failures. The 40 patients who were in non-remission were kept on close follow-up, started on medical therapy, radiation therapy or underwent second surgery.
Of the fifty six patients, 2 underwent a second surgery and 13 patients received radiation therapy (11-SRT, 2-Conventional). One more patient went into remission after 2 surgeries, one after 2 surgeries and radiation therapy, 2 patients after surgery and radiation therapy and 4 patients with surgery and medical therapy (dopamine agonists). Therefore the final cure rate of initial surgery + 2nd surgery + RT + Medical therapy was 23/56 (41%). A total of 33 patients were still not in remission after multi-modality treatment.
N=56
Remission =23
Non-Remission=33
Surgery
16
Surgery +
Cabergoline/RT
/2 SURGERIES
7
Remission: Glucose suppressed GH level < 1 ng/ml ( All the values are glucose suppressed GH levels )
Cabergoline
Resurgery
Radiation therapy
[image:66.612.89.560.113.396.2]Follow up
CASE REPORTS:
These case reports show the varied response to surgery and the multimodality treatment that is required for cure of this difficult disease.
Case 1: (Figures 9, 10)
This 38 year old lady presented with acromegalic features and investigation revealed a Hardy’s grade B pituitary macroadenoma. She was not a diabetic or hypertensive. Vision was normal. She was on Tab. Eltroxine. The preoperative GH level was 8.9 ng/ml. She underwent transsphenoidal radical excision of the tumour. The next day GH was 0.8 ng/ml and the 7th day value was 1.6 ng/ml. At 5 years follow-up, she continues to be in remission, with the GH level of 0.646 ng/ml and normalized IGF-1 level (117 ng/ml). She was still on Tab. Eltroxine.
[image:68.612.160.463.69.405.2]
Patient 1 (Preoperative GH value: 8.9 ng/ml) 1.6 0.5 0.86 0.646 0 0.2 0.4 0.6 0.8 1 1.2 1.4 1.6 1.8
0 500 1000 1500 2000
GH l eve l (n g/ ml )
(4 months) (16 months) (32 months) (56 months) (60 months)
(Post operative follow-ups)
7thday
4thMonth
16thMonth
Case 2: (Figures 11, 12)
[image:71.612.147.486.84.500.2]
Figure 12
(Post operative follow-ups)
Patient 2 (Preoperative GH value: 11.3ng/ml)
2.36 1.74 0.84 3.48 0.747 0 0.5 1 1.5 2 2.5 3 3.5 4 G H l e ve l ( n g/ m l)
7thday 5thMonth 12thMonth 22ndMonth 36thMonth
(Cabergoline)
Case 3: (Figures 13, 14, 15)
This 44 year old male presented with acromegalic features. The preoperative GH level was 66.3 ng/ml. MRI showed a microadenoma but there was invasion into the right cavernous sinus. He was a hypertensive on medication. The cortisol and thyroid axes were normal. He underwent radical excision including the portion in the cavernous sinus. The 7th post operative day GH level was 2.1 ng/ml. However his GH level continued to rise at serial follow-ups. MRI brain did not show any residual tumour. He underwent Stereotactic radiation therapy one and half years after surgery. At last follow-up (5 years), his GH level had decreased to 1.3 ng/ml and the IGF-1 was normalized for age and gender (105 ng/ml).
[image:74.612.190.405.80.365.2]
[image:75.612.202.418.95.331.2]
Patient 3 (Preoperative GH value: 66.3 ng/ml)
2.7 4.49 5.35 5.05 2.1 1.31 0 1 2 3 4 5 60 180 360 540 720 900 1080 1260 1440 1620 1800
G H l evel ( n g /m l) (60 months)
(12 months) (24 months)
(7 weeks) (36 months)
(Post operative follow-ups)
[image:76.612.123.547.162.400.2]Case 4: (Figure 16, 17, 18)
This 17 year old male presented with acromegalic features. His random GH level was 99 ng/ml. MRI showed a Hardy’s grade C pituitary adenoma with invasion into the right cavernous sinus. His vision was normal and he was not on replacements. He underwent radical excision of the pituitary adenoma on 15/6/2001. Post operative CT scan showed evidence of residual tumour near the right cavernous sinus. The GH level on the 1st post operative day was 26.1 ng/ml. He was lost to follow-up and came back only after 5 years when the MRI showed a large grade E tumour. He was on Tab. Prednisolone and Tab. Eltroxine. The GH level before the second surgery was 77 ng/ml. He underwent transsphenoidal resurgery on 13/12/2005 and the GH level on the seventh day following resurgery was 9.48 ng/ml. He was advised stereotactic radiation therapy, which he took in September 2006. He was also started on Tab. Cabergoline. His GH level during the time he was on SRT had risen again to 27.7 ng/ml. There were no more follow-ups available for this patient.
[image:78.612.157.427.68.491.2]
Figure 18
Patient 4 (Preoperative GH value: 99ng/ml)
26.1 40 87.4 77 27.7 0 20 40 60 80 100
0 500 1000 1500 2000
G H le v e l ( n g /m l)
(14thmonth) (36thmonth) (54thmonth) (63rdmonth)
(Postoperative follow ups)
(Surgery)
7thday
14thmonth
36thmonth
54thmonth
63thmonth
Case 5: (Figures 19, 20)
This 40 year old lady presented with acromegalic features for 6 years. Her random GH level was 33.7 ng/ml. MRI showed a 9 mm size microadenoma. Her vision was normal. She underwent radical excision of the pituitary adenoma. The GH level on the 1st post operative day was 0.85 ng/ml and on the 7th post operative day was 1.95 ng/ml. Two follow-ups later at 18 months she continued to be in remission with a GH level of 0.354 ng/ml and IGF-1 of 65 ng/ml. She was a diabetic and hypertensive and she required the same dose of medication as preoperatively.
Pateint 5 (Preoperative GH value 33.7 ng/ml)
1.95
0.3 0.192
0 0.5 1 1.5 2 2.5
0 180 360 540
GH
le
v
e
l (
ng/m
l)
7thday
6thmonth
18thmonth
(6thmonth) (18thmonth)
(Postoperative follow ups)
Figure 20.
Case 6 : (Figures 21,22)
This 31 year old male presented with acromegalic features for 10 years. The preoperative GH level was 38.8 ng/ml. MRI showed a Hardy’s grade A pituitary macroadenoma. . He underwent radical excision of the pituitary adenoma. The 1st post operative day GH level was 0.8 ng/ml. He was in remission till 56 months after surgery when his GH level showed an increase to 1.09 ng/ml. However since the IGF-1 level was normal (70 ng/ml), he is under observation. He would require adjuvant therapy should the IGF-1 level rise.
[image:85.612.162.447.97.481.2]
12thmonth
42ndmonth
56thmonth
Patient 6 (Preoperative GH value:38.8 ng/ml)
0.21 0.06 1.09 0 0.2 0.4 0.6 0.8 1 1.2
0 180 360 540 720 900 1080 1260 1440 1620
G H l o evel ( n g /m l)
(12thmonth) (42ndmonth) (56thmonth)
[image:86.612.134.525.257.380.2](Postoperative follow ups)
DISCUSSION
The treatment of acromegaly is aimed at reduction of GH levels so as to avoid the
harmful systemic effects of raised serum GH level. These include cardiovascular,
metabolic and neoplastic changes. Transsphenoidal surgery (TSS) remains the first
choice of treatment for acromegaly. It is effective and safe and is able to reverse
metabolic and cardiovascular complications related to the disease. However, complete
removal is not always possible and adjuvant therapy in the form of dopamine agonists,
somatostatin analogs and radiotherapy are often required. Although recent studies show
encouraging results with somatostatin analogues and GH receptor antagonists, these
drugs are exorbitantly expensive and their use in developing countries is limited.
In our study population, preoperative data such as age and sex distribution, tumor grading, duration of symptoms and preoperative GH concentration were comparable with other studies. Among the presenting complaints, visual deficits were present in a higher percentage of patients (35%) as compared to published literature. A large majority (91.6%) of the adenomas were macroadenomas and more than a third (37.5%) of the adenomas were invasive.
Throughout the 1980s, post-operative GH levels < 5 ng/ml were considered as criteria of
biochemical remission of disease, allowing a surgical success in more than 75% of
patients in some large series. But epidemiologic studies have shown that mortality rates
GH and IGF-I levels are normalized. This means an age and gender normalized IGF-1
and post glucose suppressed GH levels of less than 1 ng/ml.
The latest stringent criteria recommended by the Acromegaly treatment consensus workshop, were used in this study (normal IGF-1 level and post glucose suppressed GH
levels of less than 1 ng/ml). The assay used in our institute was a highly sensitive
chemiluminescent immunoassay with a sensitivity of 0.01 ng/ml.
The earliest postoperative timing of assessment of cure was 3 months, which according to literature (102) is the earliest time for assessing both post-glucose suppression nadir GH level and IGF-1 level to determine outcome.
A method that would identify those patients who have not responded to surgery in the early postoperative period itself would allow the early institution of adjuvant therapy to normalize the GH level quickly.
PREDICTORS OF CURE
The early postoperative GH values were evaluated with regard to sensitivity, specificity and their predictive values for the outcome of the operation. We found that the 1st and 7th postoperative day GH levels were highly predictive of the surgical outcome.
We also evaluated other predictors of cure in our study namely the duration of symptoms, size of the tumour, preoperative growth hormone levels, Hardy’s grade, invasiveness of the tumour and immunohistochemistry findings. By univariate analysis, preoperative GH levels of less than 34 ng/ml were found to be the most statistically significant in predicting a cure, with an odd’s ratio of 6.45 and p-value of 0.002. Although the lower Hardy’s grade tumours (A, B, C) had an odd’s ratio of 6.61 as compared to Hardy’s grade D, E tumours, the p-value was not significant (0.45). Microadenomas also fared much better than macroadenomas with a surgical cure rate of 60% as against 26% for macroadenomas and 15% for invasive tumours. These findings were similar to those already described in literature.
The radicality of the excision was not found to be significant in predicting the outcome. This meant that the surgeon’s impression of radicality of excision was not a good indicator of the extent of excision.
CURE RATES
In spite of there being a consensus statement, there are still studies which used higher GH level definitions as cure. An example is the series published by Abbasioun et al (2006) (47) of 151 patients operated over a period of 23 years. They achieved a cure rate of 94.2% using a cure criterion of 10 ng/ml. According to the author, in developing countries with limited resources and limited modalities of adjuvant therapy, clinical control and the patient “being happy” at follow-up, could be considered good outcomes. This could reflect reluctance on the part of authors to accept an extremely stringent criteria for cure, as the cure rates would then be abysmally low.
We used stringent criteria for cure as defined by Guistina et al (Consensus statement, 2000- post glucose suppression nadir GH value of < 1 ng/ml and a normal IGF1).
In published literature, the cure rates with the stringent criteria of nadir GH levels < 1.0 ng/ml during a GTT vary from 35.5% to 84.4% (48,51,53,56,57,58,60,61,62,64)
In this series, when the post-glucose suppressed values of GH were considered alone as criteria of remission, in microadenomas the cure rate was 60% as compared to 26 % in macroadenomas. The remission rates fell to 0% in Hardy’s grade E tumours. The overall cure rates attained with multimodality treatment was 41%. A significant proportion of tumours in our study were invasive at surgery or on imaging (35.7%). In this subset, the overall remission rate was 35%, as compared to noninvasive macroadenomas, where the overall cure rate was 45%.
56 patients with follow-up. According to Freda et al (69), as long as IGF-1 normalization is maintained, these patients can be observed without additional therapy. Adjuvant therapy is necessary only when IGF-1 shows a rising trend. Swearingen et al (66) had a 57% surgical cure rate using only normal IGF-1 as criterion for cure.
not. This study by Bates et al (46) demonstrates the wide range of cure rates in a developed country, even with less stringent criteria than that recommended by Guistina et al (25). In our study, the overall cure rate was 28.5% using the criteria of post OGTT GH level of < 1 ng/ml, and would be higher if the criterion used by Bates et al (46) is applied. Another reason for the lower cure rates in this study could be the high proportion of invasive adenomas (35%). But other series have also found about 1/3rd of the adenomas to be invasive (62).
Based on our experience with GH secreting pituitary adenomas, we suggest an algorithm to manage these difficult tumors (Figure 23). Transsphenoidal surgery is the first line of management. In those tumors, where a radical excision has been achieved, further treatment will depend on the 7th postoperative day post glucose suppressed GH levels. As evidenced in our study, those with 7th postoperative day GH level of < 2 ng/ml have a high chance of cure and are hence kept on follow-up without any need for additional treatment. The group of patients who have undergone a radical excision but have a 7th day GH of > 2ng/ml, need to be given a trial of medical therapy with Tab. Cabergoline and the response evaluated after 3 months. Although the criteria of cure is < 1 ng/ml with a normalized IGF-1, literature has shown that those with a normal IGF-1 and GH < 5 ng/ml, have long term mortality rates comparable to normal population and less than 5 ng/ml has been used a criterion of cure (46). Thus, this group of patients can be kept under very close observation with annual check ups. However, in the patients were the IGF-1 level is high and the GH level has not dropped to < 1ng/ml, further management would depend on the MRI Brain findings. If the MRI shows accessible residue, then a second TSS can be planned followed by RT, else direct RT would be the treatment of choice at this juncture.
Transsphenoidal surgery
Radical excision
<2.0 ng/ml >2 ng/ml
7th
POD GH level
Partial/Subtotal excision
Cabergoline 3 months
Good response Poor response
RT
Followup GH levels
Inaccessible residue >1.0 ng/ml or
High IGF-1
Accessible residue
2ndTSS
Octreotide/Lanreotide
GH levels at 3 months IGF-1 levels
MRI
Cabergoline
<5.0 ng/ml and Normal IGF-1
[image:95.612.90.589.70.450.2]Annual followup
Somatostatin analogs have not been discussed in the algorithm because of the exorbitant costs, which very few of our patients can afford. However, literature does show promising results with this group of drugs, both pre- and post-operatively. These drugs will have a significant role to play in a developing country like ours, once the costs are reduced.
Thus, surgical outcomes for acromegaly remain less than satisfactory and early
postoperative GH levels help us in predicting the surgical failures early. With the advent
RECOMMENDATIONS:
1. Primary care physicians play a major role in an early identification of acromegaly and resources should be directed toward increased awareness of the disease and its diagnosis in this provider group. This would lead to early identification of the disease and thus better outcomes.
2. A high preoperative GH level of > 34 ng/ml and Hardy’s grade D,E tumours indicate poor outcomes and the inevitable possibility of adjuvant therapy needs to be kept in mind.
3. Early post operative GH levels should be done routinely as they have a good sensitivity and specificity to predict surgical failures.
4. Those patients with a post operative GH > 5 ng/ml and surgically inaccessible tumour residue will probably require adjuvant radiation therapy.
REFERENCES:
1. Melmed S. Acromegaly in William’s Textbook of Endocrinology. 11th edition. Saunders.
2. Cushing H., Bailey P. Studies in Acromegaly VII. The Microscopical Structure of the Adenomas in Acromegalic Dyspituitarism (Fugitive Acromegaly). Am J Pathol. 1928; 4(6): 545–564.13.
3. Cushing H., Davidoff L.M. Studies in Acromegaly. IV. The basal metabolism. Arch Intern Med. 1927; 39(5):673-697.
4. Bengtsson BA, Edén S, Ernest I, Odén A, Sjögren B. Epidemiology and long-term survival in acromegaly. A study of 166 cases diagnosed between 1955 and 1984. Acta Med Scand. 1988; 223(4):327-335.
5. Racine MS, Barkan AL. Medical management of growth hormone-secreting pituitary adenomas. Pituitary. 2002; 5(2):67-76.
7. Asa SL, Kovacs K. Pituitary pathology in acromegaly. Endocrinol Metab Clin North Am. 1992 Sep; 21(3):553-574.
8. Maheshwari HG, Prezant TR, Herman-Bonert V, Shahinian H, Kovacs K, Melmed S. Long-acting peptidomimergic control of gigantism caused by pituitary acidophilic
stem cell adenoma. J Clin Endocrinol Metab. 2000 Sep; 85(9):3409-3016.
9. Drange MR, Fram NR, Herman-Bonert V, Melmed S. Pituitary tumor registry: a novel clinical resource. J Clin Endocrinol Metab. 2000 Jan; 85(1):168-174.
10. Jadresic A, Banks LM, Child DF, Diamant L, Doyle FH, Fraser TR, Joplin GF. The acromegaly syndrome. Relation between clinical features, growth hormone values and radiological characteristics of the pituitary tumours. Q J Med. 1982 spring; 51(202):189-204.
11. Nabarro JD. Acromegaly. Clin Endocrinol (Oxf). 1987 Apr; 26(4):481-512.
12. Molitch ME. Clinical manifestations of acromegaly. Endocrinol Metab Clin North Am. 1992 Sep; 21(3):597-614.
14. Ben-Shlomo A, Melmed S. Skin manifestations in acromegaly. Clin Dermatol. 2006 Jul-Aug;24(4):256-259.
15. Freda PU. Current concepts in the biochemical assessment of the patient with acromegaly. Growth Horm IGF Res 2003; 13:171–184
16. Arafah BM, Rosenzweig JL, Fenstermaker R, Salazar R, McBride CE, Selman W. Value of growth hormone dynamics and somatomedin C (insulin-like growth factor I) levels in predicting the long-term benefit after transsphenoidal surgery for acromegaly. J Lab Clin Med. 1987; 109(3):346–354
18. Arafat AM, Möhlig M, Weickert MO, Perschel FH, Purschwitz J, Spranger J, Strasburger CJ, Schöfl C, Pfeiffer AF. Growth hormone response during oral glucose tolerance test: the impact of assay method on the estimation of reference values in patients with acromegaly and in healthy controls, and the role of gender, age, and body mass index. J Clin Endocrinol Metab. 2008 Apr; 93(4):1254-1262.
20. Chapman IM, Hartmann ML, Straue M, Johnson ML, Veldhuis JD, Thorner MO. Enhanced sensitivity growth hormone (GH) chemiluminescence assay reveals lower post glucose nadir GH concentrations in men than in women. J Clin Endocrinol Metab. 1994; 78:1312–1317.
21. Freda PU, Landman RE, Sundeen RE, Post KD. Gender and age in the biochemical assessment of cure of acromegaly. Pituitary 2001; 4:163–171.
22. Shibasaki T, Masuda A, Hotta M, Yamauchi N, Hizuka N, Takano K, Demura, Shizume K. Effects of ingestion of glucose on GH and TSH secretion: evidence for
stimulation of somatostatin release from the hypothalamus by acute hyperglycemia in normal man and its impairment in acromegalic patients. Life Sci 1989; 44:431–438.
23. Earll JM, Sparks LL, Forsham PH. Glucose suppression of serum growth hormone in the diagnosis of acromegaly. JAMA 1967; 201:628–630
24. Lawrence AM, Goldfine ID, Kirsteins L. Growth hormone dynamics in acromegaly. J Clin Endocrinol Metab 1970; 31:239–247.
26. Wouter W. de Herder, Steven WJ. Lamberts. Imaging of pituitary tumors. Baillière's Clinical Endocrinology and Metabolism 1995 Apr; 9(2): 367-389
27. Yamada S, Aiba T, Sano T, Kovacs K, Shishiba Y, Sawano S, Takada K. Growth hormone-producing pituitary adenomas: correlations between clinical characteristics and morphology. Neurosurgery. 1993 Jul; 33(1):20-27.
28. Bhayana S, Booth GL, Asa SL, Kovacs K, Ezzat S. The implication of somatotroph adenoma phenotype to somatostatin analog responsiveness in acromegaly. J Clin Endocrinol Metab. 2005 Nov; 90(11):6290-6295.
29. Obari A, Sano T, Ohyama K, Kudo E, Qian ZR, Yoneda A, Rayhan N, Mustafizur Rahman M, Yamada S. Clinicopathological Features of Growth Hormone-producing Pituitary Adenomas: Difference among Various Types Defined by Cytokeratin Distribution Pattern Including a Transitional Form. Endocr Pathol. 2008; 19(2):82-91.
30. Nachtigall L, Delgado A, Swearingen B, Lee H, Zerikly R, Klibanski A. Changing patterns in diagnosis and therapy of acromegaly over two decades. J Clin Endocrinol Metab. 2008 Jun; 93(6):2035-2041.
using the Acromegaly Quality of Life Questionnaire (AcroQoL). Clin Endocrinol (Oxf). 2005; 63:103-110
32. Holdaway IM, Rajasoorya RC, Gamble GD. Factors influencing mortality in acromegaly. J Clin Endocrinol Metab. 2004; 89:667-674
33. Renehan AG, Bhaskar P, Painter JE, O'Dwyer ST, Haboubi N, Varma J, Ball SG, Shalet SM. The prevalence and characteristics of colorectal neoplasia in acromegaly.J Clin Endocrinol Metab. 2000 Sep; 85(9):3417-3424.
34. Melmed S. Acromegaly and cancer: not a problem? J Clin Endocrinol Metab. 2001 Jul; 86(7):2929-2934.
35. Orme S, McNally RJQ, Cartwright RA, Belchetz PE. Mortality and cancer incidence in acromegaly: a retrospective cohort study. J Clin Endo Metab. 1998; 83:2730-2734.
36. Rajasoorya C, Holdaway IM, Wrightson P, Scott DJ, Ibbertson HK. Determinants of clinical outcome and survival in acromegaly. Clin Endocrinol (Oxf). 1994 Jul; 41(1):95-102.
38. Bates AS, Van’t Hoff W, Jones JM, Clayton RN. An audit of outcome of treatment in acromegaly. Quarterly Journal of Medicine. 1993; 86:293–299.
39. Shimon I, Cohen ZR, Ram Z, Hadani M. Transsphenoidal surgery for acromegaly: endocrinological follow-up of 98 patients. Neurosurgery. 2001 Jun; 48(6):1239-1243
40. Abosch A, Tyrrell JB, Lamborn KR, Hannegan LT, Applebury CB, Wilson CB. Transsphenoidal microsurgery for growth hormone secreting pituitary adenomas: initial outcome and long-term results. Journal of Clinical Endocrinology and Metabolism. 1998; 83:3411–3418.
41. Fahlbusch R, Buchfelder M, Kreutzer J, Nomikos P. Surgical management of acromegaly. In Wass J, ed. Handbook of Acromegaly. Bristol, UK: BioScientifica, 2001:41-47.
42. Ayuk J, Clayton RN, Holder G, Sheppard MC, Stewart PM, Bates AS. Growth hormone and pituitary radiotherapy, but not serum insulin-like growth factor-I concentrations, predict excess mortality in patients with acromegaly. J Clin Endocrinol Metab. 2004; 89:1613-1617
44. Jardena J. Puder, Sujatha Nilavar, Kalmon D. Post, Pamela U. Freda. Relationship between Disease-Related Morbidity and Biochemical Markers of Activity in Patients with Acromegaly. J Clin Endocrinol Metab. 2005; 90: 1972–1978
45. Melmed S, Casanueva FF, Cavagnini F, Chanson P, Frohman L, Grossman A, Ho K, Kleinberg D, Lamberts S, Laws E, Lombardi G, Vance ml, von Werder K, Wass J, Giustina A. Guidelines for acromegaly management. J Clin Endocrinol Metab. 2002; 87:4054-4058
46. Bates PR, Carson MN, Trainer PJ, Wass JA, UK National Acromegaly Register Study Group (UKAR-2).Wide variation in surgical outcomes for acromegaly in the UK.Clin Endocrinol (Oxf). 2008 Jan; 68(1):136-142.
47. Abbassioun K, Amirjamshidi M, Mehrazin A, Khalatbary I, Keynama M, Bokai H, Abdollahi M. A prospective analysis of 151 cases of patients with acromegaly operated by one neurosurgeon: a follow-up of more than 23 years. Surg Neurol. 2006 Jul; 66(1):26-31