EFFECTS OF INHIBITORY PRESSURE ON
TONE – AN EXPERIMENTAL STUDY
By
(Reg. No . 27101810)
PADMAVATH COLLEGE OF PHYSIOTHERAPY
EFFECTS OF INHIBITORY PRESSURE ON
TONE – AN EXPERIMENTAL STUDY
By
(Reg. No . 27101810)
Under the guidance of
Mr. G. ANANDAN , M.P.T. , MIAP.,
Associate Professor,
Padmavathi College of Physiotherapy
Submitted in Partial fulfillment of the requirements for the Degree of Master of Physiotherapy
From
The Tamilnadu Dr. M.G.R. Medical University, Chennai
PADMAVATH COLLEGE OF PHYSIOTHERAPY
CERTIFICATE
This is to certify that the project entitled “
EFFECTS OF
INHIBITORY PRESSURE ON TONE – AN
EXPERIMENTAL STUDY
”
Submitted by the candidate
(Reg. No . 27101810)
is a bonafide work done in partial fulfillment of the requirements for the Degree of Master of Physiotherapy from
The Tamilnadu Dr. M.G.R. Medical University,
Chennai
Guide Principal
Viva-voce Examination held on ________________
DECLARATION
I hereby declare and present my dissertation entitled entitled
“
EFFECTS OF INHIBITORY PRESSURE ON
TONE – AN EXPERIMENTAL STUDY
” the outcome
of the original research work undertaken and carried out be me ,
under the guidance of
Mr. G. ANANDAN, M.P.T. , MIAP.,Associate Professor , Padmavathi College of Physiotherapy,
Periyanahalli, Dharmapuri , Tamilnadu.
I also declare that the material of this dissertation had not
formed in any basis for the award of any other Degree
previously from the Tamilnadu Dr. M.G.R. Medical University,
Chennai.
ACKNOWLEDGEMENT
First and foremost I thank LORD ALMIGHTY for
showering the blessings who always been my source of strength
and guided me in all endeavors leading to the completion of this
project.
My heartful gratitude to the Honorable Chairman
Mr.M.G.SEKAR,B.A.B.L. Padmavathi College of Physiotherapy,
Periyanahalli, for providing me the valuable opportunity for doing
my Bachelor Degree in Physiotherapy.
My sincere and devoted thanks to my project guide
Mr. G. ANANDAN, M.P.T. , MIAP.,
Associate Professor for
Padmavathi College of Physiotherapy , for his inspiration and
guidance throughout this thesis.
I wish to express my sincere thanks to Mr. K.KUMAR,
M.P.T.,M.I.A.P., Principal, Padmavathi College of Physiotherapy,
for his valuable advice , suggestions and encouragements in
making this project a successful one.
I express my special thanks to all of my FRIENDS
for
sharing their knowledge and support each and every step of this
thesis work.
I take this golden opportunity to thank each and every patient
who took part in this study, for his or her kind cooperation and
needed information
DEDICATED TO MY BELOVED
PARENTS , STAFFS
AND
TABLE OF CONTENTS
CHAPTERS Page No
I. INTRODUCTION
1. Introduction 1
II. REVIEW OF LITERATURE
1. Review of Literature 5
III.
METHODOLOGY
1. Research Design 14
IV. STATISTICAL ANALYSIS
AND RESULTS
1. Statistical Analysis and Results 22
V. DISCUSSION
1. Discussion 27
VI. CONCLUSION
1. Conclusion 30
REFERENCES 32
APPENDICES
APPENDIX - I 39
APPENDIX - II 40
APPENDIX - III 41
APPENDIX - IV 43
1
INTRODUCTION
Tone1 is defined as the resistance of muscle to passive elongation or stretch. It is also said to be in a state of readiness 2 . It represents the residual contractions in normally innervated resting muscle or steady state contractions. Changes in tone lead to hypertonia or hypotonia.
Hypertonia3 is defined as velocity dependant resistance to stretch. It is primarily due to one of three factors passive muscle stiffness, neurally mediated reflex stiffness would presumably be due to fibrosis with in the Muscle tissue or even a change in the cellular properties of muscle. Increase reflex gain may reflect a change in descending influence in the monosynaptic reflex between muscle spindle afferent alpha motor neurons or on polynaptic stretch reflex pathways. Increased active muscle stiffness may be due to an increase in number of cross bridges attached during contraction or to an increased in stiffness per cross bridges.
2
Inhibilitory pressure refers to the pressure which causes inhibition to the decreased capacity to initiate a movement response through altered synaptic potential. The synaptic potential is raised making it more difficult for the neuron to fire and produce movement. The combination of spinal inputs and supraspinal inputs acting on alpha motor neuron will cause the muscle spindle, Golgi tendon organs. It is applied by firm pressure to long tendons manually or through positioning at end ranges using firm objects in hand4-6. Many studies states that applying pressure reduces tone.
3
1.1
Statement of the problem:Tone plays a major part in performing a movement. If normal tone is altered than ADL will be affected and depending upon the muscle group affected it leads to Impairment, Disability or Handicap.
This study attempts to find the alteration in tone on applying inhibitory pressure over a tendon of a muscle.
1.2
Significance of the study:Many studies has documented the effect of Inhibitory pressure on tone, but the system becomes more complicated to measure the pressure quantitatively in our setting. This study aims to quantify the pressure with help of an Algometer by Analayzing Pressure pain threshold and Applying the standardized value an normal muscle to Analyses the effect of inhibitory pressure on Tone 21,22,23
1.3
Objective:To standardize pressure Threshold value.
4
1.4
Hypothesis:Ho: There is no significant difference in tone on applying inhibitory pressure.
AH1: There is significant difference in tone on applying Inhibitrary Pressure.
1.5
Operational definitions:a) Algometer24:
It is defined as the use of a pressure guage attached to a rubber disc for measuring pressure threshold and pressure tolerance.
b) Pressure threshold:
It is defined as the minimal pressure that induce discomfort to a subject.
c) Pressure tolerance:
It is defined as the maximal pressure that the subject can tolerate. d) Pain threshold:25
5
REVIEW OF LITERATURE
Susan B O’ Sullivan 1 et a1 l describes tone as resistance to passive elongation or stretch. Susan B O’ Sullivan4 et al describes about inhibitory pressure and how muscle is inhibited and methods of applying inhibitory pressure.
Bernstein2 1967 describes tone as a state of readiness.
Richard L. Limber et al 3 did a study on structural and functional changes in spastic skeletal muscle and stated and started the definition of hypertonia and physiological state of spasticity.
Kukulka CG et al4 did a study on effect of tendon pressure on alpha motor neuron excitabity states that applying inhibitory pressure supports the clinical impression of reduced muscle tone resulting from tendon pressure applying pressure for 10 seconds.
6
reduction in muscle tone might be induced through intermittent tendon pressure.
Mayer M7 et al6 did a study on Some maneuvers for releasing the hypertonous of spastic and shortened muscles states pressure stimulation of particular zones reduces tone.
List T8 et al7 did a study on Influence of pressure rates on reliability of a pressure threshold meter states relationship between the rate of pressure applied over the messeter muscle and pressure pain threshold was studied using algometer.
Brown et al8 studied better palpation of a new pressure pain protocol in TMD states that pressure algometer is a reliable means of measuring pressure pain threshold and employs a magnitude matching psychological protocol to obtain a multidimensional pain report.
7
Merskey and associates10 the international association for the study of pain defines pain as An unpleasant sensory and emotional experience associated with actual or potential tissue damage.
Kenneth M Wookow11 et al11 studied Pain tolerance: Difference according to age sex and race states that pain threshold level of stimulus at which the subject recognizes pain and pain tolerance is subjects request stimulus cessation.
Merskey ans Spears FG12 states that pain threshold is more dependent on physiology factors and pain tolerance on physiological factors.
Beecher HK13 in 1996 studied the measurement of pain in man states that experimental pain cannot be compared to clinical pain.
Tophoff MMWA14 in 1967 states that there is disagreement in the relationship of pain sensitivity to sex.
8
AntonaciF et al17 in 1998 from university centre for adaptive disorders and headache did a study on Pressure algometer in healthy subjects inter examiner variability states that manual algometer has a good and excellent interrater reliability.
Ogimoto.T et al18 in 2002 from Dept of removable prosthodontics did a study on Pressure pain threshold determination in oral mucosa states that pressure algometer is reliable in assessing the pressure pain threshold in oral mucosa sensitivity discriminating pressure pain threshold difference at different sites and at different load rates.
Chesterton LS et al16 did a study in Gender difference on pressure pain threshold in healthy humans and stated that healthy females exhibited significance lower mean pressure pain threshold in the first dorsal interossies muscle than males.
9
Fisher AA22 did a study on Documentation of myofacial trigger points in 1998 and concluded that Pressure tolerance measured over normal muscles and shinbones express pain sensitivity.
White KP et al 23 in 1993 did a study on The effect of changing the painful stimulus upon dolorimetry scores in patients with fibromyalgia says that statistically lower dolorimetre scores were obtained when using the small sized dolorimeter head.
Fisher24 in 1968 describes the pressure algometer as use of a pressure guage attached to a rubber disc for measuring pressure threshold and tolerance.
Susan L O’ driscoll25 in 1974 did a study on Pain threshold analysis in patients with osteoarthritis of hip and states that patient complaints of pain while applying pressure this is referred as pain threshold.
10
Vermans GE et al37 did a study on neurophysiological methods for the assessment of sapasticity, the hoffmans reflex tendon feflex and stretch reflex and states that the reflexes are basically monosynaptic there are many supraspinal pathways which modulate the responses in terms of there amplitude and latency.
Morit H et al32 did a study on Sensitivity of H reflex and stretch reflex to presynaptic inhibition in humans and states that different sensitivity of mechanically and electrically evoked reflexes to presynaptic inhibition is caused by a difference in the shape and composition of the excitatiory postsynaptic potentials underlying in two reflexes.
Voigt et al33 did a study on the reflex in passive human soleus muscle and said it modulated faster than predicted from postactivatin depression states that major part of the H reflex modulation observerd in healthy subjects was caused by peripheral and spinal influence. The fast 500 ms recovery of H reflex had a time cause comparable to presynaptic inhibition.
11
that the level of presynaptic inhibition was higher at the dorsiflexed positions.
Hoffman MD et al36 in 2004 did a study on Intensity and duration threshold for aerobic exercises induced analgesia to pressure pain states that outcome measure pain rating scale was measure on visual analog scale at 10 seconds interval during a 2 minute pressure pain stimulus and concluded that there was no significant changes in pain rating after 10 minutes of exercises or after exercises at 50% Vo(2)max.
Nussbaum E L et al19 in 1998 did a study on Reliability of clinical pressure pain algometric measurements obtained on consecutive days states that there is perfect reliability for measurements of pressure pain threshold within and across 3 days and substantial reliability between examiners.
12
Stuat Catherart et al28 in 2005 did a study on Reliability of pain threshold measurements in young adults states that pressure applied is converted to Kg/cm2. Reliability of repeat assessment was high as assessed by interclasscorrelation although coefficients of repeatability and variation indicated considerable inter individual variation in repeat measurements.
Kerstin Waling et al30 in 2001 did a study on a comparison of variability of pain rating and pain threshold in women with trapezius myalgia states that pain was assessed on visual analogue scale and pressure pain threshold. No correlation between visual analogue scale and pressure pain threshold was found, it indicates that the instruments measure different characteristics of pain.
13
R.Jason et al20 in 2004 did a study on a comparison of pressure pain detection threshold in people with chronic low back pain and volunteers without pain states that peripheral sensitization in the head and neck region is like temporally and that hypersensitivity of tissues unrelated to the area of injury. It also has a clinical implications.
Fatima goulart35 in 2000 did a study on Posture related changes of soleus H-reflex excitability states that there is no significant changes between positions regarding onset latency or amplitude of H-reflex.
Yasuhiro Kagamihara et al26 in 1977 did a study on Reassessment of H-reflex recovery curve using the double stimulation procedure states that the higher initial peak of recovery may be due to the mechanical effect of the ankle movement by the conditioned H reflex and that quicker is due to the use of greater H reflex in spastics than in controls.
14
METHODOLOGY
3.1 Research design:
Experimental study design.
3.2 Settings:
Padmavathy College of Physiotherapy. PG Research lab which was maintained in room temperature.
3.3 Sampling:
Samples were collected for the study in a random manner.
3.4 Inclusion criteria:
a) All healthy subjects with normal tone b) Muscle power 5
c) Normal H-Reflex.
3.5 Exclusion criteria:
15
3.6 Data collection procedure:
Datas were collected initially according to inclusion criteria for first 100 healthy subjects and later 30 subjects were collected from the previously collected group in a random method.
3.7 Tools for data collection:
Algometer, pen, note pad and H-reflex
3.8 Evaluation and Parameters:
Datas are collected by visual analogue scores initially for pressure threshold and later collected by algometer which shows the readings in Kg/cm2. Later tone alterations are measured using H-Reflex, latency is noted.
3.9 Procedure:
Initially the subjects who were selected for the study were within the inclusion criteria and they were selected randomly for the study. All subjects were taken for the study after signing the informed consent form.
PHASE 1:
16
about the application of pressure with the help of algometer they were also informed that once the subject feels any pain/discomfort on applying pressure the subject should express to the examiner. Once they have understood about the study the subject is asked to lye in prone position with the right ankle joint in neutral position. The pressure is applied 5 times on the right tendoachillis and the same procedure is done for 100 health subjects. Once the values have been obtained the mean value is found. The mean value for 100 subjects is 6.7 kg/cm228. The pressure is applied on the tendon of right tendoachllis above its insertion point. The pressure is applied perpendicular to the tendon. The rubber disc is of 1cm229, with the help of that pressure is applied over the insertion of the tendon the pain is noted using VAS30,31. During this procedure the subject is asked to be in a relaxed posture. Once the first phase ends the 100 subjects were informed that 30 subject will be selected for the phase 2 in random method.
PHASE 2:
17
the subject. Later the mean pressure is applied on the right tendoachills tendon after marking a point on the subject skin. A pressure of 6.7 Kg/cm2 is applied for 10 Second4 immediately after applying pressure H-reflex is taken. The subject is made to still lye in prone position after 5 minutes again H-reflex32 is taken later after 10 minutes after pressure application34 H-reflex is noted again to observe the effect of pressure on tone.
Surface electrodes were used for both stimulation and recording. Paired electrodes for recording (diameter 10 mm) were placed 2-3 cm apart over the belly of soleus muscle, and connected to the EMG machine. The tibial nerve was stimulated at the popitial fossa to eleict H-reflex form the soleus muscle. The ground electrode was placed in the opposite leg.
Readings are noted in the form of minimum latency and maximum latency. Based on these values the statistical analysis is done.
Statistical Analysis:
18
Statistical Methods:
19
20
MATERIAL USED
21
22
STATISTICAL ANALYSIS AND RESULTS
Testing the effectiveness of inhibitory pressure by calculating the amplitude.
Amplitude Mean S.D
Mean difference
Paired t-value
P Value
Pre test 4.78 0.61 0.29 7.20
Post test 4.49 0.57 <0.0001
The above table reveals that the pre test with mean 4.78 and S.D=0.16, post-test with a mean of 4.49 and S.D. = 0.57. The post test values are gradually decreasing with a mean difference of 0.29. The paired t-value (7.20) shows that there is statistically significant changes at p<0.05 (5% level) from the pre-test to post-test using pressure to decrease tone.
Comparing the amplitude with the base value and following 5 minutes after inhibitory pressure.
Amplitude Mean S.D
Mean difference
T-value P-value
Pre-test 4.78 0.61 0.25 4.97 <0.0001 After 5
min
23
The above table suggest that the pre-test mean is 4.78, S.D = 0.61, post-test mean is 4.53 S.D = 55. The post test values are gradually decreasing with a mean difference of 0.25. The paired t-value (4.97) shows that there is statistically significant change at p<0.05 (5% level) from pre test to post 5 minutes using pressure to decrease tone.
Comparing the amplitude with the base and following inhibitory pressure application after 10 minutes.
Amplitude Mean S.D
Mean Difference
T-value P-Value
Pre-test 4.78 0.61 0.104 7.12 <0.0001 After 10 min 4.88 0.61
24
Testing the effectiveness of inhibitory pressure on tone by comparing the latency.
Latency Mean S.D
Mean difference
T-value P-value
Pre-test 29.48 1.98 0.74 8.94 <0.0001
Post-test 30.22 1.93
The above table suggest that the pre-test mean is 29.48, S.D=1.98, post-test mean is 30.22, S.D = 1.93. The post test values are gradually increasing with a mean difference of 0.74. The paired t-value (8.94) shows that there is statistically significant change at p<0.05 (5% level) from pre-test to post-test which is taken immediately after inhibitory pressure.
Comparing the latency with the base value and following inhibitory pressure application after 5 min.
Latency Mean S.D
Mean Difference
T-Value P-Value
Pre-test 29.48 1.98 0.91 10.65 <0.0001 After 5
min
25
The above table suggest that the pre-test mean = 29.48, S.D = 1.98 and the post test mean is 30.39 S.D=1.87. The post test values are gradually increasing with a mean difference of 0.91. The paired t-value (10.65) shows that there is statistically significant change at p<0.05 (5% level) from pre-test to post-test which is taken 5 minutes after inhibitory pressure application.
Comparing the latency with the base value and following inhibitory pressure application after 10 min.
Latency Mean S.D
Mean difference
T-Value P-Value
Pre-test 29.48 1.98 0.30 4 0.0004 After 10 min 29.17 1.95
The above table suggest that the pre-test mean is 29.48 and is 1.98, the post-test mean is 29.17, S.D is 1.95. The post test values are gradually decreasing with a mean difference of 0.30. The paired t-value (4) shows that there is statistically significant change at p 0.0004 (5% level) from the pre-test to post-test which was taken 10 minutes after inhibitory pressure application.
27
DISCUSSION
The foregoing analysis reveals that there is a highly significant difference between the pre-test and the post test. This study compared the changes in the amplitude and latency of H-reflex during the application of inhibitory pressure to the right tendoachillis of 30 neurologically healthy subjects. According to the study a mean inhibitory response in the right tendoachillis motor neuron exitability35,36,37 (as evidenced by a peak to peak H-reflex amplitude) was recorded during the application of inhibitory pressure, as compared with the values obtained during the immediate and after 5 minute session but there was a significant increase in the value after 10 min. This response was consistent in all subject. In this study the latency was also noted and it showed a steady increase in values immediately and after 5 minutes of the study. After 10 minutes there was a decrease in latency which suggested that in our study there was a consistent decrease in the motor neuron excitability.
28
of these receptors are responsible for the inhibition recorded during applying inhibitory pressure to tendoachillis27. Sabbhai et al and Wolf et al in there study have described that the role of cutaneous mechanocepors in the amplitude changes of the H-reflex in both neurological healthy subjects. Consequently it may be assumed that these cutaneous mechanorecptors presumably activated by massage and other manual techniques (eg application of tendon pressure, muscle tapping).
This study also examined whether there was any over effect upon cessation of inhibitory pressure. A mean carryover effect was detected following the cessation of inhibilitory pressure. This effect lasted for about 5 minutes and by 10 minutes the H-reflex amplitude and latency were more than the base line value.
Clinical Implications:
29
30
CONCLUSION:
31
RECOMMENDATION AND LIMITATION
1) The similar study can be conducted in both gender groups, gedriatic group.
2) The similar study can be conducted in paediatric and gedriatic groups.
3) The similar study can be conducted using a large sample size.
4) Similar study can be conducted in spastic condition like stroke, cerebral palsy, spinal cord injury.
Limitations:
1. Psychology aspect of pain threshold was not considered. 2. Small sample size was used for the study.
32
REFERENCES:
1)
Susan B O’ Sullivan, Thomas J.Schmitz 4th edition Physical rehabilitation assessment and treatment Pg 182, 230.2)
Bernstein 1967 – Problem solving in neurologicalphysiotherapy chapter 3 page 11.3)
Structural and functional changes in spastic skeletal muscle – Muscle Nerve 29:615 – 627, 2004 Richard L Lieber phd,Suzanne Steinman, MD,Lona A Barash BS, and Hank chambers,MD.4)
Effect of tendon pressure on alpha motor neuron exitability, Kulkuku CG Felloes COA, Ochletz JE, Venderwilt SG, Phys The 1985 may;65(5);595-600.5)
Effects of intermittent tendon pressure om alpha motoneuron exitability, Kulkuka CG, Beckman SM, Holte JB,H oppenworth PK, phys Ther 1986 jul;66 (7):1091-94.33
7)
Influence on pressure rates on the reliability of a pressure threshold meter, List T,Helkimo MKarisson R,Pain 1994 PMID-1812145.8)
Better palpation of pain: reliability and validity of a new pressure pai protocol in TMD.Brown FF, Robin ME,RILEY ji 3RD ,Gremillion HA, MC Solay J,Meyers G,Cranio, 2000,Jan;18(1):58-65.9)
The assessment of pressure pain threshold and its correlation With depression and anexiety in gedriatic nursing home residents Link may 24,2004,Nezire Kuse GanzeEkici, Mehmet Gurhan Karakaya, Selvil Suvalei, Basaran Demir and Hyse Sadet Otman. A comparission of pressure pain detection in people with low back pain and volunteers without pain,R.Jason,S. Giesbrecht and Michele C Battie, Phys Ther vol 85, no 10, Oct 2005 pp 1085-92.10)
International association for study of pain classification of Chronic pain syndrome and definition of pain terms. Published in 1997.34
Siegelank, MS and Morris F Collen MS, Psychosomatic Medicine VOL-34, No.6 (Nov-Dec 1972)
12)
Merskey and Spears FG cited from pain tolerance: MS, Psychosomatic Maedicine VOL-34,No 6 (Nov-Dec 1972) Difference according to age six and race Kenneth M.Woodrow,MP,GaryP, Friedman,MP,A.B. Siegelank, MS and Morris F Collen MS,Psychosomatic Medicine VOL-34,No6(Nov-Dec 1972)13)
Beecher HK cited from pain tolerance: Difference according to age sex and race Kenneth M.Window,MP,G aryP,Friedman, MP,A.BSiegelank, MS and Morris F Collen MS,Psychosomatic Madicine VOL-34 ,No 6 (Nov-Dec 1972)14)
Tophoff MMWA cited from pain tolerance : Difference according to age sex and race Kenneth M.Woodrow MP, Gary P,Friedman,MP,A.BSiegelank, MS and Morris F Collen MS,Psychosomatic Medicine VOL-34,No 6 (Nov-Dec 1972)35
FCollen MS, Psychosomatic Medicine VOL-34,No 6 (Nov-Dec 1972)
16)
Gender difference in pressure pain threshold in healthy humans Chesterton LS, Barlas P,Foster NE. Baxter GD, Write cc pmide – 12583868.17)
Pressure algometer in healthy subjects: inter- examiner variability, Antonaci , F,Sand T,Lucas GA,Scand J Rehab Med 1998 March ;30 (1);3-818)
Pressure pain threshold determination in oral mucosa,Ogimoto T,Ogawa T,Sumiyoshi K.Koyonok,Joral Rehab 2002 jul;29(7)620-6.19)
Reliability of clinical pressure pain algometric measurements obtained on consecutive days, Nussbaum EL, Downes L, Phys Ther 1998 Feb ;78(2);160-9.20)
A comparison of pressure pain detection in people with low back pain and volunteers without pain, R.jason, S.Giesbrecht and Michele C Battie, Phys Ther Vol 85, no 10, Oct 2005 pp 1085-92.36
22)
Documentation of myofacial trigger points Fisher AA,Arch phys Med Rehab 1988 Apr 69(4);286-91.23)
The effect of changing the painful stimulus upon fibromyalgia, White KP,McCain GA,Trunks E.J Musculoskleton Pain 1(1):43-58, 1993.24)
Susan L Michovitz 3rd edition pg294.25)
Pain threshold analysis in patients with osteoarthritis of hip, Susan L O’ Driscoll, Malcom IV Jayson,British Medical journal 1974, 3.714,715.26)
Reassessment of H reflex recovery curve using the double stimulation procedure, yasuhiro kagamihara, MD,Phd,Akito Hayashi MD, Phd, Yasoichi Nakajima MD, Phd, Masanori Nagaoka MD, Phd ,Muscle Nerve 21:352-360,199827)
The effect of two intensities of massage on H-reflrx amplitude, Joanne Goldberg, S John Sullivan,Derek E Seaborne, Phys There vol 72 num 6 June 199228)
Reliability of pain threshold measurement in young adults, Stuart Cathcart, Donald Pritchard, 2005, volume 4 number1.37
30)
A comparison of variability of pain rating and pain threshold in women with trapezius myalgia, Kerstien ,waling, Gunneni Sundelin, Leif Nilson, Bengt Jarvholm, Vol 3, Nim 4/Dec 1 2001. Short term reproducibility of pressure pain threshold in masseter and temporalis muscle of symptom free subjects, Isselec H,DC Laat A, Lesaffre E,Lysen R, Europ J oral sci : 1997Dec , 105(6):583-731)
Reproducibility of visual analogue scores to mechanical pressure Goddard G,Karibe H,MC Neill CCranio 2004 Jul; 22(3):250-32)
Sensitivity of H- reflex and stretch reflex to presynaptic inhibition in humans, Morita H, Petersen N, Chridtersen LO,Sinkjar T, Nielsen J.PMID-9705454.33)
The H reflex in passive human soleus muscle is modulated faster than predicted from post activation depression, Voigt38
35)
Posture related changes of soleus H refleexitability, Fatima Goulart,Josep Valles –Solle MD,and Ramiro Alvarez D,Muscle nerve 23:925-932,2000.36)
Intensity and duration threshold for aerobic exercises induced analgesia to pressure pain, Hoffman MD,Shepanski MA,Rubel SB,VAILLE I, Buckwalter JB, Cliffored PS, Arch phys Med Rehab 2004 Jul 85 (7);1183-7.39
APPENDIX – I
Selection schedule
Name : Age : Gender :
40
APPENDIX –II
1.Visual analogue scale :
It is line which is of 3.9 inches (10 cm) At the beginning it is no pain and at the end it is severe pain.
2.Algometer :
41
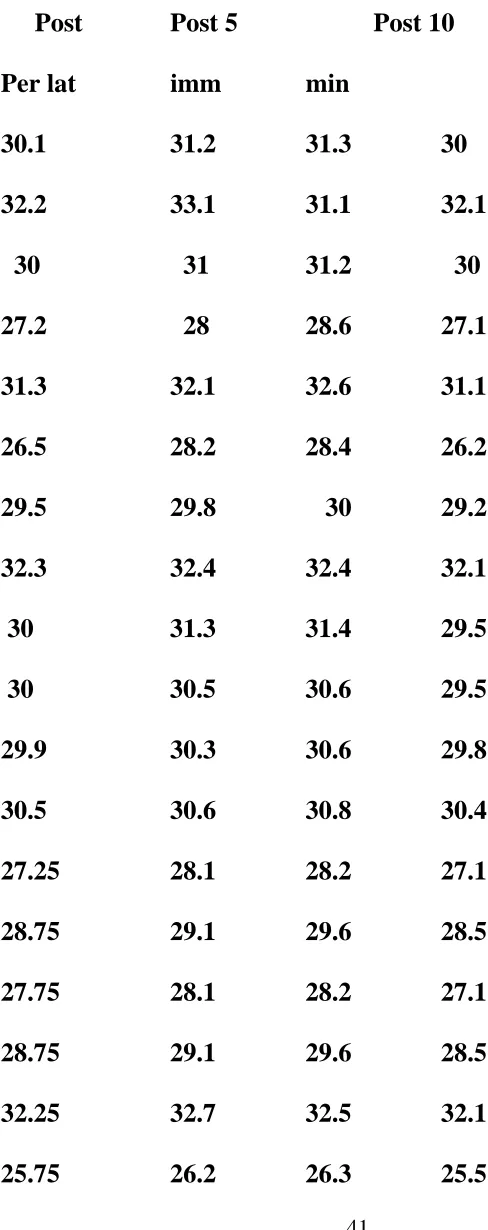
[image:49.612.144.388.125.740.2]APPENDIX – III
Table for H-reflex Latency.
Post Post 5 Post 10
Per lat imm min
30.1 31.2 31.3 30
32.2 33.1 31.1 32.1
30 31 31.2 30
27.2 28 28.6 27.1
31.3 32.1 32.6 31.1
26.5 28.2 28.4 26.2
29.5 29.8 30 29.2
32.3 32.4 32.4 32.1
30 31.3 31.4 29.5
30 30.5 30.6 29.5
29.9 30.3 30.6 29.8
30.5 30.6 30.8 30.4
27.25 28.1 28.2 27.1
28.75 29.1 29.6 28.5
27.75 28.1 28.2 27.1
28.75 29.1 29.6 28.5
32.25 32.7 32.5 32.1
42
30.1 31.3 31.4 30
30 30.5 30.6 29.9
31.3 32.4 32.5 31.1
29.5 31.5 31.6 29.1
30 31.5 31.6 29.4
32.2 32.7 32.8 29.9
27.2 28.9 28.9 27
26.5 26.9 27 26.3
32.2 32.8 32.9 32
30 30.5 30.6 29.8
28.65 29.2 29.3 28.4
25.6 26.7 26.8 25.5
43
APPENDIX-IV
Table for H-reflex amplitude
Pre amp Post imm after 5min after 10 min
5.6 5.4 5.5 5.7
5.1 5 5 5.2
4.8 4.7 4.7 4.9
4.5 4.4 4.4 4.4
5.4 5.3 5.4 5.5
5 4.8 5 5
5 4.9 5 5
4.8 4.7 4.7 4.9
3.8 3.7 3.7 3.9
5 4.9 4.8 5.1
4.5 4.4 4.4 4.7
4.5 4.4 4.5 4.7
4.5 4.4 4.4 4.7
4 3.9 3.9 4
3.25 3 3.1 3.26
6.25 5.5 5 6.26
5 4.5 4.6 4.9
44
5 4.5 4.6 5.2
3.8 3.5 3.6 3.9
5.1 4.5 4.6 5.2
4.5 4.3 4.4 4.6
5 4.5 4.6 5.1
4.8 4.2 4.3 4.9
5 4.5 4.6 5.1
4 3.5 3.6 4.3
5 4.8 4.9 5.2
45
APPENDIX - V
Padmavathi college of Physiotherapy
Dharmapuri.
Consent Form
I……… agree to take part in the research study, conducted by ……… Post of graduate student (M.P.T.- Specify) Padmavathy College of Physiotherapy,
I acknowledge that the research study has been explained to me and I understand that agreeing to participate in the research means that I am willing to
* Provide information and complete questionnaire (if any) my health status to the researchers(s)
* Allow the researcher(s) to have access to my medical / academic / professional records, pertaining to the purpose of the study.
* Participate in evalutory / therapy / observatory program for duration of ……… days / weeks.
* Make myself available for further interview (s) / follow up