“EVALUATION OF THE INTERVENTRICULAR SYSTOLIC RELATIONSHIP IN PATIENTS WITH RIGHT VENTRICULAR APICAL PACING WITH VENTRICULAR INHIBITED PACING
MODE BY ECHOCARDIOGRAPHY USING MITRAL AND TRICUSPID ANNULAR PLANE SYSTOLIC EXCURSIONS”
Dissertation submitted to
THE TAMIL NADU DR. M.G.R. MEDICAL UNIVERSITY
In partial fulfillment of the requirements for the award of the degree of
D.M. BRANCH - II CARDIOLOGY
MADRAS MEDICAL COLLEGE
RAJIV GANDHI GOVERNMENT GENERAL HOSPITAL, CHENNAI 600 003
THE TAMIL NADU DR. M.G.R. MEDICAL UNIVERSITY CHENNAI, INDIA
CERTIFICATE
This is to certify that the dissertation entitled “EVALUATION OF THE INTERVENTRICULAR SYSTOLIC RELATIONSHIP IN PATIENTS WITH RIGHT VENTRICULAR APICAL PACING WITH VENTRICULAR INHIBITED PACING MODE BY ECHOCARDIOGRAPHY USING MITRAL AND TRICUSPID ANNULAR PLANE SYSTOLIC EXCURSIONS” is the bonafide original work of Dr.S.SRIKUMAR,
in partial fulfillment of the requirements for D.M. Branch-II (CARDIOLOGY) examination of THE TAMILNADU DR.M.G.R. MEDICAL UNIVERSITY to be held in August 2013.The period of postgraduate study and training was from August 2010 to July 2013.
Prof. V.KANAGASABAI, M.D., Dean
Madras Medical College and Rajiv Gandhi Government General Hospital,
Chennai-600003.
Prof. V. E.DHANDAPANI, M.D., D.M. Professor and Head of the Department Department of Cardiology
Madras Medical College and
Rajiv Gandhi Government General Hospital,
DECLARATION
I, Dr.S.SRIKUMAR, solemnly declare that this dissertation entitled, “EVALUATION OF THE INTERVENTRICULAR SYSTOLIC RELATIONSHIP IN PATIENTS WITH RIGHT VENTRICULAR APICAL PACING WITH VENTRICULAR INHIBITED PACING MODE BY ECHOCARDIOGRAPHY USING MITRAL AND TRICUSPID ANNULAR PLANE SYSTOLIC EXCURSIONS” is a
bonafide work done by me at the department of Cardiology, Madras Medical College and Government General Hospital during the period 2010 – 2013 under the guidance and supervision of the Professor and Head of the department of Cardiology of Madras Medical College and Government General Hospital, Professor V.E.Dhandapani M.D.D.M. This dissertation is submitted to The Tamil Nadu Dr.M.G.R Medical University, towards partial fulfillment of requirement for the award of D.M. Degree (Branch-II) in Cardiology.
Place: Chennai Date:
ACKNOWLEDGEMENTS
A great many people made this work possible. I thank my Dean for allowing me to
conduct this study.
My warmest respects and sincere gratitude to our beloved Prof V.E.Dhandapani,
Professor and Head of the Department of Cardiology, Government General Hospital,
Chennai who was the driving force behind this study. But for his constant guidance, this
study would not have been possible.
I am indebted to Prof. M.S.Ravi, Prof K.Meenakshi, Prof. D.Muthukumar, Prof.
N.Swaminathan and Prof. G.Ravishankar without whom, much of this work would not have
been possible.
I acknowledge Dr.S.Venkatesan for the many useful comments he made during this
project.
In addition, I am grateful to Dr.G.Palanisamy, Dr.Moorthy, Dr.G.Prathap kumar,
Dr.C.Elangovan, Dr.Rajasekar Ramesh, Dr.S.Murugan, and Dr.G.Manohar, for their
support and guidance.
I also thank all my patients for their kind cooperation.
Lastly, I thank all my professional colleagues for their support and valuable
CONTENTS
CERTIFICATE DECLARATION
ACKNOWLEDGEMENT SERIAL
NO TITLE
PAGE NO
1 INTRODUCTION 1-2
2 AIMS & OBJECTIVES 3
3 LITERATURE REVIEW 4-32
4 MATERIALS & METHODS 33-36
5 RESULTS 37-49
6 DISCUSSION 50-55
7 CONCLUSION 56
BIBLIOGRAPHY APPENDIX:
GLOSSARY OF ABBREVIATIONS AND ACRONYMS
SPECIMEN PROFORMA
PATIENT INFORMATION SHEET PATIENT CONSENT FORM
MASTER CHART
ETHICAL COMMITTEE APPROVAL LETTER
INTRODUCTION
The right (RV) and left (LV) ventricles differ markedly in shape and
myocardial contractile element density. Despite these differences, the
synchronous electrical excitation and mechanical contraction of both the
ventricles and the ventricular interdependence maintains the biventricular
function in balance 13. This is known as ventricular synchrony. Certain disease
states like ischemic heart disease (IHD), acute pulmonary embolism, conduction
disorders like left bundle branch block (LBBB), preexcitation, and ventricular
pacing alters this balance resulting in ventricular dyssynchrony.
RV apical permanent pacemaker implantation (PPI) with ventricular
inhibited pacing (VVI) mode is known to produce ventricular dyssynchrony by
abnormal electrical and mechanical activation of the ventricles. Long-term RV
apical pacing is also associated with detrimental effects on cardiac structure and
left ventricular (LV) function15. Echocardiographic evaluation of LV and RV
systolic function by measuring mitral annular plane systolic excursion
(MAPSE) 8 and tricuspid annular plane systolic excursion (TAPSE)9 and their
ratio (MAPSE/TAPSE ratio)12 has been shown to correlate with ventricular
synchrony in normal healthy individuals. M-mode echocardiographic evaluation
of MAPSE, TAPSE, and their ratio can provide information regarding the
AIMS AND OBJECTIVES
1. To assess the systolic function of left and right ventricle by mitral
and tricuspid annular plane systolic excursions in patients with VVI pacing.
2. To analyse the interventricular systolic relationship using
REVIEW OF LITERATURE
Conduction System of the Heart
Automaticity
The inherent ability of the electrically active cells of the heart to
spontaneously depolarize resulting in electrical activation of the heart is known
as automaticity. The sinoatrial (SA) node is the dominant pacemaker of the
heart, consisting of a collection of pacemaker cells, located in the upper portion
of the right atrium (RA), close to the insertion of the superior vena cava (SVC).
The SA nodal discharge typically produces a heart rate of around 70 beats per
minute (bpm) in a healthy person. The SA nodal discharge rate responds to
various physiological events and increases heart rate during exercise, fever and
emotional stress, and decreases heart rate during rest or increased vagal tone.
These changes are mediated by the changes in the neural balance maintained
between the sympathetic and the vagal system.
The intrinsic discharge rate of the atrial myocardial cells is usually
around 40-50 bpm and hence are suppressed by the higher rate of discharge by
the SA node. But occasionally, atria may show increased automaticity leading
to an atrial premature contraction (APC) or an atrial tachycardia. In addition,
slowing of the sinus heart rate can allow the atrioventricular (AV) node to
40 or 50 bpm31. Myocardial ischemia, myocarditis, digitalis toxicity and cardiac
surgery can lead to a more rapid junctional rhythm called non-paroxysmal
junctional tachycardia.
The ventricle is at the bottom of the hierarchy. In patients with complete
heart block (CHB), the sinus nodal discharge does not reach the ventricle in a
one-to-one ratio due to the block. So, the ventricle starts discharging producing
a ventricular escape rhythm. This rhythm, in the presence of complete heart
block, is ominous and usually occurs at a very slow rate of around 20-30 bpm.
This extremely slow rhythm is potentially lethal as it results in prolongation of
the QT interval which may precipitate polymorphic ventricular tachycardia
(VT).
Sinus Node and Atrium:
The sinus node is located subepithelially in the high RA near the junction
of SVC. SA nodal cells undergo spontaneous depolarization at a rate of
approximately 60-100 bpm. The electrical discharge from the SA node is not
routinely recorded with electrophysiologic studies and standard intracardiac
catheters. The sinus node is highly responsive to a variety of physiologic
stimuli, adjusting the discharge rate by going slow or fast, as appropriate. This
physiological response by the SA node can be reproduced to some extent by
The atrium is the chamber that conducts electrical discharge from the
sinus node down to the AV node. Cardiac myocytes are electrically coupled
with one another through the gap junctions. These gap junctions allow the
transmission of electrical impulses to travel through the atrial myocardium
towards the AV node. The gap junctions are mainly composed of intercellular
adhesion molecules called connexions. This atrial depolarization forms a P
wave on the electrocardiogram. The total time taken for the transmission of
impulses through the atria to the AV node is approximately 100 msec. The atria
also function as conduits for the returning venous blood that is pushed into their
respective left (LV) and right (RV) ventricles. The atrial contribution to
ventricular filling accounts for as much as 30% of the total stroke volume. This
in turn results in an improvement in cardiac output through the Frank-Starling
mechanism. Maintaining atrioventricular synchrony is an important goal with
dual-chamber pacemakers.
AV Node:
The atria are separated from the ventricles by the two atrioventricular
valves and their supporting fibrous tissue. This fibrous skeleton essentially acts
as an insulator preventing the simultaneous electrical activation of the upper and
lower chambers. The only normal electrical pathway between the atria and the
ventricles is the through the AV node which is situated subepithelially in the
The electrical impulses from the SA node travelling down towards the
ventricles are slowed down by the AV node. This atrioventricular delay is
approximately 80 msec. This brief delay in the conduction of the depolarization
wave from atria to the ventricles, also known as “electrical modulation”, has
great functional significance because this delay allows the blood to be emptied
near completely from the atria into the ventricles. This atrial contraction
augmented emptying of blood accounts for an additional contribution to the
end-diastolic ventricular volume by approximately 30%, thus allowing for more
efficient cardiac output.
The AV node is responsive to both vagal and sympathetic input.
Heightened vagal activity in trained athletes can result is marked slowing of the
heart rate, producing asymptomatic episodes of intermittent block in the AV
node. The delayed AV nodal conduction may further get impaired in certain
disease states like degenerative nodal calcification and myocardial ischemia,
resulting in atrioventricular conduction blocks, including complete heart block,
necessitating ventricular pacemaker. The AV node also has the property of
retrograde conduction, allowing ventriculo-atrial (VA) conduction during
ventricular tachycardias and ventricular pacing.
His-Purkinje System:
The electrical activity from the SA node that has been briefly slowed in
of the specialized conduction system of the heart having rapid conducting
properties. The Purkinje fibers are very long fibers with abundant
concentrations of gap junction. This contributes to the very high conduction
speeds of 3-4 m/sec in the His-Purkinje as opposed to the relatively slow
conduction (0.3-1 m/sec) speed of the working myocardium.
The initial portion of this part of the conduction system is the bundle of
His and is a fairly thick bundle of cells. The His-Purkinje system is essentially a
trifascicular network. The bundle of His almost immediately splits into the two
components of the Purkinje system: the right and left bundle branches. The left
bundle is further divided into the left anterosuperior and left posteroinferior
fascicles. This can be explained teleologically as a rapidly conducting electrical
system that spreads through the LV and RV myocardium to allow almost
simultaneous, synchronized, contraction of the ventricles. The recent advance in
cardiac resynchronization therapy (CRT) for congestive heart failure (CHF)
represents an effort to reproduce this effect. Disruption of these bundles is quite
common and results in left bundle branch block (LBBB) and right bundle
branch block (RBBB) which are routinely diagnosed on surface
electrocardiogram (ECG). The clinical significance of these blocks is dependent
on the clinical scenario and can range from completely benign to pathological.
The ventricular myocardium is electrically isolated from the His-Purkinje
system in all the regions except at the Purkinje-myocardial junction. The
regions of the ventricular myocardium that are activated earliest are the RV
anterolateral wall and the LV inferolateral wall. This is followed by early apical
activation, and further spread of the electrical impulses occur in a apex-to-base
sequence. Simultaneously, there also occurs endocardial-to-epicardial spread of
excitation front. The last parts of the RV to be activated are the AV sulcus and
the pulmonary conus. Similarly, the last part of the LV to be activated is the
posterobasal area. The time interval between the impulses arriving at the His
bundle and the first ventricular activation is around 20 msec. The complete
ventricular activation is completed in around 60-80 msec.
Mechanical activation under physiological states:
The electrical activation of the heart results in mechanical contraction of
the myocardial fibers, mediated by the process of “electro-mechanical
coupling”. The spontaneous depolarization of the SA nodal cells is followed by
spread of the depolarization wave along the entire cardiac conduction system.
This results in the opening up of the calcium (Ca2+) channels in the surface of
the myocardial cells, resulting in increased calcium entry into the cells. This
calcium further mediates the release of more calcium from the sarcoplasmic
reticulum (SR) through calcium-induced calcium release (CICR) channels,
Calcium then binds with the troponon-C protein causing activation of the
troponin complex. This is followed by an increase in the actin-myosin
interaction which produces myocardial fiber contraction.
Ventricular contraction is followed by relaxation of the myocardial fibers.
At the end of myocardial contraction, with the depletion of adenosine
triphosphate (ATP), the calcium ions dissociate themselves from the troponin
complex and are released into the cytoplasm. This released calcium is removed
from the cytoplasm by two major systems: the reuptake of calcium into the SR
by the sarcoplasmic reticulum Ca2+-ATPase (SERCA) and the efflux of
calcium outside of the cells through the sarcolemmal sodium-calcium exchanger
(NCX) pump. The SERCA mechanism is the dominant mechanism accounting
for the removal of upto 80% of the cytoplasmic calcium under physiological
states and the NCX accounts for upto 10-15% of total calcium efflux. This
finally results in myocardial relaxation.
Interventricular relationship and Ventricular dyssynchrony
Synchronous Ventricular Contraction:
The left ventricle (LV) and the right ventricle (RV) differ markedly
in shape, thickness and density of the myocardial contractile elements. In spite
of these differences, both the ventricles function in a smooth and coordinated
synchronous excitation of the cardiac conduction system as well as the
contraction of the myocardial fibers. The electrical activation of the heart begins
in the sinoatrial (SA) node and spreads through the atrioventricular (AV) node
to the His bundle, bundle braches and Purkinje fibers finally resulting in the
activation of the myocardial fibers through the Purkinje-myocardial coupling.
The His-Purkinje system is extremely important in maintaining the synchronous
activity of the myocardium, because of its widespread distribution in the
ventricles and unique propagation properties. The result of this is a high degree
of coordinated mechanical contraction between remote regions of the
myocardium.
Ventricular dyssynchrony:
Ventricular dyssynchrony can be defined as an abnormality of the
normal, organized electromechanical coupling of the ventricles and this
disturbance is the consequence of an intra or interventricular conduction delay1.
Ventricular dyssynchrony results in the early electrical activation of the RV
before LV activation. Also, RV depolarization and mechanical contraction
occurs earlier followed by LV depolarization and mechanical contraction. This
altered ventricular activation sequence has the following hemodynamic effects :
(i) Reduction in the LV contractility
(iii) Mitral regurgitation due to delayed activation of the posteromedial
papillary muscle
(iv) Paradoxical septal motion resulting in reduced contribution of the
interventricular septum (IVS) to LV stroke volume
These hemodynamic effects are particularly troublesome in patients with
heart failure resulting in progressively downhill course with increased morbidity
and mortality.
Electrical dyssynchrony is defined by an abnormally widened
surface QRS duration exceeding 120 msec in any electrocardiographic limb
lead. Mechanical dyssynchrony refers to presence of abnormal activation
timing within or between the ventricles as evidenced by echocardiography2.
Types of Ventricular Dyssynchrony:
Left ventricular dyssynchrony occurs in the settings of impaired
ventricular interaction and is of 3 types:
1. Atrioventricular dyssynchrony resulting from atrial and ventricular activation occurring out of phase.
3. Intraventricular dyssynchrony resulting from differential activation among the various segments of the LV itself.
Echocardiographic assessment of Ventricular dyssynchrony:
Atrioventricular dyssynchrony is assessed echocardiographically by
measuring the LV diastolic filling time (DFT) using pulsed wave doppler
(PWD) in the apical 4-chamber view. DFT is measured from the beginning of
the E- wave to the end of the A wave in the mitral inflow velocity recordings.
Atrioventricular dyssynchrony is present if the DFT is < 40% of the cardiac
cycle.
Interventricular dyssynchrony is currently best assessed by measuring the
interventricular mechanical delay (IVMD). IVMD is defined as the time
difference between left and right ventricular pre-ejection intervals measured by
PWD. The pre-ejection intervals are measured from the beginning of the QRS
complex to the beginning of the pulmonary (Q-PV) or aortic ejection (Q-AV).
Normal IVMD is < 40 milliseconds (ms). Interventricular dyssynchrony is
present if IVMD is > 40 ms3. Tissue doppler imaging (TDI) is also used in the
assessment where any delay between the onset of systolic motion between the
basal RV free wall and the most delayed LV segment is measured. A delay > 56
Intraventricular dyssynchrony is assessed by various methods, but the
two most widely accepted methods are:
(i) M-mode echocardiographic measurement of septal-to-posterior
wall motion delay (SPWMD). SPWMD is obtained in the parasternal short axis
view at the papillary muscle level by measuring the delay between the peak
systolic excursion of the anterior (septal) and the posterior walls. SPWMD
value of 130 ms or more is considered abnormal 4.
(ii) Color-coded TDI showing a delay ≥ 65ms between any two walls
( usually between septal and lateral walls) from QRS onset to peak contraction,
assessed in either the apical 3-, 4-, or 5-chamber view. The color-coded TDI
method is the most preferred method for assessing intraventricular
dyssynchrony and patient outcomes5.
Mitral Annular Plane Systolic Excursion (MAPSE)
Mitral annular ring:
The harmony of the mitral valve opening and closure, and LV filling and
emptying is maintained by the anatomical integrity of the “left atrial- mitral
valve-left ventricular complex”. An essential component of this complex is the
mitral annular ring providing support to the mitral valve. During LV contraction
and relaxation, this mitral annular ring also undergoes a complex motion
motion in a sphincter-like fashion, and rotation. The base-to-apex motion of the
mitral annular ring was first described in details by Zaky et al6.
LV systolic function by echocardiography:
Left ventricular systolic function is traditionally assessed by
echocardiography using a variety of parameters including LV ejection fraction
(LVEF), using either Teichholz method or modified Simpson method, LV
fractional shortening (LVFS), LV fractional area change (LV FAC), LV outflow
tract acceleration time, and mitral dP/dt. Among these, the most widely
accepted and used parameter is the LVEF. Left ventricular ejection fraction is a
measure of the LV systolic function along both its circular and longitudinal axis
and reduced ejection fraction has been correlated with prognosis, both short
term and long term, in various heart diseases.
Longitudinal motion of left ventricle:
The systolic contraction and diastolic relaxation of the LV myocardium is
mediated mainly by two groups of muscle fibers: longitudinal fibers present in
the subendocardial layer, subepicardial layers as well as in papillary muscles,
and circular muscle fibers present predominantly in the subepicardial layer.
During myocardial contraction, the longitudinal fibers begin to contract earlier
In disease states with altered contractility, both the longitudinal and
rotational motion of the myocardium is affected. But, it has been shown by
Bolognesi et al that in diseased states like myocardial ischemia or infarction, the
longitudinal motion is affected first7. Thus, echocardiographic evaluation of
longitudinal motion of myocardium may help in diagnosing cardiac dysfunction
at an early stage of disease process itself.
Mitral annular plane systolic excursion:
MAPSE is an echocardiographic parameter useful in assessing the
longitudinal function of the left ventricle. It is measured by M-mode
echocardiography by placing the patient in the left lateral position and obtaining
an apical-4-chamber view. The M-mode beam is placed along the lateral
annulus of the mitral valve and the maximal excursion of the mitral annular
plane in systole is measured. The annular plane is identified in M-mode
recording as the first continuous line seen immediately below the LV cavity.
The normal range for MAPSE is 12 +/- 2 mm (men: >13 mm and women
>11 mm). Values less than 10 mm is considered abnormal and correlates with
LVEF and cardiac dysfunction. Reduction in the MAPSE has been
demonstrated in many disease states like ischemic heart disease, acute
myocardial infarction, severe aortic stenosis, cardiomyopathies. The systolic LV
function as assessed by MAPSE has also been shown to have high correlation
Tricuspid Annular Plane Systolic Excursion (TAPSE)
Tricuspid annular ring and its motion:
Similar to the left side of the heart, the coordinated functioning of the
right sided chambers is effectively maintained by the “right atrial-tricuspid
valve-right ventricle complex” and tricuspid annular ring is an essential
component of this complex. The contractile elements of the right ventricle (RV)
are predominantly aligned in the longitudinal axis of RV. So, during RV
systole, the myocardial shortening takes place mainly in the longitudinal plane.
This systolic longitudinal motion of the RV is best assessed by TAPSE.
RV systolic function by echocardiography:
RV systolic function can be assessed echocardiographically by various
parameters. But, the parameters that have been widely accepted and used are
right ventricular index of myocardial performance (RIMP), TAPSE,
two-dimensional RV fractional area change (2D RV FAC) and tissue
Doppler-derived tricuspid lateral annular systolic velocity (S’). Various cut-off points for
distinguishing normal and abnormal states for each of the above parameters
have been defined. In the recent years, the significance of TAPSE in evaluating
Tricuspid annular plane systolic excursion:
TAPSE is measured using mode echocardiography by placing the
M-mode beam along the lateral annulus of the tricuspid valve in the
apical-4-chamber view. The difference in the distance between the tricuspid annulus and
the RV apex during systole and diastole as obtained in M-mode
echocardiography gives the measure of TAPSE.
Normal value for TAPSE is 18mm or above. Values below 17mm is
considered abnormal RV function. Various studies have shown significant
correlation between low levels of TAPSE and RV function in many disease
states including acute myocardial infarction, pulmonary embolism, cor
pulmonale. Samad et al showed that in patients with first myocardial infarction,
lower TAPSE levels were associated with worse outcomes and higher mortality
9
. Their study showed that patients with a TAPSE value < 15mm had a
significantly high mortality of 45% at 2 years as compared to patients with
TAPSE levels >20mm who had a low mortality of around 4%. Lower levels of
TAPSE has been shown to be a predictor of poor outcomes in patients having
dilated cardiomyopathy and pulmonary hypertension10.
Gupta.S et al in their study to evaluate the interventricular relationships
and ventricular dyssynchrony in patients with heart failure observed that
patients with LV systolic dysfunction had significantly reduced levels of
TAPSE, and levels were highest for those without any ventricular
dyssynchrony. The association between TAPSE and LV dyssynchrony was
found to be independent of the RV and LV ejection fraction. In conclusion, they
remarked that TAPSE may serve as a useful indicator of LV dyssynchrony,
especially because it is both easily measurable and reproducible 11.
The main advantages of TAPSE are: it is a simple, readily available,
easily reproducible parameter that can be repeated as needed and does not need
any specialized echocardiographic machine. But there are certain disadvantages
of using TAPSE because it measures the longitudinal motion of the RV at one
plane and assumes that this is reflective of global RV function. Also, TAPSE
may be angle-dependent and so needs precise alignment of the M-mode beam
parallel to the RV free wall- tricuspid annulus plane for obtaining correct
values. Based on the above evidences from various studies, as well the
advantages, American Society of Echocardiography (ASE) recommends that
TAPSE should be used routinely as a simple method of estimating RV function,
with a lower reference value for impaired RV systolic function of 16 mm 25.
MAPSE/TAPSE Ratio
The left and right ventricular interrelationship is the most important
normal healthy individuals. This relationship may get altered in various disease
states like ischemic heart disease, acute myocardial infarction, arrhythmias,
constrictive pericarditis, cardiac tamponade, RV dysfunction due to pulmonary
hypertension, pulmonary embolism, and cor pulmonale. The assessment of this
relationship using echocardiography has been an area of interest for many
decades and various parameters have been described. A novel approach using
MAPSE/TAPSE ratio has recently been described for the quantitative
assessment of interventricular systolic relationship 12.
Bruhl et al, in their pilot study, evaluated 51 healthy personnel using
resting echocardiography for the quantitative assessment of interventricular
relationship by measuring MAPSE, TAPSE, MAPSE/TAPSE ratio, peak
annular systolic velocity of left (LVs) and right (RVs) ventricles by M-mode
and tissue Doppler method12. They also further analyzed these parameters for
variance across age, gender and body surface area (BSA). They found that
TAPSE was greater than MAPSE by over 54.5% (22.1 ± 2.9 mm vs 14.3 ±2.6
mm) and MAPSE/TAPSE ratio was 0.66 ± 0.14. These relationships were
remarkably consistent regardless of age, sex or BSA. Similarly consistent
results were also noted with the TDI derived parameters. Based on these
observations, the investigators concluded that MAPSE/TAPSE and LVs/RVs
ratios are good surrogate measures of left and right ventricular systolic
Bruhl et al, also suggested that, despite the markedly reduced muscle
mass, the consistently higher RV systolic excursions along the longitudinal
plane and systolic velocities compared to the LV parameters, was due to the
relatively low pulmonary vascular resistance against which the RV contracts
compared to the systemic vascular resistance 12. Also, upto 80% of RV stroke
volume is due to systolic contraction along its longitudinal axis, while
contraction along this plane accounts only for 60% of LV stroke volume and the
rest of the contraction involves circular and torsional movements13.
The normal MAPSE/TAPSE ratio may be altered by disease states
involving either side of the ventricles. The clinical application of this novel
parameter involves conditions producing RV dysfunction like pulmonary
hypertension, acute pulmonary emboli and RV infarctions as well as conditions
producing LV dysfunction like aortic stenosis, acute myocardial infarction. The
ratio may also be altered in dyssynchronous ventricular contraction states like
right (RBBB) and left bundle branch block (LBBB), RV or LV pacing and
accessory pathway conduction.
Permanent Pacemaker Implantation (PPI)
Ever since the development of implantable cardiac pacemakers in the mid
20th century, cardiac pacing has remained the mainstay of therapy in managing
patients with both bradyarrhythmias and tachyarrhythmias. In recent years, the
failure and hypertrophic cardiomyopathy. However, the most important
indications for cardiac pacing are atrioventricular blocks and sick sinus
syndrome.
There are various types of pacemakers and they are described by the
Pacemaker code system developed by the NASPE/BPEG14 (Table.A).
Table.A NASPE/BPEG Generic Code for Antibradycardia Pacing
POSITION I II III IV V
Category Chamber(s) paced Chamber(s) sensed Response to sensing Rate modulation Multisite pacing O = None O = None O = None O = None O = None
A = Atrium A = Atrium T =
Triggered
R = Rate modulation A = Atrium V = Ventricle V =
Ventricle I = Inhibited
V = Ventricle D = Dual (A
+ V)
D = Dual (A + V)
D = Dual (T + I)
D = Dual (A + V) Manufacturers’
designation only
S = Single (A or V)
S = Single (A or V)
Application of magnet over a pacemaker converts the pacemaker
programming into asynchronous mode of operation like DOO, AOO, or VOO.
In the case of ICDs, magnet application does not alter the programmed pacing
function, but does inhibit the detection of ventricular tachycardia (VT) /
The various types of pacemakers have their advantages and disadvantages
that are dependent on the timing cycle of individual pacemaker mode.
Ventricular Inhibited Pacing (VVI):
The most commonly used mode in PPI is the VVI mode. VVI pacing
mode is capable of sensing a ventricular event and responds by inhibiting the
pacemaker output. VVI pacemakers have a period of refractoriness after a paced
or sensed ventricular event, during which any ventricular event is not sensed.
This interval is called the ventricular refractory period. During this period,
ventricular events do not reset the cycle timing. VVI pacing is especially
protective in life threatening bradycardias. The main disadvantage of VVI
pacing mode is the lack of AV synchrony.
Atrial Inhibited Pacing (AAI):
AAI pacing mode has timing cycles similar to VVI pacing, but the major
difference is that both pacing and sensing takes place from the atrium and
responds to a sensed atrial event by inhibiting the pacemaker output. An atrial
event, either paced or sensed, is followed by a refractory period similar to VVI
pacing during which no intrinsic atrial event changes delivery of the next pacing
stimulus. The next atrial pacing stimulus is delivered when the first atrial timing
pacemaker programming, an AAI pacemaker should not sense ventricular
events. The only exception to this rule is “far-field sensing” where a large
ventricular signal may inappropriately be sensed by the atrial lead, resulting in
resetting of the atrial timing. This abnormality can be partially corrected by
decreasing the sensitivity of the atrial channel or by prolonging the atrial
refractory period.
AV Sequential, Non–P-Synchronous Pacing (DDI):
DDI pacing mode is characterised by dual-chamber sensing, which
prevents competitive atrial pacing. The response of the DDI ventricular mode is
inhibition only. There is no tracking of P waves and hence, pacing occurs only
at the programmed rate. DDI is rarely a preferred mode, but it is still a
programmable option in most of the current dual-chamber pacemakers. The
DDI pacing mode can be particularly helpful during intermittent atrial
tachyarrhythmia as it results in atrial undersensing and thereby prevents mode
switching.
Dual-Chamber Pacing and Sensing with Inhibition and Tracking (DDD):
In the DDD mode, the basic timing circuit associated with lower rate
pacing is divided into two intervals: the ventriculoatrial (VA) interval and the
atrioventricular interval (AVI). The AVI results in AV sequential pacing, which
Alternately, it may be initiated by a native P wave producing subsequent
ventricular pacing.
Rate-Adaptive Sensors:
Incorporation of rate-adaptive sensor in the pacemaker provides rate
responsiveness when the sensor is on, based on changes in the level of physical
activity. Rate-adaptiveness of a pacing mode is represented by adding an R in
the fourth position of the code (e.g., VVIR, AAIR, DDIR, and DDDR). The
sensors most commonly used are the accelerometer which is based on activity,
and minute ventilation, based on measuring transthoracic impedance.
Right ventricular apical pacing with VVI mode
Due to the ease of site accessibility and stability of the pacemaker lead,
the pacing lead in the endocardium is traditionally positioned at the right
ventricular apex. In general, patients tolerate pacing from the RV apical position
very well and is effective in relief of symptoms. However, it is now known that
adverse effects, may arise from RV apical pacing, on cardiac structure and LV
function15. This may be related to the altered electrical and mechanical
activation pattern of the ventricles (i.e, ventricular dyssynchrony) caused by RV
apical pacing.
During RV apical pacing, the electrical activation sequence of the
ventricles is altered. The RV apex where the lead is positioned is activated first,
followed by the spread of the electrical impulses to other regions of the right
and left ventricle. This spread of electrical activation takes place through the
ventricular myocardium and not through the His-purkinje conduction system.
The result of this abnormal spread of the electrical wave front is slow
propagation and also heterogenous mechanical activation of the ventricles,
similar to that of LBBB. The consequence of this abnormal activation, is that,
the total time required for activation of the entire ventricular myocardium,
expressed as QRS duration, is at least twice that during normal sinus rhythm. In
most cases, the site of earliest mechanical activation is the interventricular
septum. This single breakthrough at the interventricular septum is followed by
abnormal activation of other regions of the ventricles and the last part of
activation at the inferoposterior base of the LV16.
RV apical pacing thus results in changes, not only of the initiation of
mechanical contraction, but also in the sequence of mechanical contraction. The
regions of the RV that are near the pacing site and hence are activated early
show early meachanical coupling with rapid systolic contraction. This causes
the regions that are activated later to be stretched due to this early contraction.
These regions that are late-activated, thereby undergo a delayed systolic
that are at present undergoing premature relaxation. The end result of these
abnormal contraction patterns involving different regions of the LV is a
redistribution of myocardial strain and work which produces a contraction that
is comparatively less effective.
RV apical pacing and its detrimental effects:
The altered sequences of electrical activation and mechanical contraction
of the ventricles in RV apical pacing may result in a variety of detrimental
effects on the metabolism, perfusion dynamics, remodelling, hemodynamics
and mechanical function. Long-term RV apical pacing can cause changes in
both regional perfusion and oxygen demands of the myocardium, resulting in
myocardial perfusion defects, mainly in regions near the pacing site, in upto
65% of patients even in the absence of underlying obstructive coronary artery
disease (CAD).
Chronic RV apical pacing may also cause abnormal LV remodelling, like
asymmetrical hypertrophy of the RV and LV myocardium. The regions of
myocardium that are activated early undergo thinning while the late-activated
regions undergo thickening. The abnormal contraction sequence may result in
ventricular dilation during long-term RV pacing. Progressive LV dilation may
also cause functional mitral regurgitation that also gradually worsens. Left atrial
(LA) remodelling is another consequence of chronic RV pacing that may result
Histopathological changes in the ventricular myocardium include
intercellular and intracellular alterations showing myofiber disarray and
degenerative fibrosis, variations in the mitochondrial organisation, abnormal
expression of myocardial contractile proteins. There also occurs a gradual
reduction in protein kinases and proteins associated with calcium homeostasis17.
Abnormality in the sequence of electrical and mechanical activation of
the LV may result in global mechanical dysfunction and associated adverse
hemodynamic properties. Pacing at the RV apex and associated dyysynchrony
results in longer durations of the isovolumic contraction (IVC) and isovolumic
relaxation (IVR) phases of the cardiac cycle. This may result in altered filling
and contractile properties of the LV with a resultant decrease in cardiac output.
Alterations in myocardial strain and timing of regional strain also may occur
during RV apical pacing resulting in varying degrees of mechanical
dyssynchrony.
Evidence from Pacing Mode Trials:
The association between a high percentage of RV apical pacing and
adverse clinical outcomes has been shown by a number of large randomized
clinical trials on pacing mode selection.
The investigators of the MOST (Mode Selection Trial), through a
hospitalization due to heart failure and atrial fibrillation in patients who had
both the physiological dual-chamber pacing (DDDR) and single-chamber
ventricular pacing [VVIR]”18. It was noted that ventricular pacing for more than
40% of the time in the DDDR group was associated with an increased risk of
hospitalization for heart failure (hazard ratio [HR]: 2.60; 95% confidence
interval [CI]: 1.05 to 6.47; p< 0.05). Similarly, ventricular pacing for more than
80% of the time in the VVIR group was also associated with a higher risk of
heart failure hospitalization (HR: 2.50; 95% CI: 1.44 to 4.36; p< 0.05). The
results of the MOST study demonstrated that the cumulative percentage of
ventricular pacing is a strong predictor of hospitalization for heart failure in
patients with a normal baseline QRS duration. There was also a linear
association between the cumulative percentage of ventricular pacing and an
increased risk of atrial fibriilation.
In the DAVID (Dual Chamber and VVI Implantable Defibrillator) trial19,
patients with underlying indication for defibrillator implantation, but without
any indication for antibradycardia pacing, were randomized to receive either
physiologic pacing using DDDR mode with lower rate of 70 beats/ min or
ventricular backup pacing using VVIR mode with lower rate of 40 beats/min.
The median follow-up period was 8.4 months. The primary outcome measures
studied were: (i) freedom from death and (ii) absence of hospitalization for new
in the DDDR group (relative hazard: 1.61; 95% CI: 1.06 to 2.44; p< 0.03).
Importantly, the investigators noted that patients with a high pacing percentage
at the 3-month follow-up had a pattern toward a worse survival at 12 months 19.
The above trials concluded that there is absence of any clinical benefit of
physiologic DDDR pacing over VVIR. The reason for the absence of significant
benefit in these studies was explained by the short programmed AV interval that
caused a higher percentage of ventricular pacing in the DDDR groups. Thus, the
beneficial effect of maintaining AV synchrony by physiologic DDDR pacing
may be neutralized by the deleterious effects due to RV apical pacing itself.
Unfortunately, these trials did not provide conclusions about the exact
amount of RV apical pacing that is associated with negative effects on the
cardiac function. Ventricular pacing, by means of maintaining physiologic AV
synchrony, may in reality be beneficial to a certain extent. But, certain patient
populations are more likely to be prone to the negative effects of RV apical
pacing , especially, patients with underlying conduction disorder, ischemic heart
disease, patients requiring pacing for a longer period of time and patients with
reduced LV function at baseline20.
Mechanisms of mechanical dyssynchrony during RV apical pacing:
Mechanical dyssynchrony secondary to right ventricular apical pacing
can result in both interventricular dyssynchrony as well as intraventricular
The extent of ventricular dyssynchrony and the activation sequence
during abnormal conduction are determined, at least by four myocardial
properties which as follows:
a) Myocardial fibers conduct electrical impulses slower by up to four
times compared to conduction through the Purkinje system.
b) Velocity of conduction along the length of the muscle fibers is
approximately two times than perpendicular to them. Therefore,
the pacing site is surrounded by an elliptical-shaped wave front,
particularly in the epicardial and midmyocardial layers21.
c) Reentry of impulses that originate from the working myocardium
into parts of the rapidly conducting His-Purkinje system is rare.
Even though Purkinje-myocardial junctions are present to
facilitate the transmission of electrical impulses
from the conduction system into the myocardium, the reverse is
not true. So, in majority of cases, the myocardial activation
sequence during ventricular pacing is determined predominantly by
slow conduction through the normal myocardium, away from the
pacing site.
d) Conduction of impulses through most of the endocardial fibers is
of the endocardium is smaller than its epicardial counterpart.
So, total electrical activation time is shorter with LV endocardial
pacing compared with LV epicardial pacing22.
In heart failure patients, an increased risk of cardiac morbidity and
mortality has been proven in the presence of ventricular dyssynchrony. In
addition, the LV systolic function and functional capacity of the patients is also
reduced in patients with mechanical dyssynchrony following long term RV
apical pacing. Cardiac resynchronization therapy (CRT) results in normalization
of LV systolic function by restoring the synchronized cardiac contraction
thereby improving the functional capacity23. This suggests that there is a direct
relationship between abnormal activation pattern (LBBB-like pattern) during
RV apical pacing or ventricular dyssynchrony and a deterioration of LV
function. Therefore, valuable information can be obtained from assessing
MATERIALS AND METHODS
This was a prospective case control study done between March 2012 and
February 2013 at the department of cardiology, Government General Hospital
Chennai. The study cohort comprises of 40 patients, who had permanent
pacemaker implantation done (RV apical pacing with VVI mode) more than one
year back, who attended the Pacemaker clinic of our department for follow-up.
The patients with the presence of any comorbid conditions like diabetes
mellitus, hypertension, ischemic heart disease were excluded from the study.
The control group consists of 30 age matched healthy individuals. Patients and
controls both belonged to the age group of 30- 75 years. Informed, written
consent was obtained from all the patients and controls. The study protocol was
evaluated and approval was obtained from the Institutional Ethics Committee.
Inclusion criteria:
All patients with VVI pacemaker implantation (with RV apical pacing)
done between one to two years before the start of the study period.
Exclusion criteria:
1. Known case of IHD, MI or regional wall motion abnormalities
2. Known case of cardiomyopathy, heart failure or LV dysfunction
4. Diabetes mellitus
5. Hypertension
6. Chronic kidney disease
7. Chronic lung disease
Patient evaluation:
All of the 40 patients and controls were subjected to the following
assessment:
1. Detailed history taking
2. Thorough clinical examination
3. Standard 12-lead electrocardiogram, especially the paced QRS
(pQRS) duration
4. Echocardiographic evaluation
Echocardiographic examination:
Echocardiographic examination was done with a 2.5 MHz transducer
using the Esaote myLab equipment available in our Echo lab. The examination
was done with the patients in the left lateral decubitus position.
Echocardiographic examination and measurements were recorded according to
The LV end diastolic and end systolic volumes were measured from the
apical 4- and 2- chamber views using the modified Simpson method and LV
ejection fraction was calculated from the volumes obtained. The patients were
analyzed under two groups: normal (LV EF>55%) and reduced (LV EF <55%)
LV systolic function. Presence of LV diastolic dysfunction was assessed in the
apical 4-chamber view with the pulsed wave Doppler sample placed at the
mitral inflow region. The presence of any associated mitral regurgitation was
noted by the standard protocols. Mitral (MAPSE) and tricuspid (TAPSE)
annular plane systolic excursions were measured in the apical 4-chamber view
by placing the M-mode cursor along the lateral annulus of the mitral and the
tricuspid valves. The difference in the distance between the mitral annulus and
the LV apex during systole and diastole was obtained in M-mode
echocardiography to get MAPSE. Similar measurements of the tricuspid annular
excursions during systole and diastole were obtained to get TAPSE. The
MAPSE/TAPSE ratio was calculated from the above values. MAPSE value of
10mm or less and TAPSE value of 16mm or less were considered abnormal.
Based on the suggestions by Bruhl et al and the observed values of controls in
our study, a MAPSE/TAPSE ratio of <0.64 was taken as the cut-off for the
presence of interventricular dyssynchrony.
Baseline demographic and clinical characteristics for continuous
Student’s t-test. The study population was also divided into 3 groups based on
age including those < 40 years, 40-60 years, and > 60 years old as well as by
sex. Comparison of multiple echo measurements across age groups was done by
Analysis of variance (ANOVA). For all measurements, a two-sided P-value of
less than0.05 was considered statistically significant. All statistical analysis was
performed using SPSS for Windows, version 17.0, SPSS Inc, Chicago, Illinois,
RESULTS
The study population included 40 patients with VVI pacemaker
implantation and 20 healthy controls. The average age of the patients was 50.35
± 11.28 years and of the control group was 49.21± 8.82 years. The average
percentage of males and female in both the groups was 55% and 45%
respectively (Fig.1). There was no difference in the age or sex distribution
between the two groups. Baseline profile and echocardiographic parameters of
the study population is given in Table.1.
[image:41.595.116.452.358.634.2]Among the 40 patients, 28 (70%) patients had CHB and 12 (30%)
patients had SSS as the underlying conduction disorder for pacemaker
implantation (Fig.2). All the patients had undergone pacemaker implantation
before 1 to 2 years from the start of the study period. The average pQRS
duration in the patient group was 162.5 ± 8.39 msec and in the control group
[image:42.595.190.497.312.532.2]was 107.05 ± 11.18 msec (P<0.0001).
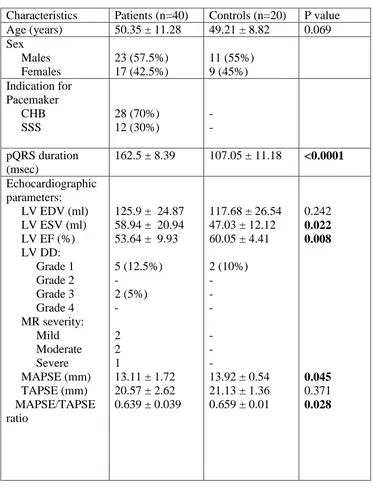
Table.1 Baseline characteristics
Characteristics Patients (n=40) Controls (n=20) P value Age (years) 50.35 ± 11.28 49.21 ± 8.82 0.069 Sex Males Females 23 (57.5%) 17 (42.5%) 11 (55%) 9 (45%) Indication for Pacemaker CHB SSS 28 (70%) 12 (30%) - - pQRS duration (msec)
162.5 ± 8.39 107.05 ± 11.18 <0.0001 Echocardiographic
parameters: LV EDV (ml) LV ESV (ml) LV EF (%) LV DD: Grade 1 Grade 2 Grade 3 Grade 4 MR severity: Mild Moderate Severe MAPSE (mm) TAPSE (mm) MAPSE/TAPSE ratio
125.9 ± 24.87 58.94 ± 20.94 53.64 ± 9.93 5 (12.5%) - 2 (5%) - 2 2 1
13.11 ± 1.72 20.57 ± 2.62 0.639 ± 0.039
117.68 ± 26.54 47.03 ± 12.12 60.05 ± 4.41 2 (10%) - - - - - -
13.92 ± 0.54 21.13 ± 1.36 0.659 ± 0.01
0.242 0.022 0.008 0.045 0.371 0.028
The LV systolic function assessed by EF in the patient group was reduced
significantly compared to the controls (53.64 ± 9.93% vs 60.05 ± 4.41%; P =
0.008). Among the 40 patients, 15 (37.5%) had reduced EF <55% suggesting
underlying LV systolic dysfunction. The mean MAPSE was 13.11 ± 1.72 mm in
the patients compared with average MAPSE of 13.92 ± 0.54mm (P = 0.045) in
control groups. LV diastolic dysfunction of grade 3 was noted in 2 patients (5%)
with pacemaker who had severe LV dysfunction . There was no severe LV
diastolic dysfunction in the control group.
The mean TAPSE values, suggestive of RV systolic function, were also
lesser in the patient group compared to the controls, though not statistically
significant (20.57 ± 2.62 vs 21.13 ± 1.36; P=0.374).
The average MAPSE/TAPSE ratio in the normal healthy controls was
0.659 ± 0.01and 0.63 ± 0.033 in the patiens (P=0.028). As mentioned
previously, a cut-off value of 0.64 for MAPSE/TAPSE ratio was taken as
suggestive of ventricular dyssynchrony. The patients were further subdivided
into two groups: MAPSE/TAPSE ratio below 0.64, and equal to or above 0.64,
and correlation of these values with other echocardiographic parameters of
Table.2 Measured pQRS duration and echocardiographic variables by age.
Parameters Age <40 years (n=8) Age 40-60 years (n=24) Age >60 years (n=8) P value (ANOVA) pQRS duration (ms)
155.62 ± 4.95 162.08 ± 6.90 170.62 ± 9.03 0.001
LV EF (%) 58.7 ± 6.17 55.51 ± 7.96 42.96 ± 11.47 0.001
MAPSE (mm) 14.06 ± 0.87 13.45 ± 1.42 11.12 ± 1.77 0
TAPSE (mm) 22.57 ± 1.24 20.81 ± 2.34 17.83 ± 2.31 0
MAPSE/TAPSE ratio
0.63 ± 0.033 0.64 ± 0.038 0.62 ± 0.04 0.431
(ANOVA- Analysis Of Variance)
Patients with VVI pacing were divided into three age groups of less than
40 years, 40-60 years and more than 60 years (Table.2) and the multiple
Echocardiographic parameters were analyzed by ANOVA. There was a
statistically significant correlation for increasing age with QRS duration on the
ECG and LV EF (Fig.3). Patients with age above 60 years had markedly
prolonged pQRS duration (mean: 170.62 ± 9.03 msec) thereby increasing the
risk of electrical dyssynchrony and also reduced LV EF (mean: 42.96 ± 11.47
%) compared to the other age groups. No significant association between age
Fig.3 showing the relationship between increasing age, paced QRS duration and LV function
Table.3 Measured pQRS duration and echocardiographic variables by gender
Male (n=23)
Female (n=17)
P value
pQRS duration (ms)
163.26 ± 7.77 162.77 ± 10.60 0.86
LV EF (%) 53.98 ± 8.61 51.54 ± 13.33 0.48
MAPSE (mm) 13.44 ± 1.69 12.49 ± 1.80 0.097
TAPSE (mm) 21.06 ± 2.43 19.61 ± 2.98 0.098
MAPSE/TAPSE ratio
0.64 ± 0.038 0.63 ± 0.041 0.431
There was no difference either in the pQRS duration or echo derived
[image:46.595.66.490.464.705.2]Table.4 Measured pQRS duration and echocardiographic variables by
indication for pacemaker
CHB (n=28)
SSS (n=12)
P value
pQRS duration (ms)
162.5 ± 9.37 162.5 ± 5.83 1.00
LV EF (%) 52.33 ± 11.25 56.69 ± 4.97 0.207
MAPSE (mm) 12.74 ± 1.86 13.97 ± 0.89 0.036
TAPSE (mm) 20.38 ± 2.93 21.00 ± 1.71 0.499
MAPSE/TAPSE ratio
0.62 ± 0.03 0.66 ± 0.02 0.0001
(CHB- Complete heart block, SSS- Sick sinus syndrome)
The underlying indication for pacemaker implantation did show an
influence on ventricular synchrony (Table.4). Patients who had underlying CHB
had a lower MAPSE levels compared with patients who had SSS (12.74 ± 1.86
vs 13.97 ± 0.89; P = 0.036). They also had a more marked reduction in the
MAPSE/TAPSE ratio than the SSS group (0.62 ± 0.03 vs 0.66 ± 0.02; P =
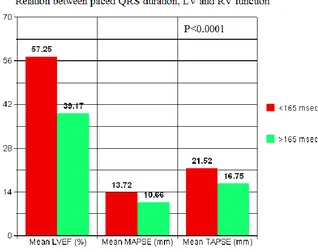
[image:47.595.66.455.147.394.2]Table.5 Measured echocardiographic variables by pQRS duration
QRS duration ≤ 165 ms (n=33)
QRS duration > 165 ms
(n=7)
P value
LV EF (%) 57.25 ± 5.93 39.17 ± 9.75 <0.0001
MAPSE (mm) 13.72 ± 1.18 10.66 ± 1.33 <0.0001
TAPSE (mm) 21.52 ± 1.83 16.75 ± 1.57 <0.0001
MAPSE/TAPSE ratio
0.639 ± 0.039 0.635± 0.041 0.80
Patients with marked prolongation of the pQRS duration (>165 ms) had
lower LV EF (39.17 ± 9.75 vs 57.25 ± 5.93; P <0.001) than patients with lesser
Fig.4 showing the relationship between paced QRS duration, LV and RV function
Both MAPSE and TAPSE were also significantly reduced in patients with
pQRS duration >165ms as compared to patients with pQRS duration < 165 ms.
However, there was no difference in the MAPSE/TAPSE ratio between the two
Table.6 Measured pQRS duration and echocardiographic variables by LVEF
LV EF ≥55% (n=25)
LV EF <55% (n=15)
P value
pQRS duration (ms)
158.8 ± 5.25 168.66 ± 9.15 <0.0001
MAPSE (mm) 14.1 ± 0.66 11.46 ± 1.69 <0.0001
TAPSE (mm) 22.12 ± 0.87 17.98 ± 2.52 <0.0001
MAPSE/TAPSE ratio
0.637 ± 0.037 0.64 ± 0.043 0.81
(LV EF- LV ejection fraction)
When patients were analyzed based on the presence of normal
LVEF (>55%) and reduced LVEF (<55%), the paced pQRS duration, MAPSE
and TAPSE were significantly reduced in the group with LV dysfunction
compared with the group with normal LV function (Table.6 and Fig.5 & 6).
However, there was no difference in the MAPSE/TAPSE ratio between the two
Fig.5 showing the linear relationship between LVEF and MAPSE.
[image:51.595.121.419.391.637.2]Fig.7 showing percentage of patients with LV dysfunction by MAPSE
Out of the 40 patients studied, 4 patients (10%) had MAPSE <10 mm
suggestive of LV dysfunction (Fig.7)
Fig.8 showing percentage of patients with RV dysfunction by TAPSE
The same 4 patients had TAPSE <16mm suggestive of associated RV
[image:52.595.193.451.440.650.2]Table.7 Measured pQRS duration and echocardiographic variables by
MAPSE/TAPSE ratio
MAPSE/TAPSE ratio <0.64
(n=19)
MAPSE/TAPSE ratio >0.64
(n=21)
P value
LV EDV (ml) 130.43 ± 24.88 121.82 ± 24.73 0.279 LV ESV (ml) 63.37 ± 23.61 54.92 ± 17.83 0.206 LV EF (%) 52.75 ± 10.30 54.44 ± 9.77 0.059 pQRS duration (ms) 162.89 ± 9.32 162.14 ± 7.67 1.00
The patients were then subdivided into two groups based on the
MAPSE/TAPSE ratio: patients with LV dyssynchrony (ratio <0.64) and no LV
dyssynchrony(ratio > 0.64) and, relationship if any, with pQRS duration, LV
functional parameters was assessed. Nearly 50% (19) of the patients had
MAPSE/TAPSE ratio <0.64 suggesting the presence of some degree of LV
dyssynchrony. But, there was no statistically significant difference noted
between the two groups in these variables (Table.7). However, there was a trend
towards an association between lower MAPSE/TAPSE ratio and reduced LV
[image:53.595.78.522.149.298.2]DISCUSSION
Single chamber RV pacing using VVI pacemaker is the most common
type of pacemaker implantation done worldwide for various conduction
disorders. The advantages of VVI pacing, in terms of survival benefit is well
known. But, long term RV apical pacing is also associated with detrimental
effects on the cardiac structure and function. Prior studies have showed the
adverse effects of RV apical pacing on both LV and RV function. Chronic RV
apical pacing is also known to result in some degree of ventricular
dyssynchrony due to the altered electrical activation pattern.
Chronic VVI pacing and LV function
Paxinos G et al, in their study, evaluated LV function in patients with sick
sinus syndrome who had undergone VVI pacing and showed that VVI pacing in
the long term resulted in reduction in LV EF26. In our study, all the patients
studied had undergone pacemaker implantation between 1 to 2 years before the
start of the study. The patient group had a lower LV EF compared to the control
group (53.64 ± 9.93% vs 60.05 ± 4.41%; P = 0.008). This shows that the
Determinants of LV dysfunction in VVI pacing
Among the patients with VVI pacing, in our study, LV dysfunction as
assessed by reduced LV EF (<55%) was present in 15 (37.5%) patients. The
major factors affecting the reduction in LV function were the paced QRS
duration, age of the patient and underlying prior CHB.
The paced QRS complex duration is a major determinant in the adverse
effects of chronic VVI pacing. Su Y et al, proved in their study that paced QRS
duration ≥ 180 ms is associated with progressive LV dilation and worsening LV
EF27. In our study also, the patients with paced QRS duration >165 ms had
significant reduction in the LV EF, MAPSE and TAPSE compared to patients
with lesser duration of paced QRS complex.
Advancing age was a major determinant affecting LV function. Those
patients above the age of 60 years had more marked prolongation of the paced
QRS complex and higher reduction in the LV EF. The biventricular function
assessment did not show significant difference between males and females.
In our study, patients with underlying CHB as the indication for
pacemaker implantation had significantly lower MAPSE and MAPSE/TAPSE
ratios compared to patients with SSS. This difference may possibly be due to
the VVI pacemaker to maintain the heart rate. As a result of this, the ventricles
are continuously contracting out of phase, resulting in early onset of LV
dysfunction. In contrast, the presence of intermittent intrinsic rhythm in patients
with sick sinus syndrome, reduces the repetitive pacing discharges; thereby
lowering the detrimental effects of chronic VVI pacing on the ventricular
function.
Mitral regurgitation in VVI pacing
The development of mitral regurgitation of varying degrees in VVI
pacing had been demonstrated in previous studies29. In our study also, moderate
to severe MR was present in 3 (8%) patients. It was demonstrated by Sassone B
et al that the functional MR developing in pacemaker implantation was due to
the presence of both AV dyssynchrony and alteration in the ventricular
activation sequence, with the latter playing the major role30.
Role of MAPSE and TAPSE
Those patients with reduced LV EF <55% had significantly increased
QRS duration compared to patients with normal LV function. There was a
linear correlation between levels of LV EF below 55% and reduction in MAPSE
The usefulness of MAPSE as a surrogate marker of LV systolic function
was demonstrated previously by Pai R G et al28. In our study, 10% of
pacemaker group had reduced MAPSE (<10mm) and there was a linear
correlation between MAPSE levels and reduced LV EF. These 10% patients
also had lower TAPSE (<16mm) possibly due to biventricular dysfunction as a
result of ventricular dyssynchrony.
In our study, the absolute value of TAPSE was more than MAPSE in both
the patient and control by around 50%. This further favours the previous
conclusion by various studies(12-13) that the tricuspid annular plane systolic
movement is more than mitral annular movement during systole. This is
explained by the predominant systolic movement of the RV along its
longitudinal axis compared to the LV systolic movement along longitudinal,
circular and radial axis13.
MAPSE/TAPSE ratio and interventricular dyssynchrony in VVI pacing
Bruhl et al concluded in their study that concluded that MAPSE/TAPSE
and LVs/RVs ratios are good surrogate measures of left and right ventricular
systolic relationship and interdependence12. In their study, MAPSE/TAPSE
ratio was 0.66 ± 0.14 in normal healthy individual and concluded that reduced
levels of this ratio can be used to study interventricular relationship and
ventricular dyssynchrony. In our study, the average MAPSE/TAPSE ratio in the