Dissertation on
THE SPECTRUM OF THYROID ABNORMALITIES IN LIVER
DISEASE AND ITS CORRELATION WITH LIVER FUNCTION
Submitted to
THE TAMILNADU DR. M.G.R. MEDICAL UNIVERSITY
CHENNAI – 600 032
In partial fulfillment of the regulations
For the Award of the Degree of
M.D.
(GENERAL
MEDICINE)
BRANCH
‐
1
MADRAS MEDICAL COLLEGE
CHENNAI – 600 003
CERTIFICATE
This is to certify that the dissertation titled “A STUDY ON THE SPECTRUM OF THYROID ABNORMALITIES IN LIVER DISEASE AND ITS CORRELATION WITH LIVER FUNCTION” is the bonafide original work of Dr. ANWAR C VARGHESE in partial fulfillment of the regulation for M.D. Branch–I (General Medicine) Examination of the Tamilnadu Dr. M.G.R Medical University to be held in MARCH 2010. The Period of study was from January 2009 to August 2009.
Prof.A.RADHAKRISHNAN,M.D
Professor Of Medicine, Madras Medical College and Research Institute,
Govt. General Hospital, Chennai – 600 003.
Prof. C.RAJENDIRAN, M.D
Director, and professor
Institute of Internal Medicine,
Madras Medical College and Research Institute,
Govt. General Hospital, Chennai -600 003.
Prof.J MOHANASUNDARAM,M.D
Dean
Madras Medical College and Research Institute,
DECLARATION
I, Dr ANWAR. C. VARGHESE, solemnly declare that dissertation
titled “A STUDY ON THE SPECTRUM OF THYROID
ABNORMALITIES IN LIVER DISEASE AND ITS CORRELATION
WITH LIVER FUNCTION” is a bonafide work done by me at Madras
Medical College and Govt. General Hospital from August 2008 to October 2009
under the guidance and supervision of my unit chief PROF.A
RADHAKRISHNAN, MD, Professor of medicine.
This dissertation is submitted to Tamilnadu Dr. M.G.R Medical
University, towards partial fulfillment of regulations for the award of M.D.
Degree (Branch – I) in General Medicine.
Place : Chennai.
Date : Dr. ANWAR. C. VARGHESE
Post graduate student, MD general medicine.
Madras Medical College and Research Institute,
ACKNOWLEDGEMENT
I would like to thank my beloved Dean, Madras Medical College
Prof J. MOHANASUNDARAM, M.D., for his kind permission to use the
hospital resources for this study.
I would like to express my sincere gratitude to my beloved Professor and Director, Institute of Internal Medicine Prof.C.Rajendran, M.D., for his
guidance and encouragement.
With extreme gratitude, I express my indebtedness to my beloved Chief and teacher Prof. A. Radhakrishnan, M.D., for his motivation, advice and
valuable criticism, which enabled me to complete this work.
I am extremely thankful to Assistant Professors of Medicine Dr G
Subburagavalu, M.D., and Dr A Aravind, M.D., Dr. Sridhar, M.D., for their
co-operation and guidance. I would like to offer a special word of gratitude to
Prof D Rajasekaran, M.D. for his advice and guidance.
I thank all Professors, Assistant Professors, and Post-graduates of Institute of biochemistry for their valuable support in biochemical analysis. I would always remember with extreme sense of thankfulness for the co-operation and criticism shown by my Postgraduate colleagues.
CONTENTS
S.NO TITLE
1 INTRODUCTION
2 ABBREVIATIONS
3 INTRODUCTION
4 REVIEW OF LITERATURE
5 MATERIALS AND METHODS
6 OBSERVATION AND RESULTS
7 DISCUSSION
8 LIMITATIONS OF STUDY
9 CONCLUSION AND SUMMARY
10 PROFORMA
12 ETHICAL COMMITTEE CERTIFICATE
13 BIBLIOGRAPHY
ABBREVIATIONS
INR- INERNATIONAL NORMALISED RATIO
MELD‐ MODEL FOR END‐STAGE
LIVER DISEASE
PBC‐ PRIMARY BILIARY CIRRHOSIS
PSC- PRIMARY SCLEROSING CHOLAMGITIS
RT3‐ REVERSE TRIIODOTHYROXINE
SGOT‐ SERUM GLUTAMIC‐
OXALOACETIC TRANSAMINASE
SGPT‐ SERUM GLUTAMIC‐PYRUVIC
TRANSAMINASE
TBG‐ THYROID BINDING
GLOBULIN
TIPS – TRANSJUGULAR
INTRAHEPATIC PORTOSYSTEMIC
ALD‐ ACUTE LIVER DISEASE
ALT‐ ALANINE AMINOTRANSFERASE
ANOVA‐ ANALYSIS OF VARIANCE
AST‐ ASPARTATE
AMINOTRANSFERASE
CAH‐ CHRONIC ACTIVE HEPATITIS
CL‐ CIRRHOSIS LIVER
CLD‐ CHRONIC LIVER DISEASE
CPS- CHILD PUGH SCORE D1‐ DEIODINASE 1
D2‐ DEIODINASE 2
D3‐ DEIODINASE 3
DCLD‐ DECOMPENSATED CHRONIC
LIVER DISEASE
FT3- FREE TRIIODOTHYRONINE
INTRODUCTION
“The difficulty lies, not in the new ideas, but in escaping the old ones,
which ramify, for those brought up as most of us have been, into every corner of
our minds.” Keynes, John Maynard
In most chronic illness, defects arise in thyroid hormone metabolism,
resulting in the sick euthyroid syndrome. This is characterized by a normal
total T4, normal/high free T4, low total T3, low free T3 and an elevated rT3.
These changes reflect a reduction in D1 activity, an increase in D3 and changes
in the plasma concentration of thyroid-binding proteins and free fatty acids
(which displace thyroid hormones from binding proteins) There are also
non-thyroidal influences on the hypothalamic-pituitary-thyroid axis, e.g. cortisol
inhibiting TSH secretion(1). It has been suggested that this syndrome may confer
a survival advantage, which adapts an organism to chronic illness by reducing
the basal metabolic rate within cells and thereby reducing caloric requirements.
In the different types of liver disease, similar processes may occur to
those seen in the sick euthyroid syndrome, but in addition a number of changes
specific to the type or stage of liver disease is also found. Many studies have
been carried out in liver disease patients assessing their thyroid status; mostly in
of patients in which these studies have been conducted. This study tries to find
out the relationship between thyroid function and liver disease in the context of
a tertiary care hospital in India. This study focuses on patients with
Aims
and
objectives
1. To determine the spectrum of thyroid abnormalities in both
chronic and acute liver disease patients admitted in medical wards in
Government General Hospital.
2. To compare the thyroid hormone levels in the liver diseases- both
acute and chronic patients to that of healthy controls.
3. To assess the correlation between thyroid function and the level
of liver dysfunction.
4. To assess the utility of thyroid function tests as a biomarker to
Review
of
Literature
In normal subjects, the thyroid gland secretes 110 nmol of thyroxine and
10 nmol of triiodothyronine each day(2). Tri-iodothyronine has a ten times
greater affinity and ten times greater efficacy than thyroxine for the nuclear
receptor, thus even though thyroxine is quantitatively secreted at much higher
levels, it should be regarded as a pro-hormone that requires deiodination and
conversion to T3 to become biologically active(3). There are three groups of
enzymes that regulate thyroid hormone metabolism, forming part of the
iodothyronine seleno-deiodinase enzyme system (type 1 = D1, type 2 = D2 and
type 3 = D3). They are responsible for the activation of T4 to T3, inactivation of
T4 to rT3 and the conversion of rT3 and T3 to T2.
The conversion of T4 to T3 in extra thyroidal tissue occurs through a rapidly
equilibrating pool via the D1 enzyme system and a slowly equilibrating pool
Via the D2 system. The type 1 deiodinase is mainly found in the liver and
kidney(4), and accounts for approximately 30–40% of extrathyroidal production
of T3 (12 nmol). The type 2 deiodinase is found in the pituitary, the CNS, and
skeletal muscle and contributes 60–70% of the extrathyroidal production of T3
group of enzymes, its kinetics, regulation and susceptibility to
propylthiouracil(6) are different. Although both the D1 and D2 system can also
inactivate T4 and T3, the major inactivator is the type 3 deiodinase system,
which primarily exhibits inner-ring deiodination (unlike the other systems). It is
found in the liver, skin and CNS, where it catalyses the conversion of T4 to rT3
and T3 to T2, both inactive metabolites; it also converts rT3 to rT2(7). This
enzyme system is also expressed in placenta, where it protects the foetus from
Structures
of
principal
iodothyronines
and
their
interactions
(1)
In addition to the central role in deiodination to activate and deactivate
thyroid hormones, the liver performs specific functions relating to thyroid
hormone transport and metabolism. The liver extracts 5–10% of plasma T4
during a single passage, as shown by studies using w131IxT4. This value is
much higher than can be accounted for by the amount of free T4 delivered to
for uptake[9]. An active stereospecific transport mechanism has been identified
for transporting T4 and T3 across the hepatocytes membrane. The intracellular
concentrations of the free hormone are higher than the plasma levels, and the
process is energy-dependent[10].
The liver synthesizes a number of plasma proteins that bind the lipophilic
thyroid hormones and thereby provide a large, rapidly exchangeable pool of
circulating hormone. The thyroid hormones are 99% bound to
thyroxine-binding globulin, thyroxine-thyroxine-binding prealbumin and albumin in plasma. The
free hormone component within plasma is in equilibrium with the protein-bound
hormone, and it is this free fraction which accounts for the hormone’s biological
activities. The plasma concentrations of free T4 and T3 are at a steady
concentration, so that the tissues are exposed to the same concentrations of the
free hormone. However, the free hormone concentrations in different tissues
vary according to the transport and deiodinase activity within specific tissues.
Thus tissue thyroid status depends not only on thyroxine secretion but also on
normal thyroid hormone metabolism, delivery of T3 to nuclear receptors and on
receptor distribution and function. Normal thyroid function, which is essential
for normal growth, development and the regulation of energy metabolism
Thyroid
abnormalities
in
specific
liver
diseases
Cirrhosis
liver
The most consistent thyroid hormone profile in patients with cirrhosis are
a low total and free T3[11] and an elevated rT3[12], similar changes to those in
the sick euthyroid syndrome, probably reflecting a reduced deiodinase type 1
activity, resulting in reduced conversion of T4 to T3. This results in an increase
in conversion of T4 to rT3 by the deiodanase type 3 system, and an increase in
the rT3 to T3 ratio. The plasma T3:rT3 ratio has a negative correlation with the
severity of cirrhosis when assessed in non-alcoholic cirrhotics[13]. Since T3 and
rT3 bind to the same plasma proteins, the
T3/rT3 ratio provides a parameter of liver function that is largely independent of
protein binding. Both the T3/rT3 ratio and free T3 levels in plasma thus
provide a correlate of liver function in cirrhosis, and are of prognostic value,
albeit seldom used[14]. The low total and free T3 levels may be regarded as an
adaptive hypothyroid state that serves to reduce the basal metabolic rate within
hepatocytes and preserve liver function and total body protein stores. There are
reports of improvement in liver function with the onset of hypothyroidism in
patients with cirrhosis. Controlled induction of hypothyroidism might therefore
be beneficial in cirrhotic patients[15], but further studies are required to test this
Acute
hepatitis
and
acute
liver
failure
In acute hepatitis of mild or moderate severity, patients have elevated serum
levels of total T4, due to increased thyroid-binding globulin[16], which is
synthesized as an acute-phase reactant, but normal levels of free T4. In more
severe cases with impending liver failure, the data is variable, and low total T4
levels may reflect reduced hepatocellular synthesis of thyroid-binding globulin.
Serum T3 levels are extremely variable, but the free T3:T4 ratio correlates
negatively with the severity of the liver disease and has prognostic value[16].
Again this probably reflects diminished type 1 deiodinase activity, resulting in a
reduced conversion of T4 to T3; in general, however, these patients are
clinically euthyroid. Some series have described patients with acute hepatic
failure (especially viral hepatitis) as having goitres that resolved with
improvement in liver function[17].
Specific
forms
of
chronic
liver
disease
In patients with chronic hepatitis associated with primary biliary cirrhosis
autoimmune thyroid disease[18, 19]. Thus abnormalities may arise from thyroid
gland dysfunction or as a consequence of the liver disease. Autoimmune
hypothyroidism is a prominent feature in PBC, occurring in 10–25% of
patients[20]. There is often an increase in total T4 in PBC, due to an increase in
thyroid-binding globulin levels and this may mask hypothyroidism,
emphasizing the need to perform a free T4 and TSH assay. Anti-thyroid
microsomal antibodies are common in PBC (34%), as are antithyroglobulin
antibodies (20%). Thyroid dysfunction may precede or follow the diagnosis of
PBC. In autoimmune hepatitis, both Grave’s disease (6%) and autoimmune
hypothyroidism (12%) are relatively common[19]. Primary sclerosing cholangitis
is associated with an increased incidence of Hashimoto’s thyroiditis, Graves’s
disease and Riedel’s thyroiditis[21].
In patients with chronic hepatitis who do not have co-existing
autoimmune liver and thyroid disease, total T4, total T3, thyroxine-binding
globulin levels are often increased, but TSH and free T4 levels are usually
normal, and patients are clinically euthyroid[22].
Patients with decompensated liver disease complicated by hepatic
encephalopathy subsequent to non-alcoholic cirrhosis were also found to have
exceedingly low serum FT3 and T4 levels. Depressed serum FT3 and T4 levels,
subgroup of decompensated non alcoholic cirrhotic patients prone to develop
hepatic encephalopathy.
Thyroid
abnormalities
associated
with
treatment
of
liver
disease
Currently the treatment of viral hepatitis with alpha interferon has added
another dimension to the abnormalities of thyroid function seen in chronic liver
diseases. In different studies assessing patients treated with alpha interferon for
hepatitis C, 2.5–10% developed thyroid dysfunction, with both thyrotoxicosis
(due to acute thyroiditis) and hypothyroidism being observed. Although the
reason is not altogether clear, the induction of an autoimmune reaction has been
postulated, resulting in the development of anti-thyroid and antithyrotrophin
receptor antibodies[23]. However, a distinct effect on intrathyroidal
organification of iodine has also been suggested[24]. The risk factors for
developing thyroid dysfunction with alpha interferon (which may persist after
discontinuation of the drug) are female sex, underlying malignancy, high doses
of long duration, combination immunotherapy (especially Il-2), and the
presence of antithyroid peroxidase antibodies prior to commencing
treatment[25,26,27]. It should be noted that interferon therapy causes weakness and
muscle aching, and in this setting the myopathy of hypothyroidism may be
thyroid antibodies) are performed prior to therapy, and subsequently monitored
at 3–6 month intervals during interferon therapy[28].
Overall, the majority of patients with liver disease are clinically
euthyroid, and this can be confirmed with a normal high sensitivity TSH test
and a normal free T4. The latter test is routinely performed and obviates the
need to take into account the variation in thyroid-binding globulin levels seen in
patients with liver disease.
Hypothyroidism
as
a
treatment
option
in
liver
disease
hypermetabolic state by thyroid hormone manipulation has been proposed as a treatment option for the hyperdynamic circulation observed in the portal hypertensive state
There is an interesting study demonstrating that hypothyroidism by chronic methimazole administration can alleviate the degree of liver injury and hepatic encephalopathy in bile-duct ligated cirrhotic rats[30]. However, the underlying mechanisms responsible for this phenomenon remain incompletely understood, but immunomodulation and minimization of oxidative liver injury are possible mechanisms. Further studies on the pathogenesis are needed to justify whether hypothyroidism can be used as a treatment option during conditions of liver injury and hepatic encephalopathy.
Liver
abnormalities
in
thyroid
disease
Hypothyroidism
Hypothyroidism may have features that mimic liver disease (pseudo-liver
disease): examples include myalgias, fatigue and muscle cramps in the presence
of an elevated aspartate aminotransferase from a myopathy[31], coma in
myxoedema coma[32], and myxoedema ascites[33]. Myxoedema ascites, generally
interpreted as an intrinsic liver defect or a phenomenon mimicking liver disease.
It had been proposed that the ascites was a consequence of chronic right-sided
heart failure, resulting in central scarring of the liver[34]. The liver biopsy
findings of central congestive fibrosis in a number of patients would support
this. However, another study reported normal right heart pressures, and
proposed that severe hypothyroidism caused enhanced permeability of vascular
endothelium, resulting in ascites and serous effusions throughout the body.
Following initiation of thyroid replacement therapy, myxoedema ascites
resolves over a few months. There is also evidence that hypothyroidism may
directly affect the liver structure or function. Hypothyroidism has been
associated in a few case reports with cholestatic jaundice attributed to reduced
bilirubin and bile excretion. In experimental hypothyroidism, the activity of
bilirubin UDP-glucuronyltransferase is decreased, resulting in a reduction in
bilirubin excretion[34]. The reduction in bile flow may be in part due to an
increase in membrane cholesterol-phospholipid ratio and diminished membrane
fluidity[34], which may affect a number of canalicular membrane transporters
and enzymes, including the Naq, Kq-ATPase. The triad of reduced bilirubin
excretion, hypercholesterolemia and hypotonia of the gall bladder seen in
hypothyroidism increases the incidence of gallstones[35]. Recent studies have
shown that the hepatic abnormalities associated with hypothyroidism can be
reversible over a matter of weeks with thyroxine replacement, with no residual
toxicity and diminish thioacetamide toxicity, but there is no evidence for this in
man[38,39].
Hyperthyroidism
The clinical features of hyperthyroidism are diverse, involving nearly
every system in the body. Liver injury caused by thyrotoxicosis is relatively
common, and can be conveniently divided into hepatitic or cholestatic types.
An increase in the aspartate aminotransferase (AST) and alanine
aminotransferase (ALT) was reported in 27% and 37% of patients
respectively[40], although the majority of these patients showed no other clinical
or biochemical features of liver impairment. The mechanism of injury appears
to be relative hypoxia in the perivenular regions, due to an increase in hepatic
oxygen demand without an appropriate increase in hepatic blood flow. In mild
cases, liver histology shows non specific changes, which on light microscopy
consist of a mild lobular inflammatory infiltrate consisting of polymorphic
neutrophils, eosinophils and lymphocytes, associated with nuclear changes and
Kupffer cell hyperplasia. A small proportion of patients have a progressive liver
injury, which histologically consists of centrizonal necrosis and perivenular
clinical presentation of this type of injury is usually that of a self-limiting
hepatitis; however, there are a few case reports of thyrotoxic patients presenting
with fulminant hepatic failure[41]. The precipitation of the clinical presentation is
generally attributable to the onset of cardiac failure, often precipitated by
arrhythmias[41].
Cholestatic
injury
An elevated serum alkaline phosphatase is seen in 64% of patients with
thyrotoxicosis[42]. However this is not necessarily liver-specific, as it can
originate from bone and/or liver. It is therefore important to look at elevations in
c-glutamyl transpeptidase (17%) and bilirubin (5%) as an indicator of
cholestasis[42]. In patients with cholestatic injury, the histological features are
similar to the nonspecific changes seen in hepatitic injury. However, in addition
there appears to be centri-lobular intrahepatocytic cholestasis[43]. Jaundice is
uncommon but when it occurs, complications of thyrotoxicosis (cardiac
failure/sepsis) or intrinsic liver disease need to be excluded. It is difficult to
establish which features seen in thyrotoxic liver injury are from tissue thyroid
status alone, and which are in combination with complications such as cardiac
failure, malnutrition and sepsis. It is probably impractical to try and separate the
causes out, as awareness of the presentation, complications and treatment are of
with fatty change to cirrhosis has been reported in untreated hyperthyroidism[43].
Modern therapies have made chronic liver disease a very rare complication of
hyperthyroidism[44]. In the vast majority of cases, the hepatic abnormalities
associated with hyperthyroidism are reversible, following the early recognition
and treatment of the disorder[44].
Hepatic Dysfunction Associated With Treatment of Hyperthyroidism
Increased serum levels of aspartate aminotransferase and alanine
aminotransferase occur in about 30% of patients treated with
propylthiouracil[45]. The rise in AST appears to be dose-related, so that AST and
ALT levels are highest during the first few weeks of treatment, falling rapidly
with a dose reduction[46]. In the majority of patients, serum aminotransferases
return to normal, with clinical improvement following withdrawal of treatment.
Rarely, a persistent hepatitis occurs with clinical, biochemical (elevated
bilirubin, AST and ALT) and histological features of hepatocellular necrosis[47].
This is an idiosyncratic reaction that can develop at any time, but usually occurs
within the first 2 to 3 months of treatment in about 1% of patients, usually
women aged -30 years. It is considered to be an allergic host response, which
generally resolves over a protracted period of time[48]. A small proportion of
patients develop fulminant hepatic failure, with the presence of severe acidosis
coagulopathy. Abnormalities of liver function are much less common with
carbimazole and methimazole. These agents induce cholestasis, as an
idiosyncratic reaction to the drug[49]. An elevation of the bilirubin, alkaline
phosphatase, and c-glutamyl transpeptidase levels are the predominant
abnormalities. Such liver dysfunction usually presents within 2–3 weeks of
initiation of treatment, and can persist for several months despite
discontinuation of the offending drug[50]. The predominant feature on liver
biopsy is intrahepatic cholestasis. Predicting the occurrence of hepatic injury in
individual patients is difficult, and it is therefore recommended that liver
function tests be performed in all patients within 3 months of commencing
therapy.
Other
thyroid
and
liver
interactions
The liver is the major site for cholesterol and triglyceride metabolism,
and the thyroid hormones play an integral part in hepatic lipid homeostasis.
Thyroid hormones increase the expression of LDL receptors on the
hepatocytes[51], and increase the activity of lipid-lowering liver enzymes,
resulting in a reduction in low-density lipoprotein levels[52]. Thyroid hormones
high-density lipoprotein[53]. The above effects of the thyroid hormones could be
beneficial in reducing the onset of atherosclerosis if they were elicited without
the deleterious effects, particularly cardiac effects such as atrial
arrhythmias[54,55]. A series of 3,5-diodo-3-aryl-substituted thyronines
have been developed, which show a potent cholesterol-reducing effect in
hypercholesterolaemic rats, without producing tachycardia. The tissue
selectivity of these agents was attributed to selective uptake by the liver rather
than TR subtype selectivity[56]. Subsequently, a series of novel thyronine type
derivatives (dimethyl-isopropylbenzylphenoxy- acetic acid) (GC-1) have
reduced serum cholesterol in rats, without tachycardia, by selective activation of
the TRb isoform.
Diseases
Affecting
both
Thyroid
and
Liver
Diseases causing diffuse infiltration like malignancies, amyloidosis and
hemochromatosis can cause both thyroid and liver dysfunction. Of the
infiltrating malignancies, non-Hodgkin’s lymphoma is the commonest cause,
and the presentation is usually dominated by goitre (with or without
lymphadenopathy), jaundice and a paraneoplastic illness[57]. Occasionally, other
as part of the presentation[58]. Secondary amyloidosis due to systemic
inflammatory diseases (e.g. Crohn’s, tuberculosis, familial Mediterranean
fever) is the commonest cause of amyloid deposition into the liver and thyroid
gland[59], characterized by the deposition of the serum amyloid A (AA)
protein[60]. The synthetic function of each organ is usually well maintained, thus
amyloid organ function is better followed by serial measurement of serum
amyloid A protein and amyloid P scintigraphy[61]. Transfusion-related iron
deposition (secondary hemochromatosis) can rarely cause multiple endocrine
abnormalities (including hypothyroidism) and cirrhosis from iron deposition
into the respective organ. The toxicity of the iron deposition into the thyroid
(and thus degree of hypothyroidism) is potentiated by hypoxia and anemia,
Drugs
Affecting
both
Thyroid
and
Liver
Diseases
Amiodarone is the most notable drug that effects both the liver (fibrosis)
and the thyroid gland (hypo/ hyperthyroidism), and its effects may remain even
following drug withdrawal[63]. The antimalarial drug mefloquine can cause a
self-limiting hepatitis and thyrotoxicosis from acute thyroiditis, but the
symptoms appear to resolve when the drug is withdrawn[64]. Another major drug
class affecting both organs is the anti-epileptics, of which carbamazepine
can cause hepatic impairment and subclinical hypothyroidism from abnormal
thyroid hormone metabolism[65]. Finally, the treatment of malignant disease
using radical radiotherapy regimes, including those containing 131I MIBG
and modern chemotherapy schedules have been associated with a greater degree
of toxicity affecting both organs[66]. Studies on the use of tri-iodothyronine as a
hepatic growth factor has shown it to be a primary mitogen for the liver in
animal models (i.e. it induces hepatocyte proliferation and increases liver mass
when administered at high doses in the absence of hepatic injury)[67]. The ability
to increase liver mass in the absence of liver damage, and to enhance
proliferation during compensatory hyperplasia after liver damage, could be
therapeutically valuable if applicable to man. More generally, the ability to
manipulate liver cell proliferation in vivo may be helpful in designing cell
Prognostic
markers
in
liver
disease
Identifying patients with poor prognosis is important in planning
treatment as well as in explaining the situation to the relatives of the patient.
Prognostication of these patients is usually done by clinical examination and
history. The introduction of liver cell transplantation as a very viable treatment
modality has increased the importance of accurate prognostication in liver
diseases. This has led to a search for newer biomarkers to better identify the
prognosis. Various scoring systems like Child-Pugh, MELD and others have
been devised to effectively identify patients with poor prognosis and those who
will benefit from liver transplantation. The various prognostic indictors used in
liver disease are briefly described below.
Child
–Pugh
score
Dr C.G. Child and Dr J.G. Turcotte of the University of Michigan first
proposed the scoring system in 1964 . It was modified by Pugh in 1972[69] . He
replaced Child's criterion of nutritional status with the prothrombin time or INR,
and thus eliminated the most subjective part of the score. Although it was
originally used to predict mortality during surgery, it is now used to determine
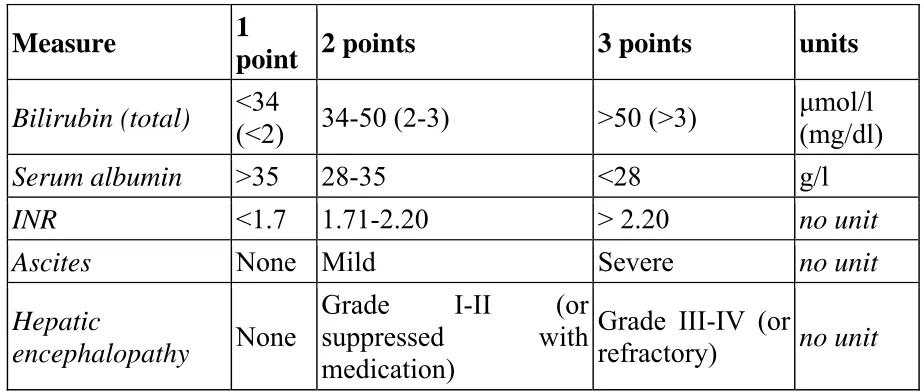
of liver transplantation. The score employs five clinical measures of liver
disease . Each measure is scored 1-3, with 3 indicating most severe
derangement. [70]
In primary sclerosing cholangitis (PSC) and primary biliary
cirrhosis (PBC), the bilirubin references are changed to reflect the fact that these
diseases feature high conjugated bilirubin levels. The upper limit for 1 point is
68 µmol/l (4 mg/dl) and the upper limit for 2 points is 170 µmol/l (10 mg/dl).
Measure 1
point 2 points 3 points units
Bilirubin (total) <34 (<2) 34-50 (2-3) >50 (>3) µmol/l (mg/dl)
Serum albumin >35 28-35 <28 g/l
INR <1.7 1.71-2.20 > 2.20 no unit
Ascites None Mild Severe no unit
Hepatic
encephalopathy None
Grade I-II (or suppressed with medication)
Grade III-IV (or
[image:30.595.66.528.297.493.2]refractory) no unit
Figure 1 child Pugh score
Chronic liver disease is classified into Child-Pugh class A to C,
Points Class One year survival Two year survival
5-6 A 100% 85%
7-9 B 81% 57%
10-15 C 45% 35%
MELD
SCORE
The Model for End-Stage Liver Disease, or MELD, is a scoring system
for assessing the severity of chronic liver disease. It was initially developed to
predict death within three months of surgery in patients that had undergone
a transjugular intrahepatic portosystemic shunt (TIPS) procedure[71]. It uses the
patient's values for serum bilirubin, serum creatinine, and the international
normalized ratio for prothrombin time (INR) to predict survival. This score is
also used by the United Network for Organ Sharing (UNOS)
and Eurotransplant for prioritizing allocation of liver transplants. It is calculated
according to the following formula[72]:
MELD = 3.78[Ln serum bilirubin (mg/dL)] + 11.2[Ln INR] + 9.57[Ln
Caveats with the score include:
The maximum score given for MELD is 40. All values higher than 40 are
given a score of 40
If the patient has been dialyzed twice within the last 7 days, then the
value for serum creatinine used should be 4.0
Any value less than one is given a value of 1 (i.e. if bilirubin is 0.8, a
value of 1.0 is used).
In interpreting the MELD Score in hospitalized patients, the 3 month mortality
is:
40 or more — 100% mortality
30–39 — 83% mortality
20–29 — 76% mortality
10–19 — 27% mortality
<10 — 4% mortality
Other
models
Other models for assessing the prognosis in liver disease include the following.
The original PBC model[73]
In this model, survival probability of a patient with primary biliary
cirrhosis without treatment is estimated based on the following variables. The
variables employed are age, serum bilirubin, serum albumin, prothrombin
time, presence of peripheral edema and usage of diuretics.
Updated
PBC
model
for
prediction
of
short
‐
term
survival
[74]
In this model, short-term survival probability of a patient with primary
biliary cirrhosis is estimated based on repeated observation. The same variables
used in the original PBC model are used in this model also.
In this model, survival probability of a patient with primary sclerosing
cholangitis is estimated based on the following variables. The variables are age,
serum bilirubin, serum albumin and AST.
The Alcoholic Liver Disease/Nonalcoholic Fatty Liver Disease Index
(ANI)[76]
The ANI is a novel scoring system that is highly accurate in
distinguishing alcoholic liver disease (ALD) from nonalcoholic fatty liver
disease (NAFLD). The ANI may be a useful tool for the frequent clinical
scenarios in which it is useful to ascertain an alcohol basis for steatohepatitic
liver injury. Short short-term abstinence does not significantly affect the
performance characteristics of the ANI therefore the ANI is unlikely to be
useful in detecting surreptious alcohol consumption in patients with known
ALD. Other liver diseases should first be excluded before utilizing the ANI. The
ANI is most accurate when the MELD Score is below 20. The variables used
Prothrombin
time
The prothrombin time is a measure of the extrinsic pathway of
coagulation and quantifies the activity of coagulation factors VII, V, and X,
along with their ability to produce fibrin from fibrinogen through the action of
thrombin[77]. As some of the coagulation factors have short half lives-for
example, factor VII has a half life of only two to five hours -the prothrombin
time is a good marker of the synthetic capacity of the liver and hence reflects
the severity of hepatic necrosis. It has been observed that the prothrombin time
peaks on the third day after paracetamol overdose in those patients who are
going to survive and on the fourth day or later in those who will not[78]. This
presumably reflects either a greater degree of hepatic necrosis or a delay in
hepatocyte regeneration in those patients who die. Prothrombin time is
reproducible and nearly always available. Prothrombin time has emerged as a
very discernible indicator of liver cell function especially acute liver cell
function.
Other
coagulation
factors
[77]Factor VII concentration has been shown to provide a good indication of
also been shown to improve the predictive power of this test. Bernuau et al in
Paris, using multivariate analysis, found that a reduced factor V concentration
was the most sensitive prognostic indicator in patients with fulminant hepatitis
B infection. However Assay of individual clotting factors is not a routine
investigation in most laboratories and this limits the usage of these indicators in
routine clinical practice[78].
Aminotransferases
The serum aminotransferases (formerly called transaminases) are
sensitive indicators of liver cell injury and are most helpful in recognizing acute
hepatocellular diseases, such as hepatitis[79]. The activities of alanine
aminotransferase (ALT), formerly serum glutamic-pyruvic transaminase
(SGPT), and aspartate aminotransferase (AST), formerly serum
glutamic-oxaloacetic transaminase (SGOT), in serum are the most frequently measured
indicators of liver disease. These enzymes catalyze the transfer of the α-amino
groups of alanine and aspartic acid, respectively, to the α-keto group of
ketoglutaric acid. This results in the formation of pyruvic acid and oxaloacetic
There is a poor correlation between the extent of liver cell necrosis and
elevation of serum aminotransferases levels. Similarly, absolute elevation of
aminotransferase levels is of little value in predicting the outcome of acute
hepatocellular disorders. Rapid decreases in serum aminotransferase levels
usually are a sign of recovery from disease. This may be a poor prognostic sign
in fulminant hepatitis, in which decreasing serum values may reflect the
massive destruction and loss of viable hepatocytes. AST has been validated as
an independent prognostic marker in drug induced liver disease[80]. Other
enzymes like lactate dehydrogenase, glutamate dehydrogenase, isocitrate
dehydrogenase and sorbitrate dehydrogenase has been used as indictors of liver
cell damage but none of them has been validated as prognostic indicators.
Bilirubin
A recognition of the potentially grave significance of yellow
discoloration (jaundice) long preceded any knowledge of bilirubin and is
mentioned in clay tablets of Mesopotamia (3000 BC) and the writings of
Hippocrates (460–377 BC). In the practice of medicine over the centuries, the
skin discoloration often evoked fear and loathing[81]. The concentration of
bilirubin in plasma varies directly with the generation of bilirubin and inversely
with the hepatic clearance of bilirubin. Bilirubin is incorporated in most of the
separately been validated as an independent prognostic marker in drug induced
liver diseases[80].
Other
prognostic
markers
in
liver
disease
Computerized tomagraphic liver volumetry has been validated as a
prognostic indicator in acute liver disease[82]. The newer methods used in
prognostication of liver diseases are ER6Q,Vimentin, actin alpha 1 skeletal
muscle protein, hMFAP and tropomyosin[83]. Serum electrophoresis has been
suggested as an indicator of prognosis in chronic liver disease.When an
electrophoretic analysis of the serum proteins was included, marked decreases
in the concentrations of albumin and the alpha-globulins alpha-1-antitrypsin and
haptoglobin were observed in terminal liver cirrhosis, indicating impaired liver
function[84]. In patients with alcoholic cirrhosis, plasma calprotectin has been
suggested as a new prognostic marker of survival, which seems independent of
the severity of liver disease[85]. Furthermore, high plasma calprotectin levels
may characterize a group of patients with cirrhosis with recurring bacterial
infections.
Hyaluronic acid is a strong predictor of liver-related events in HIV/viral
hepatitis-co-infected patients. Patients developing liver-related events during
such events. Plasma Hyaluronic acid may be useful to monitor progression of
Thyroid
function
tests
as
prognostic
indicators
in
liver
disease
The abnormalities of serum concentrations of thyroid hormones are
commonly found in liver diseases. The degree of abnormalities may be noted
according to the type of disease or its severity. The estimation of free thyroid
hormones is important in liver diseases because changes of the binding protein
in blood.
According to Takahashi et al in chronic liver diseases, serum FT3 is
decreased according to the degree of liver dysfunction in conditions such as
CPH, CAH and LC, and seemed to reflect the severity of the liver damage[87].
Serum FT3 may reflect directly the disturbance of the conversion from T4 to T3
in liver. It is also decreased in AH as in LC. Therefore serum FT3 may become
an index of liver damage because serum FT3 showed favourable correlation
with each of ICGR15,
PT and albumin which were considered to reflect the reserved hepatic capacity.
As to the significance of free thyroid hormones as an index of the severity of
liver damage, serum FT3 decreased according to the degree of liver dysfunction
in both chronic liver diseases and AH. In consequences it is considered that
serum FT3 may become a sensitive index of liver dysfunction; serum FT4
under the critical condition in liver diseases as in other diseases. Therefore
serum FT4 is assumed to be a useful index for prognosis, and has a different
significance
from serum FT3.
Yamanaka et al reported that T3/T4 value decreased only decompensated
liver cirrhosis, but no significant changes were noted in other liver diseases[88].
Yamaba et al reported that T3/T4 value decreased most in acute hepatitis, and
slightly decreased in chronic persistent hepatitis and chronic active hepatitis,
while no significant difference was noted in liver cirrhosis compared with
controls[89].
Ertugˇ rul Kayacetina, Gurcan Kısakolb, Ahmet Kayab found no
significant difference in functional thyroid parameters between patients
surviving and not surviving hepatic encephalopathy (p <0.375)[90]. They
concluded that patients with decompensated liver disease complicated by
hepatic encephalopathy subsequent to non-alcoholic cirrhosis were found to
have exceedingly low serum FT3 and T4 levels. Depressed serum FT3 and T4
levels, together with a prolonged prothrombin-time, therefore appear to be
characteristic of a subgroup of decompensated cirrhotic patients prone to
develop hepatic encephalopathy.
serum T3 concentrations and the severity of liver dysfunction[91,92]. A
progressive decrease in T3 levels in chronic liver diseases was described as an
indicator
of poor prognosis. Authors ascribed this finding to diminished conversion of T4
to T3 and impaired metabolism of thyroxine-binding proteins. Borzio et al.
compared cirrhotics with normal subjects and chronic hepatitis patients. They
suggested that T3 serum levels inversely paralleled severity of liver
dysfunction. Thyroid function tests have also been performed in acute hepatitis.
T4 has been found to be elevated in patients with acute viral hepatitis due to
elevation of TBG
(Possibly secondary to release from injured hepatocytes).
In a large group of alcoholic patients Israel et al reported a significant
inverse correlation between serum T3 concentrations and the severity of liver
dysfunction as well as a progressive T3 increase in those subjects eventually
displaying a favourable outcome, suggesting that T3 concentrations in patients
with advanced liver disease may be considered as a helpful prognostic
indicator[93]. Only little data have been previously reported on direct
measurement of free thyroid hormones in liver patients. Green et al found
normal FT3 and FIT4 in a small group of cirrhotic patients while low FT4 and
performed with equilibrium dialysis, however, showed decreased FT3 and
normal or frequently increased FT4 concentrations.
S. OZSOY et al found out that chronic alcohol consumption may cause
long-term thyroid dysfunction[95]. This may be manifested as a subclinical
hypothyroidism in clinical settings and may be related to the severity and
duration of alcoholism, family history, and aggression tendency of the patient.
Although decreased thyroid hormone levels seem to be a result of persistent
effect of chronic alcohol use on thyroid gland, it cannot be disregarded that it
Conclusion
The liver is closely involved in the metabolism and homeostasis of thyroid hormones. Liver synthesizes most of the thyroid binding proteins and is also involved in the peripheral conversion and inactivation of thyroid hormones. Clinically chronic liver disease may mimic hypothyroidism and thyroid dysfunction may exacerbate liver disease. Though most of the liver disease patients remain euthyroid, subtle abnormalities in thyroid function tests are common. The abnormalities found in a particular liver disease patient depend on the type and duration of illness. The thyroid abnormalities found in acute liver disease differs from that in chronic liver disease and reflects mostly the underlying inflammatory status. The thyroid abnormalities in chronic liver disease patients have been suggested to be an adaptive response to the disease state. It has also being suggested that induced hypothyroidism may be therapeutic in cirrhotic patients. Apart from this thyroid and liver dysfunction can coexist as part of consequences of drugs, radiation or other systemic disease process.
Materials
and
Methods
Settings
Institute of internal medicine,
Madras Medical College and Government General Hospital
Chennai - 600 003.
Ethical approval
Obtained
Study duration
This study was conducted for a period of eighteen months from Jan 2008 to October 2009.
Study Design
A cross sectional study to determine the spectrum of thyroid
abnormalities in acute and chronic liver disease patients getting admitted to
general medical wards during the study period.
Inclusion criteria
1] Patients admitted in medical wards in Government General Hospital with
diagnosis of acute or chronic liver disease from January 2008 to October 2009
diagnosis of chronic liver disease were studied under the chronic liver disease
category. Similarly the first 10 patients with the diagnosis of acute liver disease
were studied.
2] Age greater than 12 years.
Exclusion criteria
1) Age less than 12 years
2) Patients refusing to undergo the study
Methods
A detailed clinical history was elicited from patients selected for the
study. A comprehensive physical examination was carried out on them,
followed by a thorough review of their hospital records. Data was collected
regarding the duration of symptoms, clinical features of liver disease and
features of thyroid disease. Patients were divided into acute or chronic liver
disease based on history, physical examination, and imaging. Any patient with
duration of illness more than 2 months was considered to have chronic liver
disease. On imaging coarse echoes and features suggestive of cirrhosis was
taken as markers of chronic liver disease. Ascites was graded into three
ascites. Hepatic encephalopathy was graded into 3 categories; 0-none,
1-minimal and 2-advanced.
Complete thyroid profile (thyroid stimulating hormone [TSH], free
thyroxine [FT4], total thyroxine [TT4], free triiodothyronine [FT3] and total
triiodothyronine [T T3]) of patients selected for the study was carried out using
chemilumiscent immunological method. Patients underwent complete liver
function tests. This included total and direct bilirubin, enzymes (aspartate
aminotransferase [AST], alanine aminotransferase [ALT], alkaline phosphatase
[AP]), serum total protein and albumin and prothrombin time. Prothrombin time
was estimated using method. All patients underwent an abdominal
ultrasonogram to confirm the diagnosis and to look for ascites splenomegaly
and features of portal hypertension.
Child-Pugh score was calculated for patients with chronic liver disease as a
measure of the severity of liver disease.
Thirty age and sex matched healthy controls were selected from among
the attendees of the patients. They were given a complete physical examination
liver function test evaluation to exclude liver disease. A complete thyroid
Statistical
analysis
Data analysis was done with use of SPSS, version 10. Descriptive
statistics were used to calculate the frequency, mean, median, and standard
deviation. For all normally distributed variables, Student’s t test and ANOVA
test were used to determine the significant mean difference in various groups.
The correlation between the various thyroid function variables and liver
function variables was assessed by Pierson’s method. The significance of the
difference between the various coefficients of correlations was evaluated using
Observations
and
Results
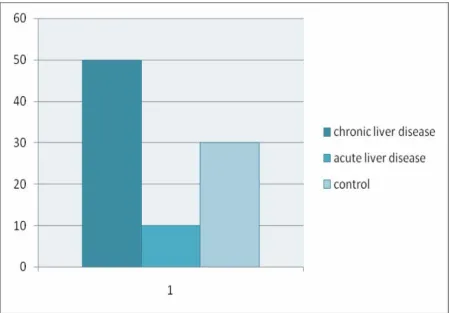
The analysis of the data from 50 patients with chronic liver disease, 10
patients with acute liver disease and 30 controls is given below.
Baseline
characteristics
The baseline characteristics of each group of patients and controls are
given below. The chronic liver disease group was composed 41 males and 9
females. The average age was 49 years. The mean duration of symptoms was
16.44 months. Twenty five patients had evidence of upper gastrointestinal
bleed. Thirteen patients had evidence of hepatic encephalopathy with 4 of them
having severe encephalopathy. Twenty nine patients had clinical evidence of
ascites of which 6 were classified as difficult to control. Thirty four of these
patients had serologic evidence of ascites. Of these patients 42 were clinically
icteric while 30 had evidence of edema.
Of the chronic liver disease patients only one patient had clinical
evidence of hypothyroidism and her thyroid profile showed gross
hypothyroidism with TSH being 28.4. Two other patients had TSH between 5.5
have either laboratory or clinical evidence of hyperthyroidism. Other baseline
characteristics are given in the chart below.
Characteristic Value Standard deviation
Total patients enrolled 50
Male 41 (82%)
Female 9 (18%)
Mean age 49 yrs 12.8 years
Mean Duration of symptoms
16.44 months 19.8 months
Number with UG bleed 25 (50%) Number with encephalopathy
13 (26%)
Number with severe encephalopathy
4 (8%)
Number with ascites 29 (58%) Number with difficult to
control ascites
6(12%)
Number with jaundice 42 (84%) Number with edema 30 (60%) Patients with goiter 1 (2%) Patients with gall stones 3(6%) Patients with clinical hypothyroidism
1 (2%)
TSH 2.3788 mIU/L 4.01
TT4 6.5778 micro g/dL 1.77
FT4 1.1632 ng/dL 0.362
TT3 102.64 ng/dL 38.0
FT3 1.8728 pg/mL 0.650
Total bilirubin 7.7390 mg/dl 5.69
Direct bilirubin 4.3340 mg/dl 3.44
AST 125.24 U/L 89.4
ALT 128.94 U/L 117
Alkaline phosphatase 198.26 U/L 59.8
Albumin 3.2980 gm/dl 0.446
Prothrombin time 24.086 seconds 6.34
Child-Pugh score 10.120 2.19
Liver size 11.170 cm 1.86
Baseline
characteristics
in
acute
liver
disease
patients
The acute liver disease group consisted of 7 males and 3 females. The
mean age of the group was 33.3 years. The mean duration of symptoms was
0.360 months. All ten patients were jaundiced; none of the patients had upper
gastrointestinal bleed, goiter or gall stones. One patient each had hepatic
encephalopathy and ascites.
None of the patients had clinical or laboratory evidence of
hypothyroidism or hyperthyroidism. The mean TSH was 1.7330 with a standard
deviation of 1.04. The mean free T3 was 2.3090 with a standard deviation of
Characteristic Value Standard deviation
Total patients enrolled 10
Male 7 (70%)
Female 3 (30%)
Mean age 33.300 years 11.2 years
Mean Duration of symptoms
0.36600 months 0.119 months
Number with UG bleed 0
Number with encephalopathy
1 (10%)
Number with severe encephalopathy
0
Number with ascites 1 (10%) Number with difficult to
control ascites
1 (10%)
Number with jaundice 10(100%) Number with edema 0
Patients with goiter 0 Patients with gall stones 0 Patients with clinical hypothyroidism
0
TSH 1.7330 mIU/L 1.04
TT4 9.9930 micro g/dL 2.52
FT4 1.2720 ng/dL 0.279
TT3 108.70 ng/dL 35.8
FT3 2.3090 pg/mL 0.644
Total bilrubin 7.7500 mg/dl 4.46
Direct bilrubin 4.3400 mg/dl 3.33
AST 317.30 U/L 219.
ALT 325.60 U/L 230
Alkaline phosphatase 208.00 U/L 38.1
Albumin 3.6900 gm/dl 0.224
Prothrombin time 16.260 seconds 2.12
Liver size 12.180 cm 1.38
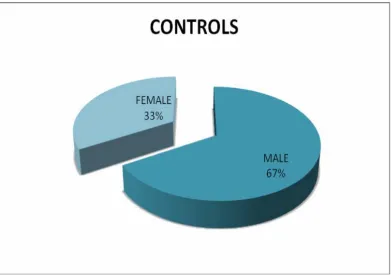
Baseline
characteristics
of
control
group
The control group consisted of 30 patients of which 20 were males. The
mean age of the patients was 43.200 years. None of the patients had clinical or
laboratory evidence of thyroid dysfunction. The liver function was normal both
clinically and by laboratory evidence.
Characteristic Value Standard deviation
Total patients enrolled 30
Male 20 (66.67%)
Female 10 (33.33%)
Mean age 43.200 years 13.8 years
Patients with clinical hypothyroidism
0
TSH 2.7440 mIU/L 1.56
TT4 7.4693 micro g/dL 1.46
FT4 1.2630 ng/dL 0.292
TT3 124.17 ng/dL 29.0
Distribution
of
patients
in
various
groups
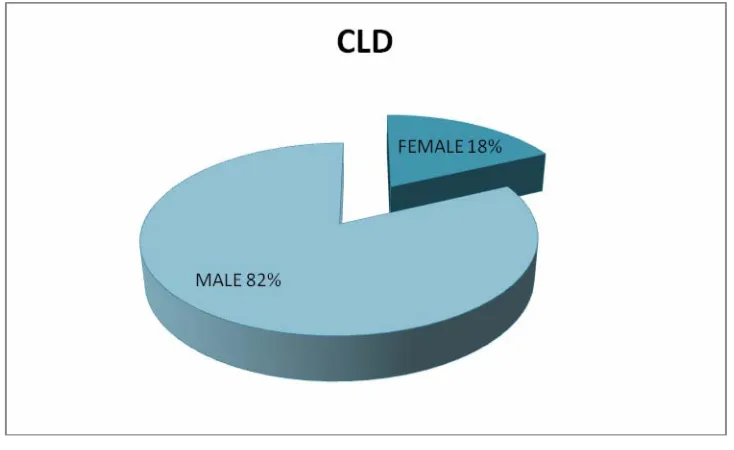
Sex
distribution
in
various
groups
[image:56.595.70.437.200.425.2]
Chronic liver disease. Total number 50. Male-41, female-9.
Figure 3 sex distribution CLD
Acute liver disease
[image:56.595.71.434.521.744.2]Total number 10, female-3. Male-7
Sex
distribution
in
controls
Comparison
of
thyroid
function
variables
The comparison between the thyroid function tests of the three groups
was carried out using ANOVA test. Among the thyroid function tests TSH and
FT4 failed to show any statistically significant difference among them (p value
of 0.67 and 0.35 respectively). The most statistically significant difference was
in the comparison of TT4 and FT3 (p value -0.0001). The p value for the
comparison of TT3 among the three groups was 0.033.
Thyroid variable TSH1 Mean-std dev TT42 Mean-std dev TT33 Mean-std dev FT44 Mean-std dev FT35 Mean-std dev CLD 2.3788- 4.01 6.5778 - 1.77 102.64- 38.0 1.1632- 0.362 1.8728- 0.650 ALD 1.7330 -
1.04 9.9930- 2.52 108.70 -35.8 1.2720 - 0.279 2.3090- 0.644 CONTROL 2.7440- 1.56 7.4693 - 1.46 124.17- 29.0 1.2630- 0.292 2.8850 - 0.582 1 P value- 0.67
The
comparison
of
liver
function
abnormalities
There was no significant difference between the acute and the chronic disease groups in case of total or direct bilirubin. Among the enzymes both AST and ALT differed significantly between the two groups. Serum alkaline phosphatase did not vary significantly between the two groups. Markers of hepatic synthetic function like albumin and prothrmbin time varied significantly between the two groups. Among the sonologic parameters liver size did not show any significant difference while the difference in spleen size was significant. The comparison between the various liver function values and the level of significance is given in the table below.
Liver function variable CLD Mean-std dev ALD Mean-std dev P value Mean-std dev Total bilirubin 7.74 -5.69 7.78-4.46 0.98
direct bilirubin 4.33-3.44 4.34- 3.33 1.00
AST 125- 89.4 317- 219 .0001
ALT 129- 117 326- 230 0.0002
ALK PO4 198- 59.8 208- 38.1 0.62
Albumin 3.30- 0.446 3.69- 0.224 .0001
Prothrombin time 24.1- 6.34 16.3- 2.12 0.0003
Liver size 11.2-1.86 12.2-1.38 0.11
Spleen size 10.9- 2.68 7.60 - 0.745 0.0003
Correlation
between
the
thyroid
function
and
liver
function
Correlation between the thyroid function and liver function in CLD
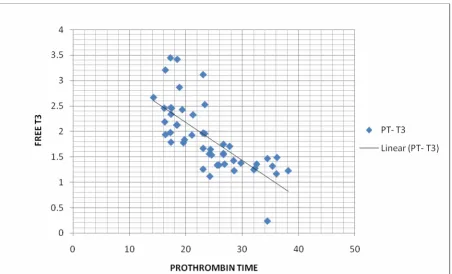
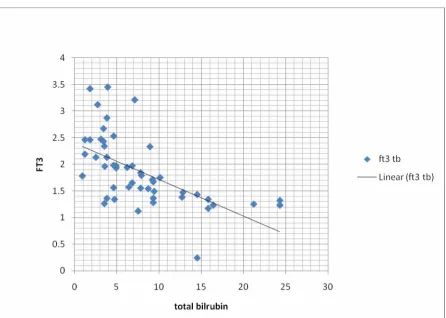
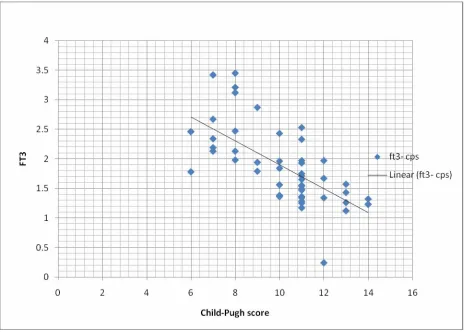
The correlation between various thyroid function variables and liver function variables was calculated using Pierson’s coefficient of correlation method. The results are shown in the table below. There was no significant relation between the thyroid function and the level of liver enzymes (AST, ALT). Among the thyroid function tests FT3 showed the highest level of correlation with the liver function indices. TSH did not show any correlation with the liver function indices except total bilirubin. The correlation was significant with a p value of less than 0.05. All other thyroid function indices showed relationships with the liver indices (excluding the enzyme levels) that were significant with a p value less than 0.01. Serum albumin showed a significant positive correlation with TT4, TT3, FT4 and FT3. Both prothrombin time and child-Pugh score showed a significant negative correlation with TT4, TT3, FT4 and FT3. The best correlation was between FT3 and Child-Pugh score.
T B D B AST ALT ALB P T CPS
TSH +0.304a +0.189 -0.072 -0.014 -0.178 +0.366b +0.222 TT4 -0.405b -0.515b +0.261 +0.231 +0.427b -0.595b -0.651b
FT4 -0.446b -0.432b +0.137 +0.132 +0.412b -0.564b -0.481b TT3 -0.580b -0.575b +0.110 +0.050 +0.486b -0.626b -0.535b
FT3 -0.599b -0.582b +0.117 +0.028 +0.505b -0.726b -0.682b
a correlation significant at 0.05 level ( 2 tailed)
Graphical
representation
of
the
data
[image:62.595.70.526.242.535.2]Plot between FT3 and liver variables Free T3 - albumin
Figure 6 free T3- albumin
Plot
between
free
T3
and
prothrombin
time
Figure 7 free T3- prothrombin time
Plot
between
free
T3
and
total
bilirubin
Figure 8 FT3 - total bilirubin
Plot
between
free
T3
and
Child
‐
Pugh
score
Figure 9 FT3-Child-Pugh score
Correlation between the thyroid function and liver function in ALD
The correlation between various thyroid function variables and liver function variables was calculated using Pierson’s coefficient of correlation method. The results are shown in the table below.
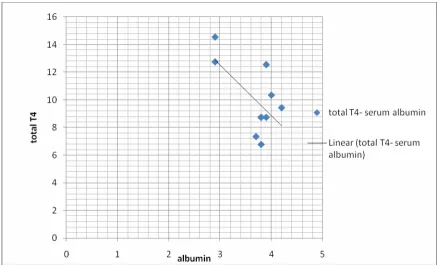
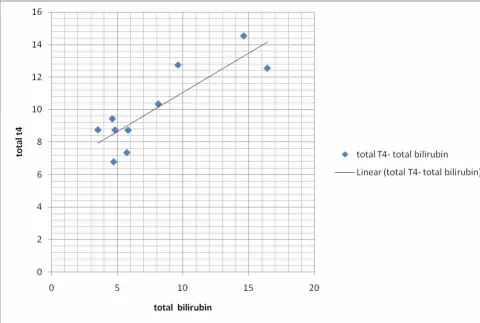
There was no significant relation between the thyroid function values and the level of liver enzymes (AST, ALT). Among the thyroid function tests FT3 showed significant negative correlation with prothrombin time while the p value for the correlation with other variables did not reach level of significance, probably due to the small number of patients. TSH did not show significant correlation with any of the liver function indices. Total t4 showed a significant positive correlation with total bilirubin and a significant negative correlation with serum albumin levels. Total T3 showed significant negative correlation with AST levels. The level of correlation between other thyroid variables and various liver function values did not reach significant level.
T B D B AST ALT ALB P T
TSH -0.192 -0.274 +0.444 +0.357 +0.028 -0.180 TT4 +0.857a +0.890 +0.466 +0.433 -0.862a +0.355
FT4 +0.408 +0.438 -0.214 -0.108 -0.222 +0.171 TT3 -0.587 -0.588 -0.644b -0.559 +0.444 -0.485 FT3 -0.605 -0.611 -0.129 -0.057 +0.282 -0.730b
Plot
between
total
T4
and
serum
albumin
levels
Figure 10 total t4- serum albumin
Plot
between
total
T4
and
total
bilirubin
levels
[image:68.595.73.553.214.537.2]
Figure 11 total T4- total bilirubin
Plot
between
free
T3
and
prothrombin
Figure 12 FT3- prothrombin time
Plot
between
total
T3
and
AST
Figure 13 total T3- AST
Analysis
of
the
difference
between
the
various
correlations
The significance of the difference between the various values of correlation was assessed by Z- transformation test. There was no significant difference between the statistically significant correlation values. The data obtained in the analysis is given in the following table.
CLD
group
type n r z 1/n-3 se(z1-z2) P-value
PT free_3 50 -0.726 -0.92022 0.021277 tot_t3 50 -0.626
-0.73481 0.021277 -0.18541 0.042553 0.206284 -0.89879 0.369
CP free_3 50 -0.682
-0.83284 0.021277 tot_t3 50 -0.535 -0.59712 0.021277 -0.23572 0.042553 0.206284 -1.14269 0.253
ALD
Group
PT free_3 10 -0.73 -0.92873 0.142857 tot_t3 10 -0.485 -0.5295 0.142857 -0.39923 0.285714 0.534522 -0.74688 0.455
Discussion
disease groups. Among these two groups, males constituted a higher proportion (82%) in the chronic liver disease group. This probably reflects the high prevalence of alcohol abuse among males. Another reason could be greater exposure of the males to infectious agents due to their outdoor lifestyle.
Among the chronic liver disease patients only one patient had gross hypothyroidism, she also had clinical evidence of thyroid disease. Two other patients showed elevated TSH between 5 and 10 without clinical evidence of hypothyroidism. There were no other gross abnormalities in any of the other patients in chronic liver disease group or acute liver disease group. So it can be inferred that all chronic liver disease patients should be carefully examined for features of hypothyroidism and if it is present laboratory confirmation is warranted. The usefulness of routine screening for thyroid abnormalities in chronic liver disease patients is doubtful as there is uncertainty regarding the benefit of treating patients with subtle thyroid abnormalities. This concern is especially valid since many investigators have suggested that hypothyroidism may be an adaptive change liver cirrhosis patient.
Total T3 was significantly lower in both the disease groups compared to controls (p value .033) probably due to impaired peripheral conversion in liver disease groups. Free T4 did not vary significantly between the three groups. This was surprising given that earlier studies have demonstrated significant difference between these groups. It has previously been proposed that free T4 could be used as an indicator to differentiate acute and chronic liver disease patients as it is decreased only in chronic liver disease patients.
Free T3 differed significantly between all the three groups with chronic liver disease group having the lowest value. The difference between the acute liver disease group and controls was also significant (p value .0001). So free T3 may be used as a sensitive indicator to differentiate acute and chronic liver disease patients. For this separate normal limit of free T3 has to be established in both acute and chronic liver disease groups by large population studies.
The chronic liver disease group was considerably older than the acute liver disease group. The acute liver disease group was less sick with better prothrombin time (p value-<0.0001). The enzyme levels, both AST and ALT differed significantly between the two groups (p value-<0.0001).among the ultrasound parameters spleen size varied significantly (p value-<0.0001) but there was no significant difference in liver size (p value-0.11). There was no significant difference between the total or direct bilirubin levels between the two groups (p value-0.98). These results were along the expected levels.
In chronic liver disease patients total T4 showed significant negative correlation with total bilirubin, direct bilirubin, prothrombin time and Child-Pugh score (p value of < 0.01). There was significant positive correlation between serum albumin levels and total T4 (p value of < 0.01). This was in contrast to the situation in acute liver disease group where there was significant positive correlation between total T4 levels and total bilirubin and direct bilirubin and significant negative correlation with serum albumin levels. There was no significant correlation betwee