DISSERTATION ON
HYPONATREMIA - A PREDICTOR OF SHORT TERM
MORTALITY IN ACUTE ST SEGMENT ELEVATION
MYOCARDIAL INFARCTION (STEMI)
M.D. DEGREE EXAMINATION
BRANCH I
(GENERAL MEDICINE)
THANJAVUR MEDICAL COLLEGE THANJAVUR
THE TAMILNADU Dr. M.G.R. MEDICAL UNIVERSITY CHENNAI – TAMILNADU
CERTIFICATE
This is to certify that the dissertation entitled
“HYPONATREMIA - A PREDICTOR OF SHORT TERM MORTALITY IN
ACUTE ST SEGMENT ELEVATION MYOCARDIAL INFARCTION (STEMI) ”
is the bonafide work done by Dr. PREM KRISHNA ANANDAN in the
Department of General Medicine , Thanjavur Medical College , Thanjavur
during his Post Graduate Course from 2008 – 2011 . This is submitted as
partial fulfilment for the requirement of M.D. Degree Examinations –
Branch I (General Medicine) to be held in APRIL 2011.
PROFESSOR AND HEAD, UNIT CHIEF M-1
Department of Internal Medicine , Department of Internal Medicine,
Thanjavur Medical College , Thanjavur Medical College,
Thanjavur. Thanjavur.
THE DEAN
Thanjavur Medical College,
DECLARATION
I, Dr. PREM KRISHNA ANANDAN solemnly declare that the dissertation
entitled “HYPONATREMIA – A PREDICTOR OF SHORT TERM
MORTALITY IN ACUTE ST SEGMENT ELEVATION MYOCARDIAL
INFARCTION (STEMI) ” is a bonafide work done by me at Thanjavur
Medical College Hospital, Thanjavur during September 2009 –
October 2010 under the guidance and supervision of
PROF.DR.S.MUTHUKUMARAN.M.D., Professor and HOD, Department of
Internal Medicine. The dissertation is submitted to THE TAMILNADU
Dr. M .G .R. MEDICAL UNIVERSITY , CHENNAI, TAMILNADU
as partial fulfilment for the requirement of M.D. Degree Examinations –
Branch I (General Medicine) to be held in April 2011.
Place: Thanjavur
ACKNOWLEDGEMENT
I express my gratitude to the Dean DR. P.RAVISHANKAR M.D.,D.H.A,
and Medical superintendent DR.G.AMBUJAM M.S.,F.I.C.S.,
Thanjavur Medical College Hospital and RM Hospital,Thanjavurfor
allowing me to pursue this dissertation and avail the facilities for my work,
in Thanjavur Medical College.
I am very grateful to my unit chief PROF.DR.S.MUTHUKUMARAN M.D.,
Professor and head of the department of internal medicine, for permitting
me to do the study and for his immense help in carrying out the study and
stood as the backbone of my dissertation, by initiating me, guiding me in
each and every step and by taking much pains to give this dissertation its
complete form.
I am very grateful to PROF. DR. S. MUTHUKUMARAN M.D., Head of the
Department, PROF. DR. BALASUBRAMANIYAM M.D.,D.M., (CARDIO),
Former Head of the Department and Dr. G. SENTHIL KUMAR, M.D.,D.M
(CARDIO), DR. G. MARIMUTHU M.D., D.M.,(CARDIO) Assistant Professor,
Department of Cardiology, for their immense help in carrying out this
study.
I am extremely thankful to the chiefs of other medical units,
DR. P.KRISHNAMURTHY. M.D., DR.P.G.SHANKARANARAYANAN. M.D.,
DR.V.RAJENDRAN M.D., DR.K.NAGARAJAN. M.D., and DR. K.PARIMALA
DEVI M.D., for allowing me to work on their patients.
I owe my gratitude to my unit Assistant professors
DR.C.PARANTHAGAN M.D., DR.M.ASHOK M.D.,DR.MUTHUSELVAN M.D.,
for their guidance and encouragement.
Finally, I would like to thank all the patients who co-operated and
participated in the study.
TABLE OF CONTENTS
S.NO CONTENTS PAGE NO.
1. INTRODUCTION 1
2. AIMS OF THE STUDY 3
3. REVIEW OF LITERATURE 4
4. MATERIALS AND METHODS 19
5. RESULTS 24
6. DISCUSSION 45
7. CONCLUSION 53
8. BIBILOGRAPHY 54
9. PROFORMA 65
10. ABBREVATIONS 67
INTRODUCTION
Coronary artery disease is the leading cause of death globally1. In 2001 coronary artery disease accounted for 7.1 million deaths world wide2,3, 80% of which were in low income countries like India4. It has been estimated that by 2010, 60% of world’s heart disease are expected to occur in India5
.Indians are prone to get coronary artery disease at an earlier age than do people in developed countries because of the high prevalence of risk factors like diabetes and hypertension6,7.
In Indian population ST segment elevation myocardial infarction is the most common type of acute coronary event and contributes to 60.6% of overall incidence of acute coronary syndrome8.The overall mortality in STEMI is approximately 4 to 7 % or even less in the published clinical trials. However this is not the case in the real world situation9,10 .This is because the patients enrolled in the randomized trials are selected ones and represented low-risk subgroup. Therefore the results of these trials are not applicable to 50% of patients in clinical practice11.
Hyponatremia is a common electrolyte disorder amongst hospitalized patients13,14,15,,16,especially with heart failure, nephrotic syndrome or cirrhosis.
Hyponatremia has been shown to be a predictor of cardiovascular mortality among patients with heart failure17,18,19. In fact, the neurohormonal activation that accompanies acute myocardial infarction is similar to that which accompanies heart failure20.
Hyponatremia is common after MI21, and clinical improvement is accompanied by a rise in plasma sodium concentration22. However, while the prognostic value in hyponatremia in chronic heart failure is well established23,24,25, the prognostic importance of hyponatremia in the setting of acute myocardial infarction are lacking.
This study was done to determine the prognostic importance of hyponatremia in the setting of acute ST elevation MI and to determine its usefulness in predicting short term survival.
AIMS OF THE
STUDY
AIMS OF THE STUDY
1. To study the prevalence of hyponatremia in acute ST elevation myocardial infarction.
2. To study the relationship between severity of hyponatremia and short term mortality.
3. To find out the prognostic importance of hyponatremia in acute ST elevation myocardial infarction.
4. To assess the usefulness of hyponatremia as an independent risk factor in predicting short term mortality.
5. To find out the association between hyponatremia and other risk factors like ejection fraction, hypertension, diabetes, smoking, age, sex and type of infarction.
REVIEW
OF
LITERATURE
REVIEW OF LITERATURE
ACUTE MYOCARDIAL INFARCTION MAGNITUDE OF THE PROBLEM: 26
Cardiovascular disease accounts for approximately 12 million deaths annually and to the common cause of death globally. Since past 3 decades there is considerable decline in incidence and prevalence of coronary artery disease in the industrialized western world, whereas it is increasing in the developing world.
Asian Indians, whether living in their own country or as immigrants have much higher incidence of coronary artery disease as compared to all other ethnic groups. Coronary artery disease among Asian Indians has been found to be more severe, diffuse and associated with serious complications and increasing mortality at a younger age.
In this ethnic group specific risk factors, infections and inflammations are emerging. An underlying genetic susceptibility associated with a specific abnormality in lipid profile and different lifestyle factors makes coronary artery disease to assume a malignant course in Asian Indians.
In 1960 CAD represented 4% CVD deaths. In 1990 the proportion was greater than 50% of CVD deaths. CAD deaths rates currently are 3 times more than the stroke rates. However it may suggest metabolic differences in response to the urban life style, higher fat diets and lower levels of activity. Further more the proportion of calories derived from fat, much of which comes from dairy products, is significantly higher in India than in other parts of the developing world.
CORONARY RISK FACTORS FOR ASIAN INDIANS27
Asians have different and specific risk factors as compared to western population.
NON MODIFIABLE: Male age > 35 years Female age > 45 years
Family history of premature CAD (at age < 55) MODIFIABLE (NONLIPID)
Hypertension ,Cigarette smoking ,tobacco abuse Diabetes mellitus / insulin resistance syndromes Apple obesity or body mass index > 22
MODIFIABLE (LIPID) Total cholesterol > 150mg/dl Triglycerides > 150 mg/dl LDL cholesterol > 100 mg/dl APO – a lipoproteins > 100 mg/dl
HDL cholesterol < 40 mg/dl males, < 50 mg/dl females. MODIFIABLE LIPOPROTEIN RATIOS
TC/HDLc > 4.5 LDLc/HDLc > 3.5 APO A/APO B < 1.2
LIPID TETRAD = (LPa *TG *LDLc) / HDLc > 20,000 PATHOPHYSIOLOGY: 28,29
Virtually all acute infarcts are caused by thrombosis developing on a ruptured atherosclerotic plaque. Such rupture leads to sudden occlusion of the vessel due to liberation of rbc”s, platelets, macrophages, and subsequently lead to thrombus formation.
CLINICAL PRESENTATION: 30
PHYSICAL FINDINGS: 30
Anterior infarction have sympathetic nervous system hyperactivity, tachycardia and hypertension. Patients with inferior wall infarction show evidence of parasympathetic hyperactivity ,bradycardia and hypotension.
Precordium is usually quite and apical impulse may be difficult to palpate. Other physical signs are decreased intensity of S1, paradoxical splitting of S2, S3 or S4 may be heard.
In 1967, Killip31 proposed a prognostic classification scheme in patients presenting with acute MI.
a) Class-I patients are free of rales and a third heart sound.
b) Class-II patients have rales <50% of lung fields, and may or may not have S3.
c) Class-III patients have rales in >50% of each lung field and frequently have pulmonary edema, S3
INVESTIGATIONS
1) ELECTROCARDIOGRAM:32
A) REPOLARISATION (ST-T WAVE) ABNORMALITIES
When acute ischemia is transumural the overall ST vector is usually shifted in the direction of outer (epicardial) layers and ST elevation and sometimes tall positive (hyper acute) T waves are produced over the ischemic zone. Reciprocal ST depressions can appear in leads reflecting the contralateral surface of the heart.
B) QRS CHANGES
Necrosis of sufficient myocardial tissue can lead to decreased R wave amplitude or Q wave in the anterior, lateral or inferior leads as a result of loss of electromotive forces in the infarcted area.
Abnormal Q waves can sometimes be associated with subendocardial infarcts and transmural infarcts can occur without Q waves. Loss of depolarization forces in these regions can reciprocally increase R wave in V1 and V2 rarely without causing diagnostic Q waves in any of the leads. C) EVOLUTION OF ECG CHANGES :
2) LABORATORY FINDINGS
A]SERUM MARKERS OF CARDIAC DAMAGE: I) CREATINE KINASE MB33
CK-MB starts to rise within 4 – 8 hours after the onset of infarction, peaks by 24 hours and declines to normal within 2-3 days.
II) CARDIAC SPECIFIC TROPONINS33,34,35,36
Both TnT and TnI first begin to rise above reference limit by 3 hours from the onset of chest pain, TnI peaks by 24 hours and persist for 7 – 10 days after AMI, elevation of TnT peaks by 12 hours to 2 days and may persist up to 14 days.
III) MYOGLOBIN:,33,34,35
Peak levels of serum myoglobin are reached considerably earlier (1-4 hours) than peak values of serum CK and its measurement has been suggested as a useful index of successful reperfusion, and even infarct size33,34.
IV)LACTATE DEHYDROGENASE (LDH):
LDH starts to rise 24-48 hours after the onset of AMI, reaches a peak by 3-6 days and returns to normal levels 8-14 days after the infarction. V) NEWER CARDIAC MARKERS UNDER DEVELOPMENT 37,38 1) Heart fatty acid binding proteins (HFABP),
B] LIPID PROFILE
Lipid profile should be obtained after 24 – 48 hours39,40,41 of MI because, for 24 hours total cholesterol and HDL cholesterol remains at or near baseline and generally fall after that.
C] OTHER INVESTIGATIONS 1) LEUCOCYTOSIS42
Leukocytosis develops within 2 hours after MI and reaches peak by 2 days ,returns to normal by one week.
2) ESR
ESR is usually normal during 1st or 2 days after MI, rises to peak by 4– 5 days and remains elevated for several weeks.
3) HEMATOCRIT
Hemotocrit often rises following MI due to hemoconcentration.
4) CRP43,44
3) IMAGING
A] CHEST X-RAY
The degree of congestion and the size of the left side of the heart on the chest-film are useful for defining groups of patients with MI who are at increased risk of dying after the acute event .
B] 2D ECHOCARDIOGRAPHY
Regional wall motion abnormalities, Ejection fraction estimation helps in establishing prognosis after MI. Echo aid”s in early detection of potentially viable but stunned myocardium , residual provocable ischemia, patients at risk of developing CCF and mechanical complications after MI.
C] DOPPLER ECHOCARDIOGRAPHY
For assessment of blood flow in the cardiac chambers and across cardiac valves. Helps in detecting severity of MR or TR after MI, identification of site of acute ventricular septal rupture, quantification of shunt flow across the defect, and assessment of acute cardiac tamponade.
D] NUCLEAR IMAGING45
COMPLICATIONS OF MYOCARDIAL INFARCTION 1. Left ventricular failure
2. Hypotension
3. Cardiogenic Shock
4. Mechanical Complications, Free wall rupture, Rupture of interventricular septum, Rupture of papillary muscles.
5. Mitral regurgitation 6. Arrhythmias
7 .Electrical instability – Ventricular premature complex,ventricular tachycardia, ventricular fibrillation.
8. Pump failure / excessive sympathetic stimulation .
9.Atrial fibrillation, Paroxysmal supraventricular tachycardia, sinus tachycardia. 10. Bradyarrhythmias and conduction disturbances – Sinus bradycardia
AV blocks and Intraventricular Blocks, Junctional escape rhythms.
OUTCOME
Outcome in acute MI can be assessed in three phases: in hospital, early (< 30day) and late (beyond 30 days )
MORTALITY:
The overall mortality rate following STEMI is approximately 4-7% in the published clinical trials9.However, this is not the case in real world situation, which can be obtained from registry data11.In a study published in Scotland, the case fatality rate is about 22.2%46. In MITRA,MIR 47registry data from Germany, the overall mortality is around 15% .In India, CREATE registry data recorded 30 day mortality rate of about 8.6% in STEMI .Study from Vellore in South India, reported in hospital mortality of 16.9% in a group of 1320 patients with acute STEMI.
MORBIDITY :
Patients with STEMI are having the maximum number of complications because of transmural involvement. Other factors responsible are larger size of infarct and absence of tissue perfusion at the microvacular level48,49
HYPONATREMIA
DEFINITION
50Hyponatremia is defined as a serum sodium concentration of <135mmol/l after the exclusion of “pseudo-hyponatremia”.
ETIOLOGY
51,52,53,54CAUSES OF HYPONATREMIA I. Normal plasma osmolality-
1. Hyperlipidemia 2. Hyperproteinemia
3.Post transurethral resection of prostate PSEUDOHYPONATREMIA
Extreme elevations in plasma lipids or proteins increase the plasma volume and can reduce the measured plasma sodium concentration.The hyponatremia in this situation does not represent a decrease in extracellular sodium relative to extracellular water .
II. Increased plasma osmolality- 1.Hyperglycemia
III. HYPO OSMOLAL HYPONATREMIA
A. PRIMARY SODIUM LOSS (SECONDARY WATER GAIN) 1. Integumentary loss: sweating, burns
2. Gastrointestinal loss: vomiting, tube drainage, fistula, obstruction, diarrhea 3. Renal loss: diuretics, osmotic diuresis, hypoaldosteronism, salt-wasting nephropathy, post obstructive diuresis, nonoliguric acute tubular necrosis.
B. PRIMARY WATER GAIN (SECONDARY SODIUM LOSS) 1. Primary polydipsia
2. Decreased solute intake (e.g., beer potomania) 3. AVP release due to pain, nausea, drugs
4. Syndrome of inappropriate ADH secretion 5. Glucocorticoid deficiency
6. Hypothyroidism
7. Chronic renal insufficiency
C. PRIMARY SODIUM GAIN (EXCEEDED BY SECONDARY WATER GAIN)
NEUROHORMONAL ACTIVATION FOR HYPONATREMIA
FOLLOWING ACUTE MYOCARDIAL INFARCTION
55
In acute myocardial infarction, nonosmotic release of vasopressin may occur due to the acute development of left ventricular dysfunction, in response to pain, nausea56, and major stress, or in response to the administration of analgesics and diuretics57.
In this setting, vasopressin levels increase concomitantly with the activation of other neurohormones such as rennin and nor epinephrine58. However, vasopressin level does not correlate with serum osmolarity in myocardial infarction, suggesting that nonosmotic mechanisms are involved59.
Activation of carotid barorecepters has been implicated in the nonosmotic release of vasopressin due to arterial underfilling59.In addition, increased expression of messenger RNA for vasopressin in the hypothalamus has been described.
In patients with myocardial infarction, hyponatremia may be aggravated further by the concomitant activation of the renin-angiotensin system and increased catecholamine production61,62. These factors decrease the glomerular filtration rate and subsequent delivery of tubular fluid to the diluting segment of the nehpron, further contributing to decreased renal water exertion.
Flear CT, Hilton P22 in their study of 235 patients admitted to a coronary care unit,concluded that hyponatremia, hypochloraemia, and uremia were common in patients with confirmed myocardial infarctions, the degree of infarctions correlating well with all the above indices of severity. They also found higher in-hospital mortality rates among patients with minimal plasma sodium levels < 130mmol/L.
Szatalowicz VL, Arnold PE, Chaimotivz C, Bichet D, Berl T, Schrier RW in their study have shown that Vasopressin is essential for the development of hyponatremia and arginine vasopressin levels were detectable in 30 of 37 patients with congestive heart failure. They also found that the degree of neurohormonal activation correlates with the severity of hyponatremia in patients with chronic heart failure63.
Sigurdsson A20, Held P, Swedberg K in their study of 55 patients with acute myocardial infarction concluded that sustained neurohormonal activation after myocardial infarction mainly occurs in patients with clinical heart failure and is related to the magnitude of myocardial damage, even in patients without heart failure.
Goldberg A et al64 in their study of 978 patients have concluded that early hyponatremia is a simple marker of neurohormonal activation during the acute phase of myocardial infarction and predicts the long-term development of heart failure and death .
Rouleau JL et al in their study of 534 patients have concluded that neurohormonal activation at the time of hospital discharge in post infarction patients is an independent sign of poor prognosis65 .
MATERIALS
AND
METHODS
MATERIALS AND METHODS
50 patients admitted to the intensive coronary care unit of Thanjavur medical college hospital between September 2009 and October 2010, with acute ST elevation myocardial infarction (STEMI) were studied in a prospective manner.
STUDY DESIGN:
1) Single centred
2) Prospective
3) Follow up study
Acute STEMI was diagnosed according to the following criteria.
DIAGNOSIS OF STEMI:
1. Presence of chest pain of >20min duration and
2. ST segment elevation of >1mm in atleast two standard limb leads
or >2mm in atleast two contiguous precordial leads or new onset of
Left bundle Branch block and / or
STUDY PARTICIPANTS:
INCLUSION CRITERIA:
Patients who presented within 12 hrs of onset of symptoms, with electrocardiographic evidence of STEMI,elevated cardiac biomarkers and received thrombolytic therapy with streptokinase were included in our study.
EXCLUSION CRITERIA :
1. Patients with Non STEMI or Unstable angina.
2. People with previous history of coronary artery disease.
3. People with previous history of arrhythmias.
4. People with previous history of cardiomyopathy or heart failure.
5.People with previous diuretic use.
6.People with cirrhosis of liver,renal disease,hypothyroidism.
7.Serum Creatinine > 2mg% , Blood urea > 60mg/dl.
METHODS
12 lead ECG was taken for all patients, Leads V3R, V4R was taken in patients with inferior wall myocardial infarction.
Location of the infarct were defined as follows
Anteroseptal MI : ST elevation in V1 – V4 Apical MI : ST elevation in V5 – V6
Anterolateral MI : ST elevation in LI,avL,V4-V6 Extensive Anterior wall MI : ST elevation in LI,avL,V1-V6 Inferior wall MI : ST elevation in LII,LIII, aVF Right ventricular MI : ST elevation in V3R , V4R
Posterior wall MI : Tall and wide R wave, depressed and concave upwards ST, upright and widened T wave in V2. The data regarding the baseline characters of the patients like age, gender, smoking habit, diabetes mellitus and hypertension were recorded. Hemodynamic status of the patient were assessed by recording the pulse , blood pressure, jugular venous pressure (JVP). Careful auscultation of cardiovascular, respiratory system was done to look for the presence of S3, S4 gallop, murmur and crepitations.All findings were recorded.
Plasma sodium concentrations were obtained on admission and at 24, 48 and 72 hours thereafter.For every 100mg/dl rise in blood sugar the plasma sodium was reduced by 1.4 meq/dl.
All the patients were treated with antiplatelet drugs , sorbitrate ,morphine, atorvastatin ,ACE inhibitors, betablockers and with accordance to AHA /ACC guidelines as and when required .
All the participants were put on continuous electrocardiographic monitoring for 24 hrs.12 lead ECG was repeated one hour after thrombolysis , every 24 hrs ,and also whenever the situation demanded .
Hemodynamic status was assessed at regular intervals by clinical methods. Arrhythmias were recognized promptly with continuous ECG monitoring and confirmed with 12 lead ECG most of the time. Stable patients were transferred to the medical ward. Ejection Fraction, regional wall motion was analysed with echocardiogram.
After discharge the patients were followed up in the outpatient department weekly for 30 days. Morbidity, mortality data were recorded .
STUDY END POINTS
MEASUREMENT OF SERUM SODIUM
Plasma sodium concentrations were determined by using an ion selective electrode auto analyzer (Roche OMNIC). Hyponatremia was defined as sodium level less than 135mmol/L (<135 mEq/L).
STUDY PROTOCOL
Approval for this study was obtained from Research and ethical committee of Thanjavur Medical College, Thanjavur. Written and informed consent was obtained from all patients. Data were derived from patients by direct interrogation and examination.
STATISTICAL METHOD
All the data were analyzed with SPSS software (version13.0)
Odd”s ratio,Confidence interval,Mean , standard deviation were calculated. Suitable parametric and non parametric tests (Chi square test for non continuous variables,Analysis of variance for continuous variables Z test ), Univariate and multivariate logistic regression tests were used to determine the association between hyponatremia and 30-day mortality.
RESULTS
OBSERVATIONS AND RESULTS
[image:35.595.51.434.225.686.2]
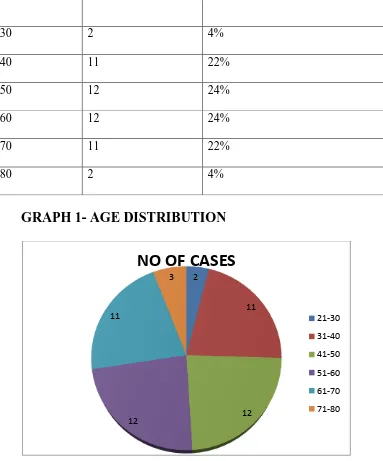
TABLE NO 1 –AGE DISTRIBUTION OF CASES
GRAPH 1- AGE DISTRIBUTION
In our study majority of the cases were in the age group of 41-60. Minimun age was 29 ,maximum age was 80. Mean age was 51.46, SD 12.8.
2
11
12 12
11
3
NO OF CASES
21-30
31-40
41-50
51-60
61-70
71-80 AGE NO OF CASES PERCENTAGE
21-30 2 4%
31-40 11 22%
41-50 12 24%
51-60 12 24%
61-70 11 22%
SEX DISTRIBUTION OF CASES
Table no 2 SEX DISTRIBUTION OF CASES
S.no Content Males Females
1 Numbers 40 10
2 Mean Age 51.35±12.8 52±13.4
4 MEAN SODIUM LEVEL 136.8±3.2 135.7±3.7
5 Death 8 3
In our study 80% were males and 20% were females.M:F-4:1. GRAPH 2 SHOWING SEX DISTRIBUTION OF CASES
0 5 10 15 20 25 30 35 40
males females
40
10
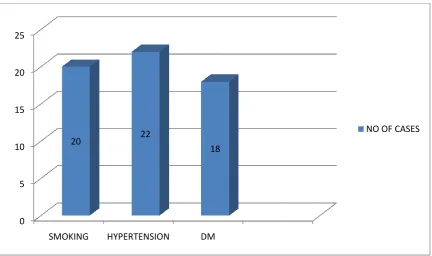
TABLE -3 SHOWING DISTRIBUTION OF RISK FACTORS
S.No. RISK FACTORS NO. OF CASES PERCENTAGE
1 HYPERTENSION 22 44 %
2 SMOKING 20 40 %
3 DM 18 36 %
GRAPH 3 SHOWING DISTRIBUTION OF RISK FACTORS
0 5 10 15 20 25
SMOKING HYPERTENSION DM
20 22
18
TYPE OF STEMI:
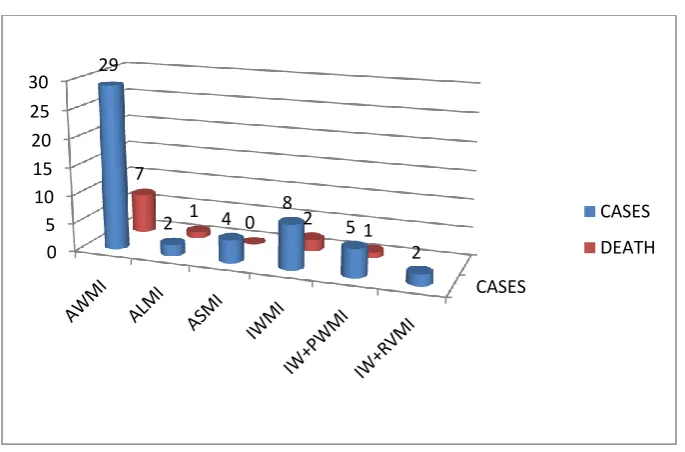
[image:38.595.71.414.517.743.2]In our study, Anterior wall Myocardial infarction predominated followed closely by inferior wall myocardial infarction.
TABLE-4 SHOWING TYPE OF STEMI:
S.No Type No. of Cases Percentage Death
1 AWMI 29 58 % 7
2 ASMI 4 8 % 0
3 ALMI 2 4 % 1
4 IWMI 8 16 % 2
5 IWMI+PWMI 5 10 % 1
6 IWMI +RVMI 2 4 % 0
GRAPH- 4 SHOWING DISTRIBUTION OF TYPE OF STEMI
CASES 0
5 10 15 20 25
30 29
2 4 8 5
2 7
1
0 2 1 CASES
OUR STUDY PATIENTS WERE DIVIDED INTO THREE GROUPS
Group A = patients with normal sodium levels Group B = patients with hyponatremia on admission
[image:39.595.67.251.275.406.2]Group C = patients who developed hyponatremia within 72 hours All base line characteristics of the three groups were compared. TABLE 5
GROUP NO.OF CASES
A 35
B 6
C 9
GRAPH 5 SHOWING NO.OF CASES IN EACH GROUP
35
6 9
NORMAL SODIUM LEVELS
HYPONATREMIA ON ADMISSION
GRAPH 6-MEAN AGE IN STUDY GROUPS
Patients who presented with hyponatremia on admission (52±14)
were of higher age when compared to patients with normal sodium levels (50 ±12).
GRAPH 7 SEXWISE DISTRIBUTION IN STUDY GROUPS
As evidenced males constituted majority of the cases in all the three groups.There were 29 males in group A, 4 males in group B and 7 males in group C.There were 6 females in group A, 2 in group B and 2 in group C.
44 45 46 47 48 49 50 51 52
GROUP A GROUP B GROUP C
50 52 47
AGE
AGE 0 5 10 15 20 25 30 35GROUP A GROUP B GROUP C
GRAPH 8-RISK FACTORS AMONG THE THREE GROUPS
67% were diabetic , 50% were smokers, 67% were hypertensives among patients who presented with hyponatremia on admission.
Among patients who had normal sodium levels only 31% were diabetic, 40% were smokers and 40% were hypertensive. The proportion of diabetic, hypertensive and smokers were more among patients with hyponatremia.
11
14 14
4 4
3 3
4
3
0 2 4 6 8 10 12 14 16
DM HYPERTENSION SMOKING
GROUP A
GROUP B
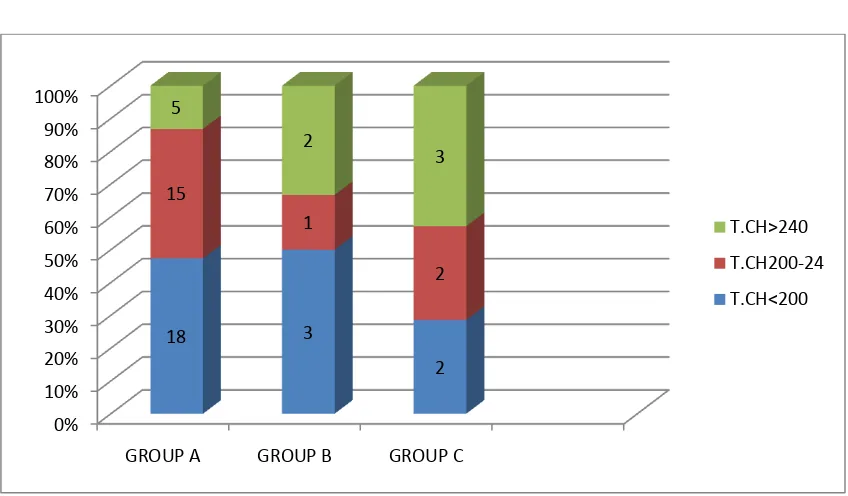
TABLE-6 TOTAL CHOLESTROL IN THREE GROUPS
The mean cholesterol was found to be 209.18mg/dl and S.D was 29.3 GRAPH 9-TOTAL CHOLESTROL IN THREE GROUPS
Among patients who had total cholesterol >200 mg/dl 8 patients had hyponatremia.Only 5 patients in the hyponatremia group had total cholesterol <200mg/dl. 0% 10% 20% 30% 40% 50% 60% 70% 80% 90% 100%
GROUP A GROUP B GROUP C
18 3 2 15 1 2 5 2 3 T.CH>240 T.CH200-24 T.CH<200 S. NO CONTENTS T.CH < 200 T.CH 200 –
240
T.CH > 240
1 TOTAL CASES 23 17 10
2 PERCENTAGE 46% 34% 20%
3 GROUP A 18 15 5
4 GROUP B 3 1 2
5 GROUP C 2 2 3
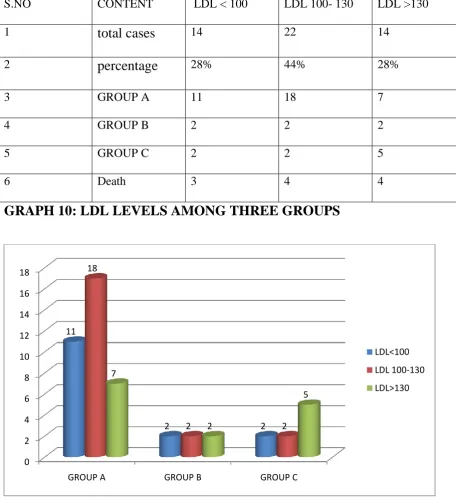
TABLE 7: LDL CHOLESTEROL LEVELS IN THREE GROUPS
S.NO CONTENT LDL < 100 LDL 100- 130 LDL >130
1 total cases 14 22 14
2 percentage 28% 44% 28%
3 GROUP A 11 18 7
4 GROUP B 2 2 2
5 GROUP C 2 2 5
6 Death 3 4 4
GRAPH 10: LDL LEVELS AMONG THREE GROUPS
The mean LDL cholesterol was 115.3mg/dl. Levels > 130mg/dl were present in 28%. Among them 7 had normal sodium levels,2 had hyponatremia on admission and 5 developed hyponatremia within 72 hours.
0 2 4 6 8 10 12 14 16 18
GROUP A GROUP B GROUP C
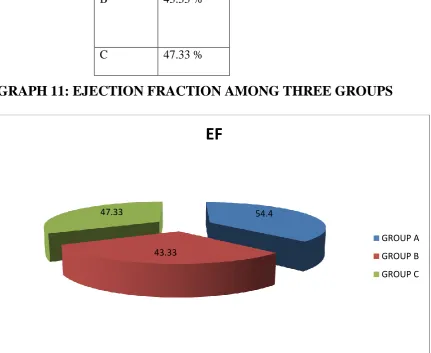
TABLE 8 : EJECTION FRACTIONS AMONG THREE GROUPS
GRAPH 11: EJECTION FRACTION AMONG THREE GROUPS
The mean ejection fraction was lower among patients who presented with hyponatremia or developed hyponatremia within 72 hours when compared with patients with normal sodium levels.
54.4
43.33 47.33
EF
GROUP A
GROUP B
GROUP C GROUP MEAN EF
A 54.4 %
B 43.33 %
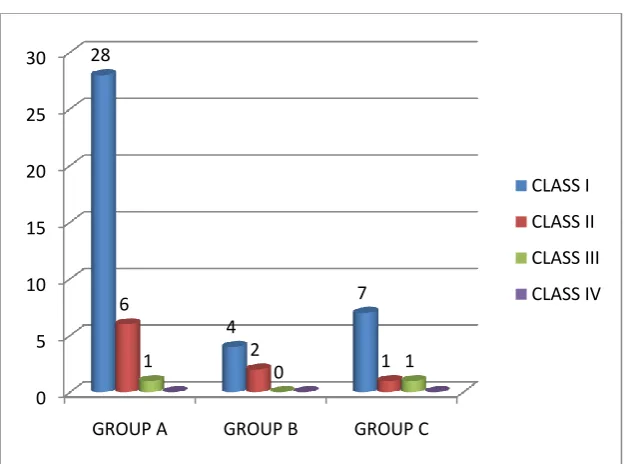
TABLE 9:KILLIP CLASS AMONG THREE GROUPS KILLIP
CLASS
Normal sodium
levels(n=35)
Hyponatremia on
admission
(N=6)
Hyponatremia
within 72 hrs
(N=9)
DEATH
CLASS I 28 (80 %) 4 (66%) 7 (77%) 6 (54%)
CLASS II 6 (17%) 2 (33%) 1 (11%) 4 (36%)
CLASS III 1 (2%) 0 1 (11%) 1 (9%)
CLASS IV 0 0 0 0
A total of 6 patients with killip class I expired. Among them 4 had hyponatremia on admission and 2 developed hyponatremia within 72 hours and no deaths occurred in patients with normal sodium levels.4 patients with killip
class II expired.Among them 2 patients had hyponatremia on admission , 1 patient developed hyponatremia within 72 hours.
GRAPH 12-KILLIP CLASS AMONG THREE GROUPS
0 5 10 15 20 25 30
GROUP A GROUP B GROUP C
28 4 7 6 2 1
1 0 1
CLASS I
CLASS II
CLASS III
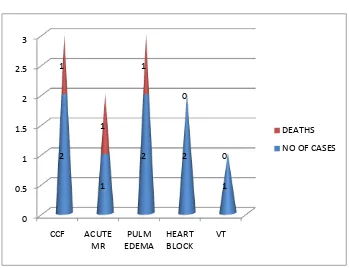
TABLE 10
IN HOSPITAL COMPLICATIONS
S. No
Complication Count Percentage Death Mean Sodium Level Meq/l
1 CCF 2 4% 1 133.75
2 Acute MR 1 2% 1 129
3 Pulmonary edema 2 4% 1 137.8
5 Heart block 2 4% 0 138.25
6 Ventricular Tachycardia
1 2% 0 134.25
GRAPH 13-IN HOSPITAL COMPLICATIONS
0 0.5 1 1.5 2 2.5 3 CCF ACUTE MR PULM EDEMA HEART BLOCK VT 2 1 2 2 1 1 1 1 0 0 DEATHS
TABLE 11- SHOWING MORTALITY AMONG THREE GROUPS
In our study, 35 patients had normal sodium levels,6 had hyponatremia on admission and 9 developed hyponatremia within 72 hours.The overall mortality rate was 22% (11 out of 50).
GRAPH 14 - SHOWING MORTALITY AMONG THREE GROUPS
0 5 10 15 20 25 30 35
NO OF PATIENTS
MORTALITY 35 4 6 5 9 2
NORMAL SODIUM LEVELS
HYPONATREMIA ON ADMISSION
HYPONATREMIA WITHIN 72 HRS NORMAL SODIUM LEVELS HYPONATREMIA ON ADMISSION HYPONATREMIA
WITHIN 72 HRS
TOTAL
NO. OF
PATIENTS
35 6 9 50
TABLE 12 COMPARING MORTALITY RATES AMONG THE THREE GROUPS
GROUP MORTALITY RATES
GROUP A 11.4%
GROUP B 83.4%
GROUP C 22%
GRAPH 15 COMPARING MORTALITY RATES AMONG THE THREE GROUPS
11.40%
83.40% 22%
MORTALITY
GROUP A
GROUP B
TABLE 13 SHOWING SEVERITY OF HYPONATREMIA AND OUTCOME IN TERMS OF MORTALITY
SODIUM LEVELS NO.OF CASES MORTALITY
<130 MEQ/L 4 4(100%)
131-134 MEQ/L 11 3(27.3%)
Among 4 patients with sodium level <130meq/l the mortality rate was 100%. 11 patients had sodium levels between 131-134,out of which only 3 expired.
GRAPH 16- SHOWING SEVERITY OF HYPONATREMIA AND OUTCOME IN TERMS OF MORTALITY
4
11
4
3
0 2 4 6 8 10 12
<130 131-134
NO. OF PATIENTS
[image:49.595.73.505.417.680.2]Table 14 SHOWING IN HOSPITAL AND POST DISCHARGE DEATH.
[image:50.595.66.531.443.577.2]During the hospital stay three patients expired.Each group had one mortality.During follow up period three patients were re-admitted with post infarction failure and expired. Each group had one mortality. Out of the remaining 5 deaths ,2 patients belonged to group A and 3 belonged to group B. There was no mortality in group C .
TABLE 15 SHOWING CASES READMITTED WITH POST INFARCTION FAILURE AND DEATH.
GROUP NO. OF CASES MEAN SODIUM
Group A 1 141
Group B 1 128.75
Group C 1 133
As evidenced from the above table the mean sodium levels were low for patients who got re-admitted with post infarction failure.
S.NO NO .OF DAYS NO. OF DEATHS MEAN SODIUM
1 <7 days 3 133.3 meq/l
TABLE16-SHOWING BASE LINE CHARACTERISTICS OF 50 PATIENTS
All the baseline characteristics among the three groups of patients were compared.
S.NO Characteristics Normal sodium levels(n=35) Hyponatremia on admission (N=6) Hyponatremia within 72 hrs (N=9)
P value
1 Age(yrs) 50 ± 12 52 ± 14 47 ± 17 P=0.06 2 Male sex 29(82%) 4(67%) 7(78%) P=0.04
3 Diabetes 11(31%) 4(67%) 3(33%) P=0.03
4 Smoking 14(40%) 3(50%) 3(33%) P=0.05
5 Hypertension 14(40%) 4(67%) 4(44%) P=0.1
6 Anterior wall infarction
23(66%) 4(67%) 8(89%)
P=0.02 7 T.Cholestrol 208.7±29.78 212±30.1 214±33.4 P=0.6 8 S.ldl 114.5±20.8 121.5±31.3 122.4±29.4 P=0.3 9 Killip class class I-28
classII-6 class III-1 class I-4 class II-2 class III-0 class I-7 class II-1 class III-1 P=0.001 10 Ejection
fraction(%)
Patients who presented with hyponatremia on admission belonged to a higher age group than patients with normal sodium levels.
67% of patients who presented with hyponatremia on admission and 78% of patients who developed hyponatremia within 72hrs were males.
Patients who presented with hyponatremia or developed hyponatremia within 72 hours more often were smokers(67%) and had diabetes(67%), anterior infarction(67and89%), lower ejection fraction(43.33±7.68) when compared to patients with normal sodium levels.
ODDS RATIO FOR 30 DAY MORTALITY
TABLE NO 17- ODDS RATIO- GROUP A VERSUS OTHER GROUPS
SURVIVORS NON
SURVIVORS
ODDS RATIO
Z
SCORE P
VALUE
GROUP A 31 4
GROUP B 1 5 38.75 3.004 0.027
GROUP C 7 2 0.057 2.108 0.035
Odds ratio for 30 day mortality was found to be high in
TABLE NO 18 COMPARING SURVIVORS AND NON SURVIVORS S.NO Risk factors Survivors Nonsurvivors T or X2 P value
N 39 11
1 Age(yrs) (mean ±SD)
48.89±11.6 55.1±17.9 1.382 0.173
2 Sex M F
32(82%) 7(18%)
8(72%) 3(27%)
0.7 0.09
3 Hyponatremia (mean
±SD)
135.02±1.65 130.9±2.7 6.29 0.001
4 Smoking 12(61%) 8(72%) 0.09 0.7 5 Diabetes 11(33%) 7(45%) 0.14 0.70 6 Hypertension 14(36%) 7(63%) 1.5 0.2 7 Infarct site
Anterior Inferior 17(43%) 12(31%) 8(72%) 3(27%) 1.8 0.01 0.17 0.9 8 T.Cholestrol 207.38±28.7 215.54±33.21 0.540 0.5 9 S.LDL 113.28±20.8 122.5±25.8 0.53 0.3 10 Killip class I
II III 33(85%) 5(13%) 1(2%) 6(54%) 4(36%) 1(9%)
0.62 0.04
11 EF(%)(mean ±SD)
54.35±11.2 42.72±9.2 3.15 0.002
It was seen that serum sodium levels was statistically significant in determining mortality. Mean serum sodium level was 135.02±1.65 in the survivors and 130.9±2.7 in non survivors.
Other factors such as Killip class, ejection fraction, hypertension, diabetes, age , sex,dyslipidemia were found to influence mortality.
TABLE NO 19 SUMMARY OF RISK FACTORS IN PREDICTING MORTALITY
As evidenced from the above table killip class,ejection fraction and hyponatremia on admission or early development of hyponatremia significantly influenced mortality.Multivariate analysis showed that along with other risk factors, hyponatremia was a significant independent predictor of 30 day mortality.
VARIABLE P VALUE
AGE 0.1
SEX 0.09
SMOKING 0.7
HYPERTENSION 0.7
DIABETES 0.2
DYSLIPIDEMIA 0.3
KILLIP CLASS 0.04
HYPONATREMIA ON ADMISSION 0.001
HYPONATREMIA WITHIN 72 HOURS 0.008
[image:55.595.65.532.152.526.2]
DISCUSSION
DISCUSSION
In acute myocardial infarction the development of hyponatremia is a marker that probably incorporates different prognostic entities,including severe left ventricular dysfunction,hemodynamic alterations,and the extent of neurohormonal activation.
Goldberg A66 et al studied 1047 patients with acute ST elevation MI, without past history of heart failure.It was found that hyponatremia on admission or early development of hyponatremia was independently associated with short term mortality.
AGE DISTRIBUTION IN MYOCARDIAL INFARCTION
Our study comprised of 50 pateints with acute ST elevation MI. The mean age was 51.4 ± 12.8 .Majority of the cases were in the age group of 41-60 . In the study conducted by Aziz M et al67 , the mean age was 57.28±6. In Goldberg”s study the mean age was 61±12.When compared to the other studies it is seen that Indians are prone to get MI at an earlier age.
SEX DISTRIBUTION IN MYOCARDIAL INFARCTION
RISK FACTORS IN MYOCARDIAL INFARCTION
In our study 20 patients were smokers, 22 were hypertensive and 18 were diabetic.Among 11nonsurvivors,72% were smokers,63% were
hypertensive,45% were diabetic.Killip and Norris et al 68in the Framingham heart study said that diabetes and smoking increases the risk of death after myocardial infarction.In GISS-2 trial69, out of 11483 hypertensive MI
patients,3306 patients expired. Our study reveals that Diabetes,Hypertension and smoking are important risk factors in determining mortality.
PREVALANCE OF HYPONATREMIA
In our study, hyponatremia was present on admission in 6 patients (12%). Hyponatremia developed in 9 patients(18%) during the first 72 hours of
ASSOCIATION BETWEEN HYPONATREMIA AND AGE
Patients who presented with hyponatremia on admission belonged to a higher age (52 ± 14) when compared to patients with normal sodium levels who belonged to younger age (50 ±12). In the study conducted by Goldberg A, Hammerman H et al, mean age among patients with normal sodium levels was 61±13 and hypontremic individuals was 63±13.
ASSOCIATION BETWEEN HYPONATREMIA AND SEX
ASSOCIATION BETWEEN HYPONATREMIA,DIABETES,SMOKING AND HYPERTENSION.
Among patients with normal sodium levels 31% were diabetic, 40% were smokers and 40% were hypertensive.In patients who presented with hyponatremia on admission 67% were diabetic,50% were smokers,67% were hypertensive.In patients who developed hyponatremia within 72 hours after admission 33% were diabetic, 33% were smokers and 44% were hypertensive. Thus hyponatremia was more common among smokers,diabetic and hypertensive individuals.This is in accordance to the studies conducted by Goldberg A , Hammerman H et al,Aziz M et al,Hilis et al71.
ASSOCIATION BETWEEN HYPONATREMIA AND DYSLIPIDEMIA
54% of individuals had serum total cholesterol >200mg/dl.In hyponatremia group 8 patients had total cholesterol >200 mg/dl and 5 patients had total cholesterol <200mg/dl..
ASSOCIATION BETWEEN HYPONATREMIA AND ANTERIOR WALL INFARCTION
The incidence of anterior wall MI among patients with normal sodium levels,hyponatremia on admission and patients who developed hyponatremia within 72 hours was 66%,67% and 89% respectively.This was higher than the results of golberg”s study which was 37%,49% and 45% respectively. Studies done by Krumholz72 et al,Hillis et al also showed that hyponatremia was common in anterior wall infarction.
ASSOCIATION BETWEEN HYPONATREMIA AND KILLIP CLASS
ASSOCIATION BETWEEN HYPONATREMIA AND EJECTION FRACTION
The mean ejection fraction was lower among patients who presented with hyponatremia( mean EF 43.33%) or developed hyponatremia within 72 hours(mean EF 47.33%) when compared to patients with normal sodium levels(mean EF 54.4%). Our results were consistant with the study conducted by Goldberg A ,Hammerman H et al, were the mean EF among patients with normal sodium levels,hyponatremia on admission and hyponatremia within 72 hours was 47%,42% and 42% respectively.
ASSOCIATION BETWEEN HYPONATREMIA AND MORTALITY
The overall mortality rate in our study was 22%.Mortality among patients with normal sodium levels was 11 %,mortality with hyponatremia on admission was 83%, and mortality with hyponatremia within 72 hours was 22 % .
ASSOCIATION BETWEEN SEVERITY OF HYPONATREMIA AND MORTALITY
4 patients had a sodium level of <130meq/l and the mortality rate was 100%. Among patients with sodium levels between 131-134meq/l,mortality was 27% (3/11 patients).In comparission with other studies by Goldber A, Aziz M et al and Rahman et al 73our study had a higher mortality rate.
From our study it is evident that patients who presented with hyponatremia or developed hyponatremia early after admission were males belonging to a higher age group,had diabetes,hypertension,smoking history ,anterior infarction and lower ejection fraction. This is in accordance to the studies conducted by Goldberg A,Hammerman H et al,Aziz M et al.
It was seen that serum sodium levels was statistically significant in determining mortality. Among survivors mean serum sodium level was 135.02±1.65 and lowest level was 133meq/l. Among non survivors mean serum sodium level was 130.9±2.7 and lowest level was 127meq/l.
Multivariate analysis showed that hyponatraemia on admission or early development of hyponatremia in patients with acute ST-Elevation MI appeared to be a strong independent predictor of short term mortality.
Prognosis worsens with increasing severity of hyponatraemia. Plasma sodium levels may serve as a simple marker to identify patients at high risk.
CONCLUSION
1. Asians are prone to develop STEMI at a youger age than western population.
2. In Indians hypertension, smoking, dyslipidemia, diabetes are predominant risk factors for STEMI.
3. Hyponatremia on admission or early development of hyponatremia within 72 hours was associated with a poor prognostic outcome.
4. Severity of hyponatremia predicts mortality.
Sodium levels <130 meq/l was associated with 100% mortality when compared to levels between 131-134 meq/l which had a mortality rate of 27%.
5. Patients with hyponatremia on admission or those who developed
hyponatremia within 72 hours were males belonging to a higher age group, with lower ejection fraction, anterior wall infarction and a higher proportion of them were smokers,hypertensive,diabetic and had dyslipidemia.
6. Along with other risk factors, hyponatremia on admission or early
BIBILOGRAPHY
BIBILOGRAPHY
1.Lopez AD, Mathers CD, Ezatti M, et al .Global and regional burden of disease and risk factors2001: systematic analysis of population health data, Lancet 2006;367:1747-57
2.Castelli WP.Epidemiology of coronary heart disease; the Framingham study. Am J Med 1984 : 27 : 4 – 12.
3. Roger’s WJ, Canto JG et.al., Temporal trends in the treatment of over 1.5
million patients with Myocardial Infarction in the US from 1990 through 1999. The national registry of Myocardial Infarction 1,2&3. J.Am.Coll Cardiol 36 ; 2056;2000.
4 .Reddy KS, Cardiovascular disease in non -Western countries NEngl J Med 2004;350(24):2438-40
5 .Ghaffer A, Reddy KS, Singhi M. Burden of non- communicable diseases in South Asia BMJ 2004; 328:807-10
7 .Joshi P, Islam S,PaisP,etal. Risk factors for early myocardial infarction in South Asians compared with individuals in other countries JAMA
2007;297:286-9
8 .Pais P, Xavier D, Gupta R, et al .Treatment and outcome of acute coronary syndrome in India the (CREATE):a prospective analysis of registry data Lancet 2008;371:1435-42
9. Brown N, Young T, Gray D etal. Inpatient deaths from acute myocardial infarction 1982-1992: analysis of data in Nottingham heart attack register BMJ1997;315:159-164
10 .Every NR, Freiderick PD, Robinson M, et al .A comparison of the National registry of myocardial infarction -2 with the co-operative cardiovascular project J Am Coll Cardiol 1999;33:1886-94
11 .ZeymerU , Senges J. Why do we need prospective registries in patients with myocardial infarction Eu heart J 2003;24:1611-12
12 .V Jacob Jose ,Satya N Gupta et al Morbidity and mortality of acute ST segment elevation myocardial infarction in the current era Indian Heart J2004;56:210-14
14. Clayton JA, Le Jeune IR, Hall IP. Severe hyponatraemia in medical in patients: aetiology, assessment and outcome. QJM. 2006;99:505-511.
15 . Zilberberg MD, Exuzides A, Spalding J, et al. Epidemiology, clinical and economic outcomes of admission hyponatremia among hospitalized patients. Curr Med Res Opin. 2008;24:1601-1608.
16. Chung HM, Kluge R, Schrier RW Anderson RJ. Postoperative hyponatremia.A prospective study. Arch Intern Med. 1986;146:333-336
17. Schrier RW, Abraham WT. Hormones and hemodynamics in heart failure. NEngl J Med.1999;341:577-585
18. Lee WH, Packer M. Prognostic importance of serum sodium concentration and its modification by converting-enzyme inhibition in patients with severe chronic Hyponatremia. Circulation. 1986;73:257-267
19. Saxon LA, Stevenson WG, Middlekauff HR, et al. Predicting death from progressive heart failure secondary to ischemic or idiopathic dilated
cardiomyopathy. Am J Cardiol.1993;72:62-65
20. Sigurdsson A, Held P, Swedberg K. Short- and long-term neurohormonal activation following acute myocardial infarction. Am Heart J.1993; 126:1068-1076.
22. Flear CT, Hilton P. Hyponatremia and severity and outcome of myocardial infarction. BMJ. 1979; 1: 1242-1246.
23. Oren RM. Hyponatremia in congestive heart failure. Am J Cardiol.2005;95:2B-7B
24.. Lee DS, Austin PC, Rouleau JL, Liu PP, Naimark D, Tu JV. Predicting
mortality among patients hospitalized for heart failure: derivation and validation of a clinical model. JAMA 2003;290:2581–2587.
25. Klein L, O’Connor CM, Leimberger JD, et al. Lower serum sodium is associated with increased short-term mortality in hospitalized patients with worsening heart failure: results from the Outcomes of a Prospective Trial of Intravenous Milrinone for Exacerbations of Chronic Heart Failure (OPTIME-CHF) Study. Circulation.2005;111:2454-2460
26. Gazino JM. Global burden of cardiovascular disease. In: Zipes, Libby, Bonow,Braunwald editors. Brauwnwalds Heart disease, a text book of
cardiovascular medicine. 8th edn. Philadelphia: Elsevier Saunders; 2008. Part 1 p.1-13
28. A.Fuster V, Badimon L, Badimon JJ, Chesebro JH. The pathogenesis of coronary artery disease and the acute coronary syndromes. Part 1. N Engl J Med 1992:326;242–250.
29.Fuster V, Moreno PR, Fayad ZA, Corti R, Badimon JS. Atherothrombosis and high-risk plaque: part 1: evolving concepts. J Am Coll Cardiol
2005;46:937–954.
30. Antman EM, Braunwald E. ST segment elevation Myocardial infarction. In :Kasper, Brounwald, Fauci, Hauser, Longo, and Jameson editors. Harrison’s Principles of Internal Medicine vol-2.17th edn. Newyork: McGraw Hill; 2008.p. 1532-1543.
31.Killip T and Kumball JT. Treatment of AMI in coronary care unit: A 2 year experience with 250 patients. Am. J Cardiol 1967; 20: 457.
32. Mirvis DM, Goldberger AL. Electrocardiography. In: Zipes, Libby, Bonow,Braunwald editors. Braunwalds Heart disease a text book of
cardiovascular medicine. 8th edn.: Elsevier Saunders; 2008. Chapter 12 p. 172-177
33. Penttila K,Koukkunen H,Hallinen et al:myoglobin,ck mb in early detection of MI.clin Biochem 35:647,2002
35. Yamashita T, Abe S, Arima S et al. MI size can be estimated from serial plasma myoglobin measurements within 4 hours of reperfusion. Circulation 1993; 87: 1840
36. Mair J, Morandell D. Equivalent early sensitivity of myoglobin, CKMB (mass), CK isoform ratio, cTnI and cTnT. Clin Chem 1995; 41: 1266
37. Marshall T, Williams J and Williams KM. Electrophoresis of serum enzymes and proteins following AMI. J Clin Cardiol 1991; 569: 323.
38. Apple FS. Glycogen phosphorylase BB (GPBB) and other cardiac proteins challenge to CKMB as the marker for detecting MI. Clin Chem 1995; 41: 963. 39. Ryder RE, Hayes TM, Mulligan IP, et al. How soon after myocardial infarction should plasma lipid values be assessed? BMJ 1984 ; 289 ; 1651– 1653.
40 .Pyfe T, Baxter RH, Cochran DM, et al. Plasma lipid changes after myocardial infarction, Lancet 1971 ; 2 : 997 – 1001.
41..Jackson R, Scragg R, Marshall R, et al. Changes in serum lipid
concentrations during first 24 hours after myocardial infarction. BMJ 1987 ; 294 : 1588 – 1589.
42. Barron HV,cannon CP,Murphy SA-association between wbc
43. Bentoug, Crdinor R, Palmieri R et al. C-reactive protein in AMI – association with heart failure. Am Heart J 2003; 145: 1094.
44. Gotto AM Jr. Statins and C-reactive protein, considering a novel marker of cardiovascular risk. Orev cardiol 2002 ; 5 ; 200 – 203.
45. Klocke FJ,Barid MG,Batemann TM et al-ACC/AHA guidelines for radionuclear imaging,2006
46. Capwell S Livingston BM ,Maclntyre Ketal Trends of case fatality rate in 117718 patients admitted with acute myocardial infarction in Scotland Eur Heart J 2000 ;21:1833-1840
47. Gottwik M, Zahn R, Schiele Ret al Differences in treatment and out come in patients with acute myocardial infarction with compared to deparment without cardiology results from pooled data of the Maximal Individual Therapy in Acute myocardial infarction(MITRA 1+2) registries and the Myocardial Infarction Registry (MIR) Eur Heart J 2001;22:1794-1801
48. Ito H Maruyama A Iwakura ket al Clinical implications of the no reflow phenomenon:a predictor of complications and left ventricular remodeling in reperfused anterior wall myocardial infarction Circulation;1996; 93:223-228
50. Biswas M, Davies JS. Hyponatremia in clinical practice. Post grad Med J 2007; 83:373-378.
51. Saeed BO, Beaumont D, Handley JH, Weaver JU. Severe hyponatremia: investigation and management in district general hospital. Journal of Clinc Patho 2002; 55:893-896.
52. Kennedy PG, Mitchell DM, Hoff brand BI. Severe hyponatremia in hospital
inpatients. BMJ 1978;2:1251-1253,
53. Singer GG, Brenner BM. Fluid and electrolyte disturbances. In:
Kasper,Braunwald, Fauci, Hauser, Longo, and Jameson editors. Harrison’s principles of Internal Medicine vol - 1.17th edn: McGraw Hill; 2008.p. 277-278.
54. Adrogue HJ, Madias NE. Hyponatremia. N Engl J Med 2000; 342:1581-1589.
55. Mcalpine HM, Morton JJ, Leckie B, Rumley A, Gillen G, Dargie HJ. Neuroendocrine activation after acute myocardial infarction. Br Heart J 1988;60:117-124
57. Schaer GL, Covit AB, Laragh JH, Cody RJ. Association of hyponatremia with increased renin activity in chronic congestive heart failure: impact of diuretic therapy.Am J Cardiol. 1983;51:1635-1638.
58. Schaller MD, Nussberger J, Feihl F. Clinical and hemodynamic correlates of elevated plasma arginine vasopressin after acute myocardial infarction. Am J Cardiol 1987; 60:1178-1180.
59. Schrier RW, Berl T, Anderson RJ. Osmotic and nonosmotic control of vasopressin release. Am J Physiol 1979; 236:321-332.
60. Kumar S, Berl T. Sodium. Lancet 1998; 352:220-228.
61. Cohn JN, Levine TB, Olivari MT. plasma nor epinephrine as a guide to prognosis in patients with chronic congestive heart failure. N Engl J Med 1984; 311:819-823.
62. Dzau VJ, Colucci WS, Hollenberg NK, Williams GH. Relation of renninangiotension aldosterone system to clinical state in congestive heart failure.Circulation 1981; 63:645-651.
64. Goldberg A, Hammerman H, Petcherski S, Nassar M, Zdorovyak
A,Yalonetsky S et al. Hyponatremia and long term mortality in survivors of acute ST elevation myocardial infarction. Arch Intern Med 2006;166:781-786
65. Rouleau JL, Packer M, Moye L, Champalain J, Bichet D, Klein M et al.Prognostic value of neurohumoral activation in patients with an acute
myocardial infarction: effect of captopril. J Am Coll Cardiol 1994; 24:583-91.
66. .Goldberg A, Hammerman H, Petcherski S. Zdorovyak A, Yalonetsky
S.Kapeliovich M. Prognostic importance of hyponatremia in acute ST-elevation myocardial infarction. Am J Med. 2004; 117:242-248.
67. In Hospital Outcome of Acute ST Elevation Myocardial Infarction with Hyponatraemia -M Aziz, M Ullah, MG Azam, M Hossain Cardiovasc. j. 2009; 2(1) : 37-42
68. Diabetes and cardiovascular risk factors: the Framingham study.Kannel WB, McGee DL Circulation. 1979;59(1):8-13
69. Fresco C, Avanzini F, Bosi S, Franzosi MG, Maggioni AP, Santoro L, Bellanti G, on behalf of GISSI-2 Investigators Prognostic value of a history of hypertension in 11483 patients with acute myocardial infarction treated with thrombolysis J Hypertension 1996. 14 : 743 - 75
71. Hillis LD, Forman S, Braunwald E. Risk stratification before thrombolytic therapy in patients with acute myocardial infarction. The Thrombolysis in Myocardial Infarction (TIMI) Phase II.Co-Investigators. J Am Coll Cardiol. 1990;16:313–315.
72. Krumholz HM, Chen J, Wang Y, et al. Comparing AMI mortality among hospitals in patients 65 years of age and older: evaluating methods of risk adjustment. Circulation. 1999;99:2986–2992.
73. Rahman, F.A.K.M., Uddin,M.J., Haque,
HYPONATREMIA - A PREDICTOR OF SHORT TERM
MORTALITY IN ACUTE ST- ELEVATION MYOCARDIAL
INFARCTION
PROFORMA
NAME: AGE: IP NO: DOA DOD ADDRESS:
PRESENTING COMPLAINTS: A. CHEST PAIN:
B. BREATHLESSNESS: C. COUGH
D. PALPATION E. SYNCOPE
F. SWELLING OF LEGS/ FACE G. NAUSEA /VOMITING
RISK FACTORS-DIABETES /HYPERTENSION / SMOKER GENERAL PHYSICAL EXAMINATION
VITAL SIGNS Pulse Blood pressure SYSTEMIC EXAMINATION
CLASS-INVESTIGATIONS
1) TROPONIN T. 2)BIOCHEMISTRY
RBS mg/dl BLOOD UREA mg/dl S.CREATININE mg/dl SERUM SODIUM LEVELS
ADMISSION 24HRS 48 HRS 72HRS
TOTAL CHOLESTEROL mg/dl HDL CHOLESTEROL mg/dl LDL CHOLESTEROL mg/dl VLDL CHOLESTEROL mg/dl TRIGLYCERIDE mg/dl IV.ELECTROCARDIOGRAPHY
V.ECHOCARDIOGRAPHY- EJECTION FRACTION DIAGNOSIS
IN HOSPITAL COMPLICATIONS
DISCHARGE STATUS
ABBREVIATIONS
LIST OF ABBREVIATIONS AMI : Acute myocardial infarction
AVP : Arginine Vasopressin CAD :Coronary Artery Disease CCF : Congestive Cardiac Failure CK-MB : Creatinine Kinase-MB CVD :Cardiovascular diseases ECG : Electrocardiogram IHD :Ischemic Heart Disease LVF : Left ventricular Failure MR :Mitral Regurgitation TR :Tricuspid Regurgitation DM :Diabetes mellitus
S.NO NAME AGE SEX IP NO DM HT SM O K IN G P R IO R D IU R E T IC T H E R A P Y P R IO R CA D
EF SO
D IU M O N A D M IS S IO N S O D IU M A T 2 4 H R S S O D IU M A T 4 8 H R S S O D IU M A T 7 2 H R S S B P D B P R B S B L O O D U R E A S .CR E A T IN IN E S .CH O L E S T R O L L D L K IL L IP CL A S S D IA G N O S IS IN H O S P IT A L CO M P L ICA T IO N S O U T CO M E F O L L O W U P P E R IO D
1 RAMAN 46 M 1106537 N N N N N 56 141 141 140 141 150 90 96 24 0.9 178 95 2 AWMI 2*HB A
2 RAVI 43 M 1106476 N N N N N 61 140 140 139 139 136 72 102 28 0.8 190 102 1 IPWMI A
3 JAYAKUMAR 53 M 1101866 Y Y N N N 66 139 137 137 138 150 100 118 30 1 224 121 1 IWMI A 4 PETCHIUTHU 60 M 1101698 N Y N N N 46 138 138 137 139 140 90 137 29 0.9 267 120 2 AWMI A 5 MUTHUKANAN 50 M 1102302 N N N N N 58 139 138 140 139 100 72 166 28 0.8 186 80 1 AWMI A 6 ELANGOVAN 60 M 1061420 N Y N N N 42 137 136 137 138 160 100 87 24 0.7 210 100 1 AWMI A 7 SENTHILKUMAR 36 M 1047146 Y N Y N N 67 137 138 138 137 136 80 189 34 1.2 225 134 2 AWMI A 8 RAMADAS 68 M 1078786 N N N N N 56 133 134 134 134 100 70 112 31 1 188 108 3 AWMI CCF A 9 PANJACHARAM 64 M 1077103 N Y N N N 47 137 134 134 132 180 110 121 24 1 256 178 1 IWMI A
10 SHANKAR 40 M 1077000 N N N N N 67 138 135 137 138 124 70 109 37 1.4 192 98 1 ASMI A
11 NALLAIYAN 62 M 1076625 Y Y N N N 39 137 133 133 133 160 100 204 28 0.8 250 144 1 IWMI A 12 JEEVANANDAM 58 M 1077934 N N N N N 55 137 138 138 137 130 80 78 38 1.6 214 120 1 IPWMI A 13 DHANAPAL 49 M 1078088 Y N Y N N 41 128 129 130 129 126 72 156 34 1.2 184 92 2 AWMI ACUTE MRD 14 KALIYAPERUMAL 50 M 1078984 Y Y Y N N 36 129 130 130 129 170 110 216 21 0.9 255 164 1 IPWMI D 15 GUNASEELAN 58 M 1079500 Y N Y N N 69 136 137 141 139 112 80 125 29 0.9 178 95 1 AWMI A 16 RAJKANA 32 M 1109871 N N N N N 72 138 138 137 138 130 80 136 28 0.8 232 126 1 ALMI A 17 JAYSHANKAR 32 M 1080069 N N N N N 51 137 141 138 137 110 80 108 24 0.7 174 96 1 AWMI A 18 DEVAN DOSE 39 M 1080653 N N N N N 39 140 137 137 138 130 90 128 34 1.2 166 86 2 IWMI A 19 BOOMINATHAN 47 M 1080575 Y Y Y N N 43 128 130 129 128 150 90 178 22 0.6 189 91 1 IWMI D 20 MATHIMALAR 32 F 1081069 N N N N N 62 138 135 135 136 120 70 118 27 1 256 142 1 AWMI A
21 JOHN 50 M 1081601 N Y N N N 31 136 137 141 139 140 90 156 31 1 210 126 2 AWMI PE A
22 KAMU 67 F 1081833 Y Y N N N 49 137 135 136 137 90 60 312 24 1 194 102 1 AWMI A
23 VARADARAJAN 52 M 1082084 Y Y Y N N 57 139 138 138 137 200 110 279 32 1.1 203 112 1 AWMI A 24 NAMACHIVAYAM52 M 1082123 N N N N N 68 136 134 133 134 112 76 90 30 1 145 89 1 IWMI VT A pif 25 AMMAPONNU 63 F 1081168 N N N N N 61 136 137 141 139 110 80 87 29 0.9 253 146 1 ALMI 2*HB A 26 GOVINDARAMAN68 M 1083137 N Y Y N N 56 137 138 138 137 160 100 114 28 0.8 224 114 2 IWMI PE D 27 SUNDARAMBAL 65 F 1083386 Y N N N N 48 141 142 141 141 110 80 224 24 0.7 151 94 2 AWMI D PIF
28 SEKAR 30 M 1083397 N N N N N 47 136 132 133 133 110 80 107 38 1.6 225 140 1 AWMI A
29 NAGENDRAN 41 M 1041359 N Y Y N N 68 139 139 137 138 160 100 120 34 1.2 192 112 1 IRWMI A 30 THENNAMBAL 60 F 1041489 N N N N N 37 140 140 139 139 120 70 106 35 0.9 198 110 1 AWMI A 31 NILSON RAJA 45 M 1041870 Y N Y N N 46 136 134 133 134 120 70 267 29 0.9 224 112 1 AWMI A 32 BALA SARASWATHY34 F 1041954 N N N N N 59 137 133 131 133 110 80 77 28 0.8 215 107 1 AWMI A
33 AMUDHA 45 F 1042057 N N N N N 61 136 133 133 134 110 80 99 24 0.7 182 88 1 ASMI A
34 VELUSAMY 80 M 1043460 N N Y N N 55 139 141 142 143 120 70 113 34 1.2 227 128 2 AWMI D 35 SENTHILKUMAR 29 M 1043529 N N Y N N 35 137 141 138 137 112 76 86 38 1.6 236 138 1 AWMI A
36 GEETHA 60 F 1043828 N N N N N 52 137 138 138 137 112 76 90 34 1.2 171 95 1 IWMI A
37 ILAMPARUTHI 39 M 1044596 N N Y N N 59 140 140 139 139 112 76 109 35 0.9 210 114 1 IPWMI A 38 STEPHEN RAJ 47 M 1044607 N Y Y N N 71 138 138 137 138 160 100 256 34 1.2 195 98 1 AWMI A
39 KANNAN 37 M 1045032 N N Y N N 63 137 141 138 137 130 80 127 31 1 176 102 1 AWMI A
40 KANNAIYAN 40 M 1043238 Y Y N N N 42 140 137 137 138 130 80 142 24 1 242 138 1 ASMI A 41 ANBALAGAN 68 M 1045422 N Y Y N N 48 138 141 140 141 170 110 116 37 1.4 244 141 1 AWMI D 42 RAVI CHANDRAN 45 M 1046425 N Y Y N N 50 137 141 138 137 130 80 105 28 0.8 205 102 1 AWMI A 43 EMMARASAN 70 M 1046540 Y Y Y N N 30 137 134 132 132 80 60 112 34 1.2 190 105 3 AWMI CCF D 44 MARUTHAIYAN 76 M 1047055 Y N Y N N 29 137 133 131 131 110 80 117 38 1.6 250 144 1 ASMI D PIF 45 KARRUPUSAMY 58 M 1047154 N N Y N N 43 140 140 139 139 130 80 98 34 1.2 192 98 1 AWMI A 46 ANNAMALAI 56 M 1096709 Y Y N N N 57 136 137 141 139 130 80 218 35 0.9 228 136 1 IPRVMI A
47 SUMATHI 38 F 1095661 N Y N N N 36 133 132 132 134 130 80 131 31 1 214 120 1 AWMI D
48 MURUGAIYAN 62 M 1096328 Y N N N N 67 137 141 138 137 170 110 189 24 1 180 98 1 IPWMI A 49 NAGAMMAL 55 F 1096497 Y Y N N N 48 127 129 129 130 170 110 146 34 1.2 243 154 1 AWMI D PIF
KEY TO MASTER CHART
DM :Diabetes mellitus HT : Hypertension
CAD : Coronary artery disease EF : Ejection fraction
SBP : Systolic blood pressure DBP : Diastolic blood pressure RBS : Random blood sugar 2*HB : Second degree heart block CCF :Congestive cardiac failure PE :Pulmonary edema
VT : Ventricular tachycardia PIF :Post infarction Angina A :Alive
D : Death