AND APPLIED STUDIES ON THE EFFECT OF ANODE COMPOSITION
ON TEE ANODE-ELECTROLYTE INTERFACIAL CONDITIONS.
by
:,:.!::_OSBORNE. B.Sc. (Hons.), (Tas.)
being a Thesis submitted. in fulfilment of the require
ments
forthe Degree
ofMaster of Science
UNIVERSITY OF TASMANIA
HOBART'.
All of the experimental w0rk in this thesis, except
where directly ascribed to others, has been performed
solely by the auth0r. No part
0fthe text bas
previoµsly been submitted f@r any other degree or
diplGma in any University, nor dees it contain, to
the best knowledge of the undersigned,
anymaterial
This thesis deals with a study of the wettability of amorphous carbon, of the type empl©yed as anode material in the production of aluminium, by cryolite-based solutions. The wettability of carbon has been improved by the addition of inorganic additives 0f the type used in cryolite electrolytes, such as aluminium oxide, calcium flanride and carbonate, and lithium flunride and carbonate.
Particular improvements in carbon wettability are noted when the system is contained in an atmosphere of carbon dioxide - carbon monoxide, corresponding to practical production conditions.
Furtheremore, when anodes prepared c0ntaining these additives are used in a laboratory aluminium cell, notable reductions in cell voltage are achieved at practical an0de current densities. The improved adhesion of the two phases has also been demonstrated by measurement of the current density and voltage con-ditions required to llinduce anode effects in this cell •.
SUMMARY
INTRODUCTION
PART ]: CONTACT ANGLE STUDIES. (a) General
(b) Experimental
(i) Anode Preparation
(ii) Contact Angle Measurements. (c) Results
(i) Anode Preparation and Properties (ii) Contact Angle Furnace Operation (iii) Observation of Melting Phenomena (iv) Contact Angle Measurements~
(d) Discussion
PART II: LABORATORY REDUCTION CELL STUDIES (a) General
(b) Melt Structure
( c) Experimental
(i) Construction of Cell (ii) Raw materials for Cell (iii) Cell 0-peration
(d) Results
(d) Results cont.
(iii) Critical Current Density Measurements (iv) Current Efficiency and Carbon
Consumption. (e) Discussion
PART III: CONCLUSION
(a) Preliminary Plant Measurements (b) Industrial Implementation
ACKNOWLEDGEMENTS
REFERENCES'
APPENDIX A: ANALYTICAL PROCEDURES
INTRODUCTION~
The work described herein was under.taken primariJLy as an applied industrial study at the Comalco Aluminium (Bell Bay) Limited aluminium smelter. The overall
object was the lowering of the individual reduction cell voltage as a means of improving the energy effic-iency of the Hall-Heroult electrolytic process for the manufacture of aluminium and its alloys.
It is well known in the aluminium industry that the electrolysis voltage required to deposit aluminium from a cryolite-based electrolyte is in practice of the order of 4 to
5
volts. This compares with theoretical values of between 1.01v and 2.22V (1) depending on the type of electrodes and overall reactions that are assumed.The following theoretical reversible decomposition potentials at 1000°c with the reactants in their stan-dard states have been found;
1.01V for the reaction
A~203
'*
3C=
2Al + 3CO (Ref. 1 ) 'and 1.16v for the reaction
Al20i3 +
~c
-
=
2Al +~co
;t. (Ref.1);-from thermodynamic data, we have 2.22V for the reaction Al2
03 (s)
=
2Al(l) + ~Ol2(g) (Ref. 1 ). In practice the decomposition voltage lies betweenWhile a certain amount of the excess energy, at the high currents used industrially, is necessary to maintain the electrolyte in a molten condition at its operating temperature (of the order of
980°c),
it can be seen, as various workers(3,4,5)
have shown, that a significant factor in the energy requirements is the anode overvoltage. Alth0ugh conflicting explanations exist as to the mechanism of this overvoltage, typical figures at practical curnnt densities, alumina concen-trations, and cell temperatures are of the order ofe.4 -
o.7v.
In an aluminium reduction cell the operating pro-cess normally consists of the continuous downward
feeding of a carbonaceous anode, comprising a petroleum/ coke/pitch mixture, into a molten bath of a mixture of cryolite, aluminium oxide, and calcium fluoride.
This molten electrolyte is contained-in a carbon-lined stee~ shell, which acts as the cathode.
At the anode, the tw~ surfaces directly in contact with each other are the carbon electrode and the
atmospheric environments (6), which manifests itself in an imperfect electrical contact. This contributes to a higher voltage than is desirable under plant
operating conditions.
In addition to the 0verv0ltage pr0duced in an operating cell, the slow release of the primary anode product,
co
2 , allows the formation of significant am0unts of carbon monoxide, resulting in a carbon usage ofapproximately
0.5
lb. for every one pound of aluminium ,produced, c0mpared with a theoretical usage of0.33
lb.of carbon fer the
reaction:-2Al203 + 3C = 4A]_ + 3co2
Therefore if impr0ved physical and electrical contact can be established between the two interfacial surfaces, a lower total voltage drop per cell can be expected. Also, if a m0re rapid release of anode gases can be realised, a reduction in carbon consumption can be expected.
compounds include aluminium oxide, calcium fluoride, calcium carbonate, aluminium fluoride, and certain lithium compounds.
The study of the use of these compounds is described in the subsequent two maj0r
sections:-(!) Contact Angle Studies
(a) General:
When a drop of liquid rests under equilibrium on a horizontal solid surface, a configuration of the following type is
adopted:-Vapour
Liquid
In such a system, the interfacial surface tensions are related by the following
expression:-"5SV
¥SL.
=¥LV
cos Qwhere
YSV'
YSL ,
andYtv
refer to the solid-vapour, solid-liquid, and liquid-vapour surface tensions res-pectively, and Q is the contact angle formed by the liquid drop on the surface in a given atmosphere. This angle may be measured geometrically.Although experimental difficulties exist for the measurement of the various surface tensions, and stresses on the solid surface would confer non-equilibrium pro-perties on the system, the measurement of Q is able to provide valuable information as to the relationships and affinities between the three phases.
hence the value of the contact angle, enables one to make an assessment of the "wettability" of the solid by the liquid. All solids are wet by all liquids to
• ' 0
some extent, i.e.,
Q-<
180; the greater the tendency of the liquid to spread on the solid, the smaller will Q become. When the liquid spreads completely over the solid, then Q equals zero.In the present study, attentionlas been directed to the wettability of baked amorphous carbon surfaces by liquid cryolite and its various alumina-containing solutions. It has been the intention to measure the extent of wettability as a function of carbon composi-tion, particularly as affected by the addition 0f the inorganic additives related to the alumina reduction process.
The work of Vajna (6) bas been followed up and used as a basis for further study, as described in
(b) Experimental:
(i) Anode Preparatisn
~Greenn or unbaked anodes were
--
'
'
prepared on a laborat0ry scale by a method analagous to plant operati0n. Initially, this consisted of preparing a quantity Gf dry petroleum coke of the f0ll0wing particle size
analysis:-t
-1+4
mesh 17%- ),)
-
4
+ 20 mesh33%
)-
20-+48
mesh 7"$) )
) Tyler Sieves
-
48 + 100--' mesh8%
).)
1 00 -t:- 200: mesh
13%
)l
200 mesh 22% ).These percentages were selected from plant rec©rds over a twelve month period, and thus constituted a particle size distribution which had proved. satis-factory in reducti0n furnace operation.
A pre-determined quantity of the ab0ve coke mixture was heated t~ approximately 100°6 in a two-gallon
double sig11a-bladed Baker-Perkins mixer, and
20%
of its weight of coal-tar pitch, ©f softening point105 - 110°c,
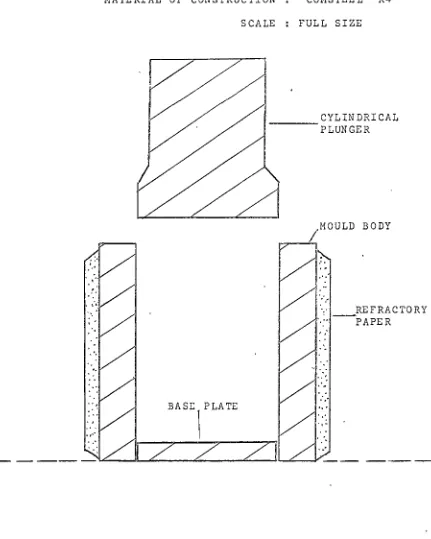
added.with refractory paper, maintained at the same temperature.
By means of a suitable plunger (See Fig.1), the hot mixture was compressed to a total pressure of 17,500
-18,000 lb, or 5,570 - 5,730 lb per square inch, using
a Mohr and Federhaff Universal Testing Machine. The
pressed block was then extruded from the mould for
further study.
When inorganic additives were incorporated into
the anode mixture, they were added in the form of a
fine powder, the content being based on the weight of
petroleum coke in the carbonaceous mixture.
Modifications to the petroleum coke size
distri-bution were made when small surface irregularities were
obtained in the anodes, caused by the
-t
+4
meshsolids fraction. By screening out this fraction from
all but the earliest trial anodes, a coke particle
size distribution was obtained as
follows:-- 4 + 20 mesh approx. 40% )
- 20 + 48 mesh apprax.
8% )
)- 48 of+ 100 mesh
) Tyler
approx.
t0%')
sieves}
- 100 of+ 200 mesh approx.
15%-)
}- 200 mesh approx. 27% )
With this coke mixture and 2CJ'; of its weight 0f
pitch, the following additives were incorporated inte
material:-SCALE FULL SIZE
CYLINDRICAL
- - - -
PLUNGERBODY
·.·
· -
REFRACTORYPAPER
[image:14.572.83.514.84.623.2]BASE\ PLATE
1%;
2% and5%
Al2013
1% and 2% CaF2
2% each of LiF, AlF
3, Na3A:1F6 , L12
co
3, Na2co)
3and
Caco3,
resulting in twelve separate ty~esof anode (including a blank)'.
The percentages are expressed on the basis of the amount of petroleum coke in any given anode mixture. Details of the additives used are as
follows:-Ar2
o
3 - Normal production material, sieirecd to -100 mesh
B.s.s.,
digested with 1:1 HCl at the boilingpoint, washed, dried.
Fe2
o
3
=
O.005%,
Si02 :=
O. 014%~ Na2
o
=
O.015%
CaF2 - Industrial grade: CaF2
=
97.661,
8102=
o.64%
Fe2
o
3
=-
o.
06%'LiF
-
Reagent grade.AlF
3
-
Prepared. from super-purity aluminium anci50%
analytical grade
HF.
Al a; 34.
5%, ·
Fe2
oi
3=
0.11%Na
3A1F6 Synthetic cryolite, selected materials.
Na
=
32.2%, Fe2o·
3=·
0.015%, SiOl2 = 0.012%,NaF/AlF
3
ratio :1.48
(neutrality=
1.50}
(See Appendix A, (vii), f0r explanatory note)
Li2
co
3
-
Prepared fr©m reagent grade lithium chloride and ammonium carbonate by precipitation.In addition to the above anode types, a further range of anodes was prepared in which the amount of additive ranged from 1~0$ to approximately 50% of the coke plus additive portion of the total mixture, as sbGwn in the following table. The additive ~~·the:s.e
cases consisted of partially-hydrated alumina (ignition loss about 10%) obtained as a by-product of the alumina kiln electrostatic precipitators.
Mixture Mixture: Mixture
L.1
L.2L.3
-=e: "tl -4 -f!-"20'#
541@
5?+©l-CD (I)'
II.> ... c-t
l:3 (Jq l'i -20: +
48 # 112 112: 280
0 !:S' 0
O.c+ I-'
a> tD
-48 + 100 #
134
134 1'1i2'd s::.:
(') t1 9 0 0
-1
ocr'
+ 200#
124E3 'd 0 208 2©8
'd 0 0
0 "i !JI;"
:::s c+ Cl)
-20ff # 230) 100:
<D ...,.
-l:3 (1)
c+ l:3
.;
Cl) Cl.II
136
5511 ..• Al20J 272'.
0
H,i
:Pitch
276
276
3(1101%-Pitch 16.9 22.9 21.9
'/; A1 2
03
in 10e0 19.9 51.8C0ke + Additive
f'
-In the above cases, experience showed the need for increased percentages of pitch binder to maintain a coherent block after pressing. Also, the amount of -100 mesh coke was progressively reduced so as to
maintain a reasonably similar particle size distribution between the three batches, especially in view of the fine nature of the additive (approx.
80
to90%
-325 I/Tyler)~
The unbaked anodes, both plain and modified, were baked to remove vola.tile hydrocarbons. The method involved packing a number of the anodes into large
refractory crucibles, covering with a coke-type packing material, and baking in an industrial baking furnace.
The conditions consisted of increasing the sample temperature from ambient to 1000°c over a period of 10-12 days in a pre-heating stage, raising from 1000 to 1175°c in 48 hours, and finally cooling to ambient
temperature over a further 14 day,·period.
The samp~es used in the whole of this work were
baked in the above manner under typical plant conditions. (ii) Contact Angle Measurements
phot0-'
graphing the flux-carbon interface whilst the sample
is contained in a horizontal tube furnace at about
1,
ooo
0c.
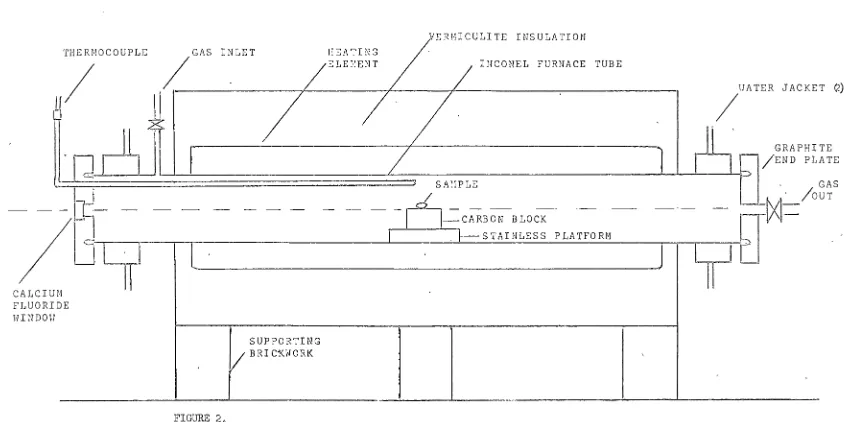
In this work, the equipment consisted of that
shown in Figures 2 and
3.
The furnace comprised a3-5/8in inside diameter tube fabricated from inconel
sheet, heated over a length ef 26in by a concentric heavy-gauge nichr0me element operating on, .a:{maxlilmum of
39V.
The tube was fitted with cooling jackets neareach end, and provision was made for a range of gaseous
atmospheres to be used in the interi0r.
The ends of the furnace tube were fitted with
circular graphite plates 6in diameter and 1in thick,
one of which was fitted with a simple metal stopcock
as a gas outlet. The viewing end-plate contained a
centrally-located calcium fluoride window 25mm in
diameter through which the melting and contact phen0mena
could be observed.
The anode sample under study was machined into a
cylinder 2in diameter and 1in high and placed on a
stainless steel platform in the centre of the furnace
tube, so that the upper surface 0f the anode, on which
a small fused bead of flux rested, was co-linear with
the horizontal diameter of the furnace.
its insulating body and mounted on supporting
brick-work, had an overall length of 37in, and a height of
18in.
Anode samples investigated were selected from those
listed in the previous section, along with graphite;
flux materials comprised pure cryolite, cryolite with
5% by weight of alumina, and a material composed of 85%
(by weight) of cryolite,
7%
calcium fluoride, 5% aluminaand 3% aluminium fluoride. This latter sample was
prepared to give a flux approximately in comp©sition to
that encountered in a Hall reduction furnace. All
flux samples were prepared by fusing suitable amounts
of the components in a small covered graphite crucible
at 1050°c, stirring with a graphite rod to mix, and
allowing to cool to room temperature. The resulting
solid was then broken into "chips" of a suitable size
for use in contact angle work.
Because of the dependence of interf acial contact
on the surrounding atmosphere (6), the following gases
were variously used in this phase of
work:-Dry argon
Dry carbon dioxide
Dry carbon dioxide
70%.
v/v - carbonmonoxide 30% v/v
~
/lOC 0 UPLE 11 / , __ G __ A_S_I _N_L_E_T _ _ _ _,,_ _ _~-~-~-~-l~-~-J ~---,/---,Z---I-H_C_O_N_E_L_F_U_R_N_A_C_E_T_U_B_E
_ _ _ _ , ;"ATERIf
l
JACKET C'.)
fJ
~I
L _J__J__ _ _ _ _ _ _ _ _ _ _ L.__ _ _ _ _ _ _ _ _ _ _ _ _ _ _,___,,__.:._----"-bl
/~~~
p~~r~E
S A'.'IPLE · GAS
I '
/
·
/ouT- -
Cl~I
- -
- - - -
-11-=cARBo;-·B1ocr- - - -l~~~I=
I 1--~ S TA I NL E S S P LA TFO RM
I
1L
LJLl
T
IJ
' I .
·1 CALCIUt FLUORID
HI~IDOH
11
E
SUPPORTING
I/
BRIC1<WORK
-FIGURE 2o
HORIZONTAL TUBE FURNACE FOR CONTACT ANGLE MEASUREMENTS - SIDE ELEVATION
I.
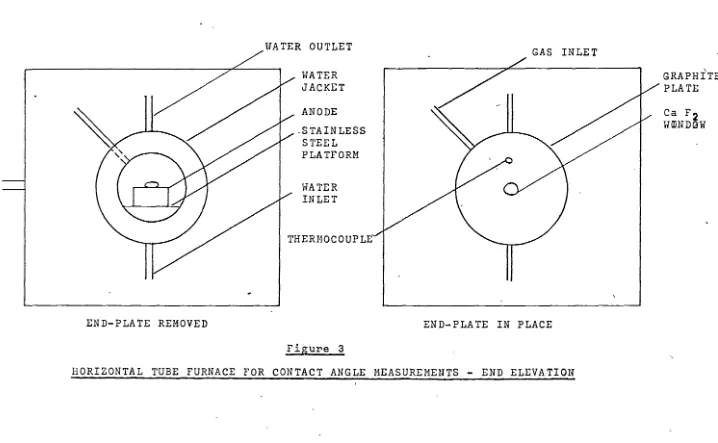
[image:20.946.85.929.97.519.2]END-PLATE REMOVED
WATER JACKET ANODE .STAINLESS
STEEL PLATFORM
WATER INLET
THERMOCOUPLE
Figure 3
END-PLATE IN PLACE
HORIZONTAL TUBE FURNACE FOR CONTACT ANGLE MEASUREMENTS - END ELEVATION
[image:21.857.113.831.111.554.2]ratio of 0xides Gf carbon as occurs in the anode
environment of an industrial reduction furnace.
All gases were delivered to the apparatus from
cylinders, after drying in a train of towers
contain-ing concentrated sulphuric acid, and lump calcium chloride,
at approximately 250 ml/min.
When the anode and flux samples had been placed
in the furnace, cold tap-water was cmrcµlated through
the cooling jackets at approximately 1.0 l/min, and the centre of the furnace heated by means of the nichrome
element provided. Temperature indication and control
was provided by a ncambridge" indicator/controller,
operating through a 11Pyrotenax11 chromel-alumel
thermocouple.
The phenomena of melting, contact angle and adhesion,
were recorded photographically. A tripod-mounted
35
mmcamera, fitted with extension bellows and a 135 mm focal length lens was used, employing black-and-white
pan-chromatic film. Exposures of fs at an f /8 aperture
with a film of 125 A.S.A. speed rating gave the most satisfactory results at sample temperatures of
975 -
1000°c. No extra illumination other than thatprovided by the sample was needed.
The photographic records were made from the time
obtained on the carbon surface. The number and type of photographs depended on the nature of the individual samples as melting progressed.
(c) Results:
(i) Anode Preparation and Properties.
Using the method outlined, no major problems were encountered in the pressing and baking of the anode
samples. Typical specimens are shown in Figure
4,
both in the baked condition and prepared for contact angle measurements. The unbaked blocks showed no indication of the presence of any additive materials. The pressing conditions are represented by the following averagefigures for five separate
mixtures:-Mix No.
1 2 3
4
5
Average Pressure. (lb/sq in)5671 5650 5591! 5633 5592 Additive Nil 1%Al2
o:
3
5$.A.1203
1%CaF2 22%Al2
o
3
No. of blocks in mix.
14
26
27
27
26
The high proportion of alumina in Mix No.
5
resulted from the replacement of half of the 200 mesh fraction of petroleum coke with alumina. The proportion of pitch was unchanged. However, the condition of these blocks after baking was generally unsatisfactory, being of a crumbly texture.high levels, e.g.,
50%)
could only be achieved using higher amounts of pitch binder, as referred to in a previous section, if a satisfactory baked block was to be obtained.In the instances where the additive material con-sisted of a compound with a tendency to decompose or partly volatilise at the baking conditions,
n0
evidence was obtained of surface irregularities or internalstresses in the baked anodes. This applied to those anodes containing cryolite, aluminium fluoride, lithium fluoride, ealcium, lithium, and sodium carbonates, and partially-hydrated alumina, all additives with a ten-dency to alter in form at the temperatures used in baking.
The stability of this type of block is further in evidence by the results of ash determmnations on samples of the baked anodes, as shown below. The samples were ashed to constant weight at
700°c
in an electric muffle furnace allowing a free access of air to the material.Additive
%
Ash(weight
%>:
( 7oo9c,
constant weight)None 1. 2
None 1.3
2% Al2
a.
3 2.15%
Al 2012% LiF 2.9
2% Li
2
co
3
2.62% CaF
2
3.6
2%
Caco
3
3.4
2% AlF
3 2.3
In the case of anodes containing additives which
would melt at the baking temperatures, one would expect
a considerable loss of material during baking, due to
either seepage or volatilization, with a
correspond-ingly lower ash content. An explanation which is put
forward is that with a low percentage of additive
evenly dispersed throughout the samples, the surf
ace-active amorphous carbon particles have retained the
molten salt, probably by adsorption onto solid anode
material.
Baking conditions representative of those used
in the preparation of these anodes are shown in the
following
table:-Time (h) Temperature
c
0cy
0
97'5
4 990
8 1 OOO',
12 101
'5
16 1 o401
20 1055
28 11 Off·
32
1120:36 1150'
40
117044
117548
118'552 1190
A 14-day pre-heating period and a similar cooling time
were associated with the above baking cycle.
The overall condition of the baked blocks was
that of a semi-porous sample, which could be machined
and drilled without physical deterioration for the
required purposes (See Fig.
4).
(ii) Contact Angle Furnace Operation
The furnace used for contact angle studies
was operated from a low-voltage
(39V
max.),5
KVAtransformer, and the times taken to reach 1000°c from
ambient temperature under several conditions were as
shown:-Input Watts Time to
voltage 1 OO©OC
33
2750 200 min36
3275
140 minThe times taken to reach 1000°c in the centre of the furnace were obtained with argon flow-rate of 200 ml/min and a water flow-rate of 1 l/mim.
A certain amount of power was lost from the system in the water-cooled end-jackets. The following table lists the details of water flow and temperatures, and corresponding loss of power in this way. Losses due to radiation from the furnace end plates and gas stream were not determined; the temperature of the outer
surface of these plates was of the order of
25ooc
when the furnace interior was at 1000°c.Centre of Water Water temperature Power loss
furnaae,5,~0c
)'
flow-rate In 0ut
545.
800 850
1 •.
03 l/min1 o. 20c
1.05 l/min 10.8°c 1.03 l/min 10.8°c
1
5.
ooc
31+6w19.
0°c
6oow
20.9°c 720W
To determine the temperature distribution within the heated zone of the furnace at normal operating temp-eratures a traverse was performed along the entire heated length. For this purpose, the apparatus was operated at a controlled temperature of 1,000°c, with no sample, but normal argon and water flows.
temperature gradient. At each point the on-off cycle was measured potentiometrically several times, and compared with a similar measurement on the con-trolling thermocouple. The results are shown in the following table and graph.
Distance along Temperature (°C )' heated length. during on-off cycle.
(inches) Maximum Minimum
0
759
753
1
822
813
2
873
862
3
910
897
4
940
927
5
964
948
6
984
968
7
999
983
8
1011
995
9
·1019
1003
10·
1022
100'7
11
1020
100612
1019
1005
13
1013
1001
14 1005
995'
15
993
980
16
979
966
'
.
\_ ___ ·-·· ~ - ·-··--1
I
Ij
I ..
I.:
~ --.. -"I I I
!
J -r
... 1'i::I i=i I
~
; ' '! H
'
l : -
--~
!··
!
i 0
! 0
...._,
~
·; E-i
~
~-P-.
?!5
,, E-i
, ... - ...
-,.
~~· ... .J
-1 I
. 1,eoo
09QQo __ 0 800 700° 600° 3 I I
I ' ! , ' -. . .., t .~.
1 :
I
I :
' '
I" l .. " • - - , .i .. : ., ,. , •' I
~ I
i '
I L.
. '
, ..
!
I '
-- -! ' I CONTACT ANGLE E'URNACE
I . TEJ'lPERATU:RE TRAVERSE
I I I
. ' I
' I
1-6 9.'' 12 15
l :nrsTANCE-;A1qNG' HEATED LENTGH (INCHES)
·-··- -- 1 ...
---
-
18
938
92519
914
901-20
882
970
21
838
829
22
779:
772
23
712·
7o824
603
601
(iii) Olbservation of Melting Phenomena
Practically all of the experimental runs
in this section of work follo.:wed patterns of a similar
type, but varying in degree. The general pattern
ebserved consisted 0f the sequence:
melting-adhesion-absorption. Each of these stages depended for its
exact behaviour on the nature of the anode and its
additive, the flux composition, and the surrounding
atmosphere in the furnace.
Typical examples of each stage are shown in
Fig.
5 - 7;
these have been selected to illustrate the above mentioned phenomena. Particular featureswhich have been observed tbr0ugh0ut the contact angle
studies
include:-1) Melting 0f fluxes in an atmosphere of argon resulted
in practically n0 adhesion to the carbon sample.
of a range of additives had almost no effect on the extent of adhesion of cryolitic fluxes.
The exceptions have been anodes containing 10-25%-alumina (as kiln dust) in contact with a
These are shown in Figures
8
and9
and can be compared with Figure 10, showing an unmodified anode and a normal fluxsample.
Thus, the technique of Vajna (6) bas been extended to include amorphous carbon samples which have been modified by additives, and als0 varying flux compositions. However, the observation that no type of carbon is wetted by cryolite in an
atmosphere of argon should now be modified to in-clude the behaviour of the anodes ref erred tQ in the previous paragraph.
2)' The use of an atmosphere of carbon dioxide in the apparatus brought about an increased tendency for the beads of molten flux to adhere to the carbon surfaces.
continuously observing and recording the alteration
in interfacial behaviour.
Of the additi¥es tested under carbon dioxide,
the most adhesive beads, as observed from the profile
of the molten sample on the carbon, were obtained
with anode additives of 1©% alumina, 2% lithium
fluoride, 2% lithium carbonate, or 2% cry0lite.
The composition of the flux, within practical limits,
did not significantly affect the overall results.
3) Earlier reference has been made to the use of a
70 yolume percent carbon dioxide - 30 volume percent
carbon monoxide atmosphere in the contact angle
furnace because of its similarity to the ratio of
oxides of carbon found in the anode vicinity in an
industrial furnace. It was not expected that any
appreciable difference would be observed when
com-pared with an all-Co2 atmosphere.
confirmed experimentally.
This was generally
In reviewing the results obtained, it ean be
seen from the attached illustrations (Fig. 11 - 14)
that lithium carbonate, lithium fluoride, calcium
fluoride, and calcium carbonate, all at the
2%
level,were effective in promoting interracial contact under
conditions approaching those fQund in practice,
whereas 2% AlF
Of particular significance is the result ob-tained when an unmodified block was used with a cryolite/5% alumina flux. The illustration
(Fig.16) shows a total lack of contact between the two phases. The cool bead was readily removed,
leaving no trace of the flux adher&ng to the block.
A very similar result was obtained using a flux of normal composition as feund in practice.
4): The admission of air, at the same flew-rate as the
other gases, caused a rapid lowering of the eontact
angle, accompanied by an absorption of the flux into the bipck. This took place within ten to fifteen
minutes. It app~ared to be governed by the air
flow-rate, and the process could be arrested, but
not reversed, by the re-admission of
co
2 to the
exclusion of the air stream.
The only instance where the admission of air
did not cause flux absorption by the carbon
was in
the case of a graphite block. This observation is
in keeping with the non-wetting of graphite by
cryo-lite under all atmospheres (6).
5) One feature of the behaviour of cryolite fluxes under
these conditions does not ap~ear to have been recorded.
it concerns the "physical stability" of the system
as a functi&n of the oxidizing nature of the
When using argon as the furnace gas, the molten beaa of flux remains stable and quiescent on the carbon surface. As mentioned earlier, the chemical inertness and interfacial dissimilarity are doub;-less responsible for this condition.
However, when air is admitted to the furnace, the s~stem loses its stability, and a bubbling action commences within the molten flux. These bubbles grow within the flux, and finally break through the upper surface of the bead, which then collapses to its original configuration. At the same time, absorption of the flux into the carbon continues. This alternating rise-and-fall cycle of the molten
flux continues until the bead is absorbed into the carbon. Alternatively, the phenomenon could be halted by replacing the air stream with a stream of argon.
The cause of this bubbling action illustrated in Figutes 17 and 18 was not determined. The evi-dence suggests that it is caused by the presence of air, and the suggestion is put forward that the
bubbles consist of oxides of carbon which form below the flux and gradually come to the surface.
6) The tendency for cryolite melts to fume strongly is one which introduces experimental difficulties when working with such materials. During the course or
I
Ii
11
this work, the tendency of the flux samples to gen-erate such fumes created problems in photographing some of the runs. The most satisfactory solution
proved to be the application of a gentle suction tQ the outlet end. of the furnace tube at a rate matching
the flow-rate of the incoming atmosphere. The
gases were then led through a water cooled condenser system and vented to outside.
(iv) Contact Angle Measurements
Although contact angle studies at high temperatures is not a new field, the attention which bas been given to the cryolite-carbon s~stems from a
quantitative aspect seems to be limited. Vajna (6)
has made a study of this system, but in the work re-ferred to gives no quantitative measurement of the equilibrium contact angle which may be used as a refer-ence value for the present work. He states that
nwhen the gas ilrs N
2, CO, C012, HF and C~, the drop
does not moisten the carbon and the angle 9 remains obtuse ••••.••• on amorphous carbon •o•••••• for all types of solutions."
Belyaev (6a) quotes a cont~ct angle of 127° for cryolite on carbon at 1005°C, but the data pe presents shows the influence of flux composition 0n contaet angle, and not a variation in carbon composition, S'S
been reported by Matiasovsky et al. (6b).
In the present work, an angle of 180° is defined
as that obtained between solid and liquid phases in
c0ntact when the former is not wetted by the latter.
Conversely, when wetting is complete, the contact angle
~s zero.
The measurement 0f contact angles in this wark
has been made geometrically, using the profile obtained
by photographing the molten drop on the carbon anode.
The factor limiting the accuracy of this method
lies in the drawing of the tangent to the liquid sur-face at its point of contact with the carbon. The
reproducibility of this tangent was determined by
making a series of twenty identical prints of a typical profile. On each of these, a tangent was drawn and
the contact angle measured. By this method, a mean value of 136° was obtained for the sample chosen, and a standard deviation
or
±
2° ealculated.In all results tabulated below, the contact angle
is the mean of the two angles on either side of the
profile of the molten flux sample.
Illustrations representative of a number of contact
profiles are shown, along with examples of van~ing
Table 1: Contact Angles in Argon Atmosphere.
Additive Flux Contact Tem). Fig.
in Anode Composition Angle Q
c
0c
No.Nil Cryolite 148° 1, 000'
Nil Cryolite
- 5%
Al 2o
3 137° 996 19
Nil 85-7-5-3
t
124° 1, 003 101% Al2013 Cryolite 131° 1,012
It n 137° 1, 020
II Cryolite
-
5%·
Al20l3 135° 1, 0025%-Al203 Cryolite 137° 98~
H Cryolite
- 5%
Al2
o
3 133°999
20tl 85-7-5-3
.;.
132° 1,0021%.
CaF2 Itf:
133° 1, 001tli Cryolite 137° 1,022
lt Cryolite - 5% A\12013 128° 1,000
21&°Li2C0
3
85-7-5-3.;.
136° 1, 027 21II Cryolite -
5%
A!l2013 133° 1,0362% Cryolite
..
II 118° 1, 030)2'f, LiF Cryolite 118° 1,019
All Graphiite
"'
129° 1,000II n
85-7-5-3
t
136° 1, OOO'1 fJ%, Al2
03
-I!- Cryolite - 5% Al20·3 Acute 1,000 825% Al2@
3 +
II
..
..
9809
[image:38.571.107.518.77.650.2]Table 2: Contact Angles in Co 2 Atmosphere.
Additive- Flux Contact T~m). Fig.,
in Anode Comp-osi tion Angle Q
( c '
No.All Graphite Cryolite 125° 1,d+o
Nil n 115° 1, 039
1% Al20l3 n 79° 1,o48
(Q
=
121° in argon before admission ofca
2.) 1% Al Ol ' 2 3 Cryolite- 5%
A\1203 88° Notnot ad
5%'
Al2o
3 85-7-5-3 f 93° 1, 01321t LiF Cryolite 102° 11
, 026
2% Cryolite Cryolite - 5% Al2
03
80° 1,050(9 decreases rapidly with time.)
10% Al 2
o
3 + Cryolite- 5%
Al20l376°
1,00019r
CaF2 85-7-5-3 f 94° 1'1, oo4f The figures 85-7-5-3 refer to a flux containing
85%
cryolite,7%
calcium fluoride,5%
alumina, and3% aluminium fluoride, Rre-melted prior to use.
+. Alumina present in amounts over 5% has been added as recovered calciner kiln dust.
23
22
[image:39.574.106.520.56.426.2]Table
3:
Contact Angles in 70% Co 2 -30%
CO Atmosphere.Additive Flux Contact Tem).
in Anode Composition Angle 9 (OC,
Ni I Cryolite - 5% Al 2
o
3 125° 1, 0292% CaF2 II tt Very 1, 036
acute
11 Normal Flux
t
1 OOo 9902% CaC0'3 ft n f
77°
990ll Cryolite - 5% Al
2
o
3 99° 1,0282% Na2coi
3
11 n 92° 1, 016
2% AlF
3
II II 118° 1,020
2% LiF II ll 111° 1,024
~% Li2
co
3
ll fl Acute 1,024
Table
4:
Extent of Physical Adhesion of Flux to Anode Samples.Atmosphere Additive Flux Extent of in Anode C'omposition Adhesion
Argon Nil No apparent
1% Al2
o
3 evidence of adhesion of 5% Al203 Cryolite flux to anode.1% CaF2 only
2% LiF
2% Cryolite
Argon Nil
1% Al2
o
3No apparent evidence of
5$
Al2o
3 Cryolite adhesion. 1% CaF2 - 5% Al2
o
32% Cryolite
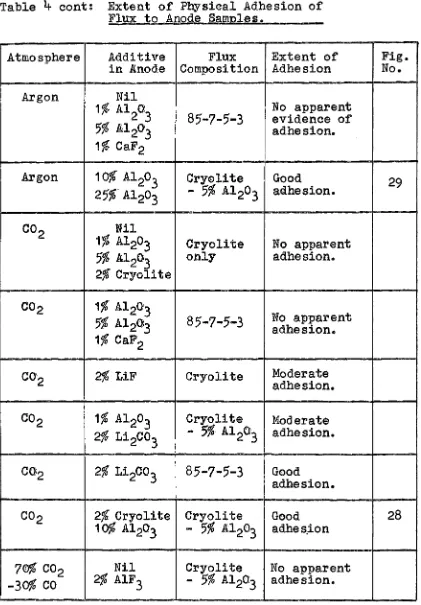
[image:40.574.100.524.45.673.2]Table
4
cont: Extent of Physical Adhesion of Flux to Anode Samples.Atmosphere Additive Flux Extent of
in .Anode Composition Adhesion
Argon Nil
1%
Al2
o:
3 85-7-5-3 No apparent evidence of5% Al2
a
13 adhesion.
1%
CaF2Argon 10% Al2
o
3 Cry0lite Good
25%-Al203 - 5% A1 203 adhesion.
Co
2 Nil1$ Al203 Cryolite No apparent
5% A1203 only adhesion.
2% Cryolite
co-
2 1% Al203No apparent
5$
Al20J3 85-7-5-3 adhesion.1%
CaF2C0'2 2% LiF Cryolite Moderate
adhesion.
co 2
1% Al2o
3 Cryolite Moderate2% Li 2
co
3- 5%·
Al 2o
3 adhesion.C02 2% Li2
co
3 85-7-5-3 G0odadhesion.
C02 2% Cryolite Cryolite Good
10$ Al2
n
3- 5%
.Al203 adhes.ion7©% C02 Nil Cryolite No apparent
-30%
co
2% AlF3 - 5% Al2a3 adhesion.Fig. No.
29
[image:41.572.107.528.48.653.2]Table 4 Cont •. ; Extent of Physical Adhesion of Flux to Anode Samples.
Atmosphere Additive Flux Extent of in Anode Composition Adhesion
70% CG2 Nil Normal Flux No apparent
-30% co f adhesion.
70% C02 2%· Caco3 Cryolite Low to -30% co 2% Na2co3 - 5% A120'3 moderate
2% Al2o
3
adhesion.70%:
Co2 2% LiFCryolite 2% Li
2co3 Good
-30% CO; - 5% Al 01
adhesion. 2% CaF2 . 2
3
70% Co2 2% CaF2 Normal Flux Good
~3o%
co
2% Caco3
f adhesion.Fig. No.
25
27
26
f/ Normal Flux - a standard cr4olite-based electrolyte, with a NaF/AlF
[image:42.573.107.524.46.381.2]' \
From the above results, it is apparent that when an argon atmosphere is used, the contact angle of the flux bead on the carbon surface is generally of the order of
135°.
Allowing for the accuracy of the geo-metric measurements and the fact that the porous surface cannot be reproduced exactly from one measurement to the next, it is concluded that practical deviations from the cryolite composition do not significantly effect the contact angle between the two phases. The same comment can be made concerning the amount and type of additive incorporated into the carbon.&,In assessing the influence of additives on adhesion and contact angle, a relatively large effect has been sought from a small percentage of additive.
In
parti-cular, a change from an obtuse to an acute angle hasbeen considered strong evidence in this work, of increased interfacial adhesion.
The effect of carbon dioxide atmosphere on contact angle can be measured on a semi-quantitative basis by comparing results from corresponding conditions in Tables 1 and 2.
From the above results, it is apparent that when
an argon atmosphere is used, the contact angle of the
flux bead on the carbon surf ace is generally of the
order of
135°.
Allowing for the accuracy of thegeo-metric measurements and the fact that the porous surface
cannot be reproduced exactly from one measurement to the
next, it is concluded that practical deviations from the
cryolite composition do not significantly effect the
contact angle between the two phases. The same comment
can be made concerning the amount and type of additive
incorporated into the carbon.
6:In assessing the influence of additives on adhesion
and contact angle, a relatively large effect has been
sought from a small percentage of additive. In
parti-cular, a change from an obtuse to an acute angle has
been c0nsidered strong evidence in this work, of increased
interfacial adhesion.
The effect of carbon dioxide atmosphere en contact
angle can be measured on a semi-quantitative basis by
comparing results from corresponding conditions in
Tables 1 and 2.
In addition to the changes in contact angle brought
about by varying the type of anode and surrounding
at-mosphere, the extent of adhesion between the contact
of the flux to the anode surface is pronounced, as observed from the difficulty of their separation when cool, this can be taken as additional evidence of affinity between the surfaces (see Table
4).
If this affinity extends over a large area in an industrial furnace, then considerable improvements in operating conditions can be predicted. If the mutual affinity of the flux and carbon surfaces is sufficient to overcome the tendency for bubbles of anode gases to accumulate under the anode during electrolysis, speedier removal of the main anode product,
co
2, will be expected to result, leading to a saving in carbon consumption.summarizing the data from Tables 1 -
4 ,
above, it is suggested that the most signifieant results occur in atmospheres ofco2,
and mixedco2 - co,
which are the types of gaseous environments encountered in a produc-tion furnace. A marked drop in contact angle and an increase in adhesion occur when a plain anode is re-placed by one which has been modified.In some cases, the extent of wetting is sufficient to render the geometric method unsuitable. In such cases, a visual and qualitative estimation of the effect of the anode additive, in terms of extent of adhesion, had to be made.
practical additives to include in anode blocks would be calcium fluoride, lithium or calcium carbonates, alumina, and lithium fluoride.
Finally, the lack of adhesion of melts in
co
2 atmos-pheres, and the very exdstence of the anode overvoltage, can together be taken as evidence thatco
2, and not ozygen, is ... the anode product at practical current den-sities. This interpretation is contrary to the
suggestion (6) that "it is oxygen which is first released on the carbon of the anode; then we have the oxidation of carbon into CO and
co
211• If oxygen were released
Figure
5:
laboratory reduction cell.
flux to anode containing
10%
Al2o
3,
under argon atmosphere.Figure
9:
Showing adhesion of Cryolite -5%
Al 2o
3
flux to anode containing25%
A12o
3
,
underNote lack of adhesion (cf. Fig.
8
and9)
Figure 11: Showing adhesion of Cryolite -
5%
Al203
flux to anode containing 2% Li 2co
3
,
under [image:50.582.110.519.17.719.2]flux to anode containing 2% LiF, under
co
2 - CO atmosphere.Figure 13: Showing adhesion of Cryolite -
5%
Al2o
3
flux to anode containing
2%
CaF2, under
flux to anode containing 2% caco
3
,
underca2 -
co atmosphere.Figure 15: Showing molten cryolite -
5%
Al2o3
flux on anode containing 2% AIFon plain anode, under
co
2 - CO atmosphere; lack of adhesion is again apparent.within flux bead.
Figure 19: Profile of molten Cryolite -
5%
Al2o3
fluxon plain anode, under argon atmosphere.
on anode containing
5%
Al2o
3 under argon
atmosphere. Contact angle~ 133°.
Figure 21: Profile of normal flux on anode contain~ng
2% L1
[image:55.580.83.514.51.694.2]Figure 23:
co
2 atmosphere. Contact angle:: 80°Profile of Cryolite -
5%
Al2o3
flux on anode containing 1%
Al 2o
3 underco
·
2 [image:56.577.103.521.35.669.2]CaF2 under
co
2 atmosphere. [image:57.579.74.517.21.689.2]·angle = 94 •
3
in C012 - CO atmosphere.
Figure 27: Showing good adhesion and spTeading of
cryolite -
5%
Al 2a3
on anode containing [image:58.577.103.518.54.668.2]Al2
3
ing 2$ cryolite, after fusion in
co
2 - COatmosphere.
Figure 29: Showing good adhesion o~ cryolite -
5$
Al 2o
3
flux to anode containing 1~ Al2
o
3
,
after [image:59.580.106.525.60.661.2]PART II
.
• LABORATORY REDUCTION CELL STUDIES-(a) General
Following the investigations into the interfacial phenomena which have been detailed in Part I, wherein the effects of various additives to the carbon on the extent of contact between flux and anode have been studied, a logical step to take was the construction and operation of a laboratory scale reduction cell. By so doing, the performance of all types of anodes
prepared for contact angle work could be evaluated under electrolytic conditions. These conditions include for the purpose of this work: operating temperature, flux composition, anode dimensions and type, current and/or current density, total cell voltage, and "overvoltage". The nature of this "overvoltage" is explained in a later section.
From these measurements, it is possible to assess the effects of various addi-tives to the anodes, in terms of total cell voltage, 11overvoltage11
, current density,
and current efficiency. It is these operating para-meters which help to determine overall furnace perfor-_ mances, especially in as far as they are related to
power consumption and carbon consumption per unit weight of metal produced.
-As am,added advantage, the incorporation of beneficial and compatftble additives into the anodes can also provide a practical and continuous method of introducing raw materials into the electrolyte via the anodes, resulting in a more constant flux composition, as well as labour savings.
The extent to which the "wettability" of the carbon anode is improved by the incorporation of the additive materials can also be assessed electrolytically by
deliberate production of an anode effect at sufficiently high current densities. The greater the interfacial adhesion, the greater will b~ the current density re-quired to break this adhesion a·nd cause arc contact,
(b)' Structure of Cryolitic Melts.
:TI:nvestigation of the two-component system sodium fluoride - aluminium fluoride began in 1913 with the work of Fedotieff and Iljinski (7). Other workers
(8, 9,
10). have also studied this system, and a typical phase diagram, due to Grjotheim (11)', is shown overleaf.Noticeable peaks in the diagram occur .at
25
and50
mole percent AlF3, c0rresponding to the compositions of cryolite (Na3AlF6): and the compound NaAlF
4
resp-ectively.These compounds, tog:ther wi~h chiolite (Na
5
A13
F1
4~1
=
are known to contain AlF6 octahedra, with increasing sharing of fluoride ions between octahedra as the mole fraction of AlF
3
increases;On melting, cryolite undergoes some dissociation, as indicated by the broadening of the peak in the
NaF - AlF
3
phase diagram at25
mole percent AlF3•
Rolin (12) has suggested that the dissociation of molten cryolite is in agreement with the
reaction:-Na3A1F6 = 3Na+ + 3F- + AlF
3
as a value for ..6t/m of zero is obtained when small amounts of aluminium fluoride are added to molten cry-olite. Similar small additions of alumina confirm that AlF
Additionally, the presence of other
aluminium-fluorine species in the melt such as AlF
5
-
andAlF
5
-F-AlF5
5-,
has been postulated by Forland,Storegroven, and Urnes (13l, through the
reactions:-AlF
6
~~
= A-lF( -+: F or 2AlF6 - = A1F·5
-F-A1Fef- +F-When dissolved in molten cryolite, alumina ionizes,
according to RoTuin (12), by one of the following reactio·ns, according to the degree of dilution in the
melt:-- +
Al 2
o
~ = Al0)2 + AlO:+ +++ =
and AlO
=
A]_ +er
(great dilution)However, in practical melts in the aluminium ~ndus
try, one is not dealing with a "neutral" cryolite melt
(NaF/AlF
3
weight ratio 1.50), but with a melt to whichadditional aluminium fluoride has been intentionally
added for optimum eell operation. In such solutions,
oxy-fluoride anions are considered to be present in one
=
3-2-or m2-ore f2-orms (F~l0
2
AlF2
) , Al02F2 , and AlOF3
(14,15,16).
These are probably formed by the generalre.action (Ref.
17Y:-
-:l..-xAlF
3
+ yAl0-2 - =z'f
Al(x;y).O?f
F.~Jz
Thus,the ionic structure of these cryoliti'c melts
(i) simple cations of the metals present, i.e.,
+ ++ +++
Na , Ca , (in practical melts), Al (in very dilute solutions), and the cation AlO+;
(ii) possibly some neutral AlF
3
molecules;: and-(iii) the anions F-, Alo 2-, some 0-~ the oxy-fluoro ions referred to above, with small amounts of alumino-fluoride ions.
This complexity of structure is emphasised in a recent review
(17a),
where reference is made to no less'
than seventeen ionic species which have been postulated
\ .·
in cry?lite-a+~~~na ,melts.
From these comments, it is considered that the maximum eompatability or affinity between melt and
anodes will occur when the latter have been impregnated with compounds which, at the operating temperature of the reduction cell, will be in an ionic form, the ions present being those included above.
It is for this reason that fluorides, oxides, and carbonates of sodium calcium, aluminium, and lithium have been used in this work. (Lithium salts are being used in increasing amounts in aluminium smelting.)
/
LI
Weight % AlF
3 ---~
~400 20 40 60 80
I
PAlF=
1 atm1200
'
3I
I
+
I
1011
'
Liq. + AlF3
1000
I
I
I
I
800I
,... u0 .. ;:\ NaF 739
I .
' - ' Q) H ;:l .µ t1l H Q) @'' Q) E-l +
~·
Cr600
560
NaF
400 +
a - Cr
200 NaF
(J- Cr +
Ch
a - Cr + Ch
25
Mole % A1F
3 50
700 ±5
Ch + A1F
3
75
( Cr: cryolite
~ Ch: chiolite
Phase diagram of the NaF - A1F
3 system. (from the work of Grjotheim)
--- ·---~
(i) Cell Construction
Many designs for laboratory cells for
the study of alumina/cryolite electrolysis have been
described in the literature (18, 19, 20). Although
differing in details, these cells generally follow
simirar patterns, consisting of a graphite crucible as
cathode, placed securely in a suitable cylindrical
metal container, with a powdered coke packing1o ensure
good electrical contact. Both inconel and stainless
steel were variously used as outer container in the
present work. Fig. 30 ~hows the first cell design
used; it is similar to that described by Hollingshead
and Braunwarth (19). Airburn of the cathode crucible
was minimised by circular, segmented, sintered alumina
bricks, with a 3in diameter central opening to allow
insertion and removal of anode samples. Above the
alumina brickwork rested a similar set of porous silica
bricks, with the whole refractory assembly contributing
to the minimizing of heat losses from the cell contents.
Dimensionally, each cathode was Sin high with an internal
diameter of 6in, and a base thickness of 1in; the
refractory bricks were each 1in thick.
The 2in diameter anodes were threaded directly to
~-··.,1
..
~
CATHODE~
.:. I .
ANODECONNECTION CONNECTION
PLATH!lJM WIRE
COPPER ANODE·
ROD
SILICA BRICK
.!~LUMINA BRICK
GRAPHITE CATHODE
CRYOLLTE FLUX
INCONEL CRUCIBLE
~I
• 0 o • • • • •o o I • o o i 0.
. .
..
.
.' ... ·
.
.. . ..
..
.. .. ':' ..- - l - - + - - - - l - - - _, _ _ _ _ _ _ ,- ~
CARBON ~
...--ANODE _..,..-- .
FIGURE_10.
EXPERTME11TAL ELECTROLYTIC CELL CONSTRUCTIONAL
every fin along their entire length to assist in
deter-mining the extent of immersion of the anode in the
molten electrolyte.
Electrical connections were made to the cell
through snap-on heavy duty connectors designed to take
direct currents of up to 100A. Similar connectors
were used on the upper ends of the anode rods.
Provision was also made for measuring the voltage
drop between the anode rod and the electrolyte by
in-serting a 26 gauge platinum wire below the melt surface,
halfway between anode and cathode. The purpose of
this was to measure the effect of anode additives on
this component of the overall cell.voltage.
The whole assembly was contained in a 7.5KVA
resistance-heated furnaee; cell and furnace were
main-tained under an argon atmosphere to prevent oxidation,
and covered by a 11Miseolite" cover to reduce heat losses.
Temperature control was achieved by a variable
auto-transformer, and a 11Pyrotenax" chromel-alumel
thermo-couple placed between the cell and the furnace element,
operating a Cambridge temperature indicator-controller
of the on-off variety.
A second type of reduction cell which was used in
the later stages of this work is shown in Fig. 30a.
' I
/
CATHODE CONNECTION
COPPER AlfODE PLATINUM
SILICA BRICK
ALUMINA BRICK
ALUMINA POWDER
GRAPHITE RING
GRAPHITE
, ,
CR YO LI TE
LIQUID
STAINLESS. STEEL CRUCIBLE
1
CARBON :
1
ANODE :L----~
·~
Figure 30a (Half scale)
ANODE
CONNECTIOH
e • I o o ' "
.
.
... ..
• • I : I ' , I I . . . . I • o • •
:
':
·.·
::
.... [image:69.582.58.539.15.735.2]diameter from 9in to 7.5in, and the provision of a graphite ring above the crucible. The size reductian was in the interests of general ease of handling and the accommodation within the 11iin (maximum diameter) hex-agonal heating furnace, and the graphite ring was to contain a layer of alumina which was:..;'il.ntended to prevent airburn of the crucible rim. No other.detailed changes other than dimensions, were altered in this smaller cell.
The direct-current supply for electrolysis was pro-vided by a full wave germanium rectifier unit, designed to provide a maximum of 350 amperes at 12 volts. This rectifier was operated through a heavy duty oil-filled transformer (minimum setting 22V} and a 2.5 KVA variable autotransformer. Electrolysis current was measured by a O - 100A ammeter (graduated in 2A divisions), while overall cell voltage was measured on 0 - 10V meters
(graduated in
o.4v
divisions) and the anode-to-flux volt-age component was determined on 0 - 2V meters (0.1Vdivisions). These meters were all of the conventional five inch square type.
(ii) Raw Materials for Cell.
The materials used in the electrolyte were normal industrial-grade materials, a.nd were sieved
iron and silicon, contaminants considered detrimental in practice.
details).
(See Appendix "An for all analytical
The analytical results obtained are listed hereunder: Cryolite Aluminium Fluoride Calcium Fluoride Alumina Fe Si Na
~. NaF /.AlF
3
- ratio Free Al2
o
3
Fe Si Al Fe Si_ f:aF2
Fe2
o
3
Si020.01% 0.11%
33.6%
(calc.32.9
for Na3
AIF6)1.44%
o. 87% (after ignition at 900°c )'
0.01%
0.17%
29.7%
(calc.32.1
for AlF3
)
o.o5%
6.11%
97.~51r
0.01,%"
o.
016%'From these raw materials, a bath of the following nominal composition was prepared:
CaF 2 Free Al2
o
3
NaF/AlF3
ratio8.()%'
4.0%
1.40%
(by weight)This composition is within the normal operating range for cryolitic electrolyte for aluminium reduction