Informing the development of tsunami vertical evacuation strategies in New Zealand : a thesis presented in fulfilment of the requirements for the degree of Doctor of Philosophy in Emergency Management at Massey University, Wellington, New Zealand
356
0
0
Full text
(2) Informing the development of tsunami vertical evacuation strategies in New Zealand. A thesis presented in fulfilment of the requirements for the degree of. Doctor of Philosophy in Emergency Management. at Massey University, Wellington New Zealand. Stuart A. Fraser. 2014.
(3)
(4) ABSTRACT. Tsunami education and evacuation planning promote evacuation to high ground in the event of tsunami. In some low-lying coastal areas, the distance to safety on high ground or inland of the hazard zone may exceed the travel distance possible in the time before wave arrival. This is a particular problem in local-source tsunami with arrival times of less than one hour. Vertical evacuation provides alternative refuge within the inundation zone. Buildings, towers or berms can provide refuge at elevations above the tsunami flow depth, but must be designed to be effective in the maximum credible tsunami. The potential benefits and costs of vertical evacuation buildings were demonstrated during the 2011 Great East Japan earthquake and tsunami, when thousands of people took refuge in such structures. The aim of this thesis is to enhance the current theoretical and methodological basis for development of vertical evacuation strategies in New Zealand. To achieve this aim, numerical simulation of local-source tsunami is conducted at Napier, Hawke’s Bay, New Zealand, to establish the maximum credible inundation extent, flow depth and arrival times. Interview data describe the use of vertical evacuation in the 2011 Great East Japan tsunami, and surveys are used to investigate intended evacuation behaviour in a local-source tsunami. Finally, an existing geo-spatial evacuation analysis method, augmented with temporally-variable exposure and distributed travel speeds, is used to assess pedestrian evacuation potential in local-source tsunami. The method is demonstrated in an assessment of the need for vertical evacuation in Napier. The outputs of the four stages of research enhance the theoretical basis for planning evacuations in local-source tsunami, extends Geographic Information System-based evacuation modelling methods, and provides empirical advances in tsunami hazard and evacuation planning at Napier. The proposed methodology is applicable to other locations, thus contributes to tsunami risk reduction in New Zealand and internationally..
(5)
(6) ACKNOWLEDGEMENTS. I would like to thank many people who have provided support and enthusiasm, driven me forward with this research personally and professionally, and played an important role in making the past three years so eventful and rewarding. David Johnston and Graham Leonard have provided countless opportunities for me to learn, apply my research and expand my horizons; their investment, encouragement and support has been invaluable. I am grateful to Tiziana Rossetto and Paul Greening for hosting me at University College London and advising on the research during that time. William Power and Hannah Brackley made it possible for me to work within the GNS Science Tectonophysics department, affording me opportunities to learn from and contribute to ongoing research at GNS Science. Thank you to Xiaoming Wang for instruction on COMCOT, Christof Mueller for his patient coding advice, and Tom Wilson for hosting at University of Canterbury. I appreciate the collaboration with many co-authors during this process, who have helped improve my research skills through constructive review. Thank you to many colleagues and friends in Wellington and Christchurch, particularly Carol, Joshua, Tom, Louise, Maureen and Emma. I would like to acknowledge the support of Lisa Pearse, Craig Goodier and Marcus HayesJones of Hawke’s Bay CDEM group, who have showed great interest in the application of this work, sustaining my interest and enthusiasm for the topic. The opportunity to apply this work in Napier encourages me that this work can contribute to ongoing tsunami risk reduction. I have been lucky during the course of this research to visit Japan and the US Pacific Northwest on a number of occasions. Thank you to John Schelling and his colleagues at the State of Washington Emergency Management Division; the emergency managers with whom I met at the very beginning of this research; Hitomi Murakami, Ichiro Matsuo and translator Joel Challender, with whom we collaborated in Japan in October 2011. Thank you to all of my colleagues on the IStructE Earthquake Engineering Field Investigation Team with whom I visited Japan in June 2011. Victoria Sword-Daniels has been a constant source of inspiration, support and wise advice. Thank you for always pushing me further, for initiating our move to New Zealand, and for all of the adventures and opportunities that have come with it. This research was supported by New Zealand Ministry of Science and Innovation core geohazards funding to GNS Science and funding from the Joint Centre for Disaster Research. Additional funding for fieldwork was provided by Aon Benfield and Washington State Emergency Management Division..
(7)
(8) CONTENTS. Abstract . . . . . . . . . . . . . . . . . . . . . . . . . . . . . . . . . . . . . . . . . . .. iv. Acknowledgements . . . . . . . . . . . . . . . . . . . . . . . . . . . . . . . . . . . . .. vii. Contents . . . . . . . . . . . . . . . . . . . . . . . . . . . . . . . . . . . . . . . . . . .. xii. List of Figures . . . . . . . . . . . . . . . . . . . . . . . . . . . . . . . . . . . . . . . . xix List of Tables . . . . . . . . . . . . . . . . . . . . . . . . . . . . . . . . . . . . . . . . xxiv List of Acronyms . . . . . . . . . . . . . . . . . . . . . . . . . . . . . . . . . . . . . . xxv 1. Introduction . . . . . . . . . . . . . . . . . . . . . . . . . . . . . . . . . . . . . . .. 1. 1.1. Research aim and objectives . . . . . . . . . . . . . . . . . . . . . . . . . . . . .. 6. 1.2. Conceptual framework . . . . . . . . . . . . . . . . . . . . . . . . . . . . . . . .. 6. 1.3. Research methodology . . . . . . . . . . . . . . . . . . . . . . . . . . . . . . . . 11 1.3.1. Objective 1 . . . . . . . . . . . . . . . . . . . . . . . . . . . . . . . . . . 14. 1.3.2. Objective 2 . . . . . . . . . . . . . . . . . . . . . . . . . . . . . . . . . . 15. 1.3.3. Objective 3 . . . . . . . . . . . . . . . . . . . . . . . . . . . . . . . . . . 17. 1.3.4. Objective 4 . . . . . . . . . . . . . . . . . . . . . . . . . . . . . . . . . . 18. 1.4. Study area . . . . . . . . . . . . . . . . . . . . . . . . . . . . . . . . . . . . . . . 18. 1.5. Thesis structure . . . . . . . . . . . . . . . . . . . . . . . . . . . . . . . . . . . . 22 1.5.1. Literature review . . . . . . . . . . . . . . . . . . . . . . . . . . . . . . . 22. 1.5.2. Primary research and discussion . . . . . . . . . . . . . . . . . . . . . . . 22. 1.5.3. Appendices — Additional publications and developed code . . . . . . . . 23. 2. Tsunami processes and hazard . . . . . . . . . . . . . . . . . . . . . . . . . . . . . . 2.1. 2.2. 25. Tsunami generation . . . . . . . . . . . . . . . . . . . . . . . . . . . . . . . . . . 25 2.1.1. Seismic sources . . . . . . . . . . . . . . . . . . . . . . . . . . . . . . . . 25. 2.1.2. Landslide sources . . . . . . . . . . . . . . . . . . . . . . . . . . . . . . . 26. 2.1.3. Meteorological forcing, volcanic eruption, and bolide impact . . . . . . . . 27. Propagation and inundation . . . . . . . . . . . . . . . . . . . . . . . . . . . . . . 27.
(9) viii. Contents 2.3. 2.4. Impacts of tsunami . . . . . . . . . . . . . . . . . . . . . . . . . . . . . . . . . . 30 2.3.1. Structural damage . . . . . . . . . . . . . . . . . . . . . . . . . . . . . . 30. 2.3.2. Tsunami casualties . . . . . . . . . . . . . . . . . . . . . . . . . . . . . . 31. Historic tsunami in New Zealand . . . . . . . . . . . . . . . . . . . . . . . . . . . 32 2.4.1. Historic distant-source tsunami . . . . . . . . . . . . . . . . . . . . . . . . 33. 2.4.2. Historic regional-source tsunami . . . . . . . . . . . . . . . . . . . . . . . 37. 2.4.3. Historic local-source tsunami . . . . . . . . . . . . . . . . . . . . . . . . 37. 2.5. Palaeo-tsunami in New Zealand . . . . . . . . . . . . . . . . . . . . . . . . . . . 38. 2.6. Tsunami hazard assessment . . . . . . . . . . . . . . . . . . . . . . . . . . . . . . 41. 2.7. Summary and link to next chapter . . . . . . . . . . . . . . . . . . . . . . . . . . 43. 3. Tsunami risk reduction and preparedness . . . . . . . . . . . . . . . . . . . . . . . .. 45. 3.1. Land-use planning . . . . . . . . . . . . . . . . . . . . . . . . . . . . . . . . . . 45. 3.2. Structural mitigation . . . . . . . . . . . . . . . . . . . . . . . . . . . . . . . . . 49. 3.3. 3.2.1. Coastal defences . . . . . . . . . . . . . . . . . . . . . . . . . . . . . . . 49. 3.2.2. Tsunami loading and structural guidelines . . . . . . . . . . . . . . . . . . 51. Tsunami warnings . . . . . . . . . . . . . . . . . . . . . . . . . . . . . . . . . . . 55 3.3.1. Official warnings . . . . . . . . . . . . . . . . . . . . . . . . . . . . . . . 56. 3.3.2. Informal warnings . . . . . . . . . . . . . . . . . . . . . . . . . . . . . . 60. 3.3.3. Natural warnings . . . . . . . . . . . . . . . . . . . . . . . . . . . . . . . 61. 3.4. Preparedness . . . . . . . . . . . . . . . . . . . . . . . . . . . . . . . . . . . . . 62. 3.5. Education . . . . . . . . . . . . . . . . . . . . . . . . . . . . . . . . . . . . . . . 65. 3.6. Evacuation planning . . . . . . . . . . . . . . . . . . . . . . . . . . . . . . . . . 67. 3.7. 3.6.1. Evacuation maps . . . . . . . . . . . . . . . . . . . . . . . . . . . . . . . 67. 3.6.2. Evacuation signs . . . . . . . . . . . . . . . . . . . . . . . . . . . . . . . 70. 3.6.3. Evacuation exercises . . . . . . . . . . . . . . . . . . . . . . . . . . . . . 72. 3.6.4. Vertical evacuation . . . . . . . . . . . . . . . . . . . . . . . . . . . . . . 73. Summary and link to next chapter . . . . . . . . . . . . . . . . . . . . . . . . . . 75. 4. Tsunami inundation in Napier, New Zealand, due to local earthquake sources (Paper 1) . 4.1. 77. Background to numerical modelling . . . . . . . . . . . . . . . . . . . . . . . . . 77 4.1.1. Tsunami numerical model summary . . . . . . . . . . . . . . . . . . . . . 80. 4.2. Abstract . . . . . . . . . . . . . . . . . . . . . . . . . . . . . . . . . . . . . . . . 83. 4.3. Introduction . . . . . . . . . . . . . . . . . . . . . . . . . . . . . . . . . . . . . . 84. 4.4. Study area . . . . . . . . . . . . . . . . . . . . . . . . . . . . . . . . . . . . . . . 85. 4.5. Hikurangi subduction margin . . . . . . . . . . . . . . . . . . . . . . . . . . . . . 87 4.5.1. Tectonic setting and seismic potential . . . . . . . . . . . . . . . . . . . . 87. 4.5.2. Evidence of past earthquakes and tsunami . . . . . . . . . . . . . . . . . . 89.
(10) Contents 4.5.3 4.6. 4.7. ix. Previous tsunami hazard assessment . . . . . . . . . . . . . . . . . . . . . 91. Methodology . . . . . . . . . . . . . . . . . . . . . . . . . . . . . . . . . . . . . 92 4.6.1. Model setup . . . . . . . . . . . . . . . . . . . . . . . . . . . . . . . . . . 93. 4.6.2. Earthquake source mechanisms . . . . . . . . . . . . . . . . . . . . . . . 96. Results . . . . . . . . . . . . . . . . . . . . . . . . . . . . . . . . . . . . . . . . . 102 4.7.1. Flow depth and inundation extent . . . . . . . . . . . . . . . . . . . . . . 102. 4.7.2. Tsunami arrival time and waveforms . . . . . . . . . . . . . . . . . . . . . 107. 4.7.3. Structural damage potential . . . . . . . . . . . . . . . . . . . . . . . . . 112. 4.8. Conclusions . . . . . . . . . . . . . . . . . . . . . . . . . . . . . . . . . . . . . . 115. 4.9. Acknowledgments . . . . . . . . . . . . . . . . . . . . . . . . . . . . . . . . . . 116. 4.10 Comparison against rule-based mapping approach . . . . . . . . . . . . . . . . . . 116 4.11 Link to next chapter . . . . . . . . . . . . . . . . . . . . . . . . . . . . . . . . . . 117 5. Tsunami Vertical Evacuation Buildings — Lessons for International Preparedness Following the 2011 Great East Japan Tsunami (Paper 2) . . . . . . . . . . . . . . . . . . . . 119 5.1. Abstract . . . . . . . . . . . . . . . . . . . . . . . . . . . . . . . . . . . . . . . . 119. 5.2. Introduction . . . . . . . . . . . . . . . . . . . . . . . . . . . . . . . . . . . . . . 120. 5.3. Method of investigation . . . . . . . . . . . . . . . . . . . . . . . . . . . . . . . . 120. 5.4. Key features of TVEB . . . . . . . . . . . . . . . . . . . . . . . . . . . . . . . . 124 5.4.1. Tsunami-resistant construction . . . . . . . . . . . . . . . . . . . . . . . . 124. 5.4.2. Sufficient height of safe storeys . . . . . . . . . . . . . . . . . . . . . . . 126. 5.4.3. Building location planning . . . . . . . . . . . . . . . . . . . . . . . . . . 128. 5.4.4. Building capacity . . . . . . . . . . . . . . . . . . . . . . . . . . . . . . . 131. 5.4.5. Building access . . . . . . . . . . . . . . . . . . . . . . . . . . . . . . . . 131. 5.4.6. Fire resistance . . . . . . . . . . . . . . . . . . . . . . . . . . . . . . . . 134. 5.4.7. Evacuation signage . . . . . . . . . . . . . . . . . . . . . . . . . . . . . . 134. 5.4.8. Building owner agreement . . . . . . . . . . . . . . . . . . . . . . . . . . 135. 5.4.9. Community engagement . . . . . . . . . . . . . . . . . . . . . . . . . . . 136. 5.4.10 Evacuee welfare in TVEB . . . . . . . . . . . . . . . . . . . . . . . . . . 137 5.5. Conclusions . . . . . . . . . . . . . . . . . . . . . . . . . . . . . . . . . . . . . . 138. 5.6. Acknowledgements . . . . . . . . . . . . . . . . . . . . . . . . . . . . . . . . . . 139. 5.7. Link to next chapter . . . . . . . . . . . . . . . . . . . . . . . . . . . . . . . . . . 140. 6. Intended evacuation behaviour in a local earthquake and tsunami at Napier, New Zealand (Paper 3) . . . . . . . . . . . . . . . . . . . . . . . . . . . . . . . . . . . . . . . . . 141 6.1. Abstract . . . . . . . . . . . . . . . . . . . . . . . . . . . . . . . . . . . . . . . . 141. 6.2. Introduction . . . . . . . . . . . . . . . . . . . . . . . . . . . . . . . . . . . . . . 142. 6.3. Evacuation behaviour . . . . . . . . . . . . . . . . . . . . . . . . . . . . . . . . . 143.
(11) x. Contents. 6.4. 6.5. 6.3.1. Tsunami warnings and response . . . . . . . . . . . . . . . . . . . . . . . 144. 6.3.2. The household / family unit . . . . . . . . . . . . . . . . . . . . . . . . . 147. 6.3.3. Pre-evacuation actions and departure time . . . . . . . . . . . . . . . . . . 148. 6.3.4. Travel mode and destination . . . . . . . . . . . . . . . . . . . . . . . . . 149. 6.3.5. Transient populations . . . . . . . . . . . . . . . . . . . . . . . . . . . . . 150. Survey method . . . . . . . . . . . . . . . . . . . . . . . . . . . . . . . . . . . . 151 6.4.1. Aims . . . . . . . . . . . . . . . . . . . . . . . . . . . . . . . . . . . . . 151. 6.4.2. Survey structure . . . . . . . . . . . . . . . . . . . . . . . . . . . . . . . 152. 6.4.3. Sampling method . . . . . . . . . . . . . . . . . . . . . . . . . . . . . . . 153. 6.4.4. Study area and demographics . . . . . . . . . . . . . . . . . . . . . . . . 154. 6.4.5. Data analysis . . . . . . . . . . . . . . . . . . . . . . . . . . . . . . . . . 156. Results and discussion . . . . . . . . . . . . . . . . . . . . . . . . . . . . . . . . 160 6.5.1. Hazards information in Napier . . . . . . . . . . . . . . . . . . . . . . . . 160. 6.5.2. Tsunami hazard awareness and understanding . . . . . . . . . . . . . . . . 162. 6.5.3. Evacuation intentions in a local tsunami . . . . . . . . . . . . . . . . . . . 166. 6.6. Vertical evacuation buildings . . . . . . . . . . . . . . . . . . . . . . . . . . . . . 177. 6.7. Conclusions . . . . . . . . . . . . . . . . . . . . . . . . . . . . . . . . . . . . . . 180. 6.8. Acknowledgements . . . . . . . . . . . . . . . . . . . . . . . . . . . . . . . . . . 183. 6.9. Link to next chapter . . . . . . . . . . . . . . . . . . . . . . . . . . . . . . . . . . 183. 6.10 Appendix 1: Survey questions . . . . . . . . . . . . . . . . . . . . . . . . . . . . 184 6.11 Appendix 2: Information sheet . . . . . . . . . . . . . . . . . . . . . . . . . . . . 187 7. Variable population exposure and travel speeds in least-cost tsunami evacuation modelling (Paper 4) . . . . . . . . . . . . . . . . . . . . . . . . . . . . . . . . . . . . . . . . . 189 7.1. Abstract . . . . . . . . . . . . . . . . . . . . . . . . . . . . . . . . . . . . . . . . 190. 7.2. Introduction . . . . . . . . . . . . . . . . . . . . . . . . . . . . . . . . . . . . . . 190. 7.3. Study area . . . . . . . . . . . . . . . . . . . . . . . . . . . . . . . . . . . . . . . 191. 7.4. Methodology: pedestrian evacuation potential . . . . . . . . . . . . . . . . . . . . 194. 7.5. 7.4.1. Anisotropic least-cost path distance analysis . . . . . . . . . . . . . . . . . 194. 7.4.2. Time-variable population exposure . . . . . . . . . . . . . . . . . . . . . . 195. 7.4.3. Estimation of evacuation time . . . . . . . . . . . . . . . . . . . . . . . . 201. Results . . . . . . . . . . . . . . . . . . . . . . . . . . . . . . . . . . . . . . . . . 208 7.5.1. Spatio-temporal variation in evacuation demand . . . . . . . . . . . . . . . 208. 7.5.2. Evacuation departure time . . . . . . . . . . . . . . . . . . . . . . . . . . 211. 7.5.3. Impact of distributed travel speed . . . . . . . . . . . . . . . . . . . . . . 211. 7.5.4. Application of running speeds . . . . . . . . . . . . . . . . . . . . . . . . 212. 7.6. Conclusions . . . . . . . . . . . . . . . . . . . . . . . . . . . . . . . . . . . . . . 212. 7.7. Acknowledgements . . . . . . . . . . . . . . . . . . . . . . . . . . . . . . . . . . 214.
(12) Contents. xi. 7.8. Napier specific results . . . . . . . . . . . . . . . . . . . . . . . . . . . . . . . . . 215. 7.9. Link to next chapter . . . . . . . . . . . . . . . . . . . . . . . . . . . . . . . . . . 225. 8. Discussion . . . . . . . . . . . . . . . . . . . . . . . . . . . . . . . . . . . . . . . . 227 8.1. Local-source tsunami hazard in New Zealand and the need for vertical evacuation . 227. 8.2. Design of vertical evacuation refuges . . . . . . . . . . . . . . . . . . . . . . . . . 228 8.2.1. Structural requirements . . . . . . . . . . . . . . . . . . . . . . . . . . . . 228. 8.2.2. Refuge capacity . . . . . . . . . . . . . . . . . . . . . . . . . . . . . . . . 229. 8.2.3. Access to safe refuge level . . . . . . . . . . . . . . . . . . . . . . . . . . 230. 8.2.4. Evacuation signage . . . . . . . . . . . . . . . . . . . . . . . . . . . . . . 231. 8.2.5. Evacuee welfare . . . . . . . . . . . . . . . . . . . . . . . . . . . . . . . 231. 8.3. Community participation . . . . . . . . . . . . . . . . . . . . . . . . . . . . . . . 232. 8.4. Education . . . . . . . . . . . . . . . . . . . . . . . . . . . . . . . . . . . . . . . 232 8.4.1. Tsunami warning expectations and response . . . . . . . . . . . . . . . . . 232. 8.4.2. Evacuation actions . . . . . . . . . . . . . . . . . . . . . . . . . . . . . . 233. 8.4.3. Vertical evacuation refuges . . . . . . . . . . . . . . . . . . . . . . . . . . 234. 8.5. Evacuation modelling for local-source tsunami . . . . . . . . . . . . . . . . . . . 235. 8.6. Dissemination of research findings to date . . . . . . . . . . . . . . . . . . . . . . 236. 8.7. Limitations and future work . . . . . . . . . . . . . . . . . . . . . . . . . . . . . 236. 8.8. 8.7.1. Hazard modelling . . . . . . . . . . . . . . . . . . . . . . . . . . . . . . . 236. 8.7.2. Evacuation refuges and behaviour . . . . . . . . . . . . . . . . . . . . . . 237. 8.7.3. Evacuation modelling . . . . . . . . . . . . . . . . . . . . . . . . . . . . 238. Conclusions . . . . . . . . . . . . . . . . . . . . . . . . . . . . . . . . . . . . . . 239. 9. Bibliography . . . . . . . . . . . . . . . . . . . . . . . . . . . . . . . . . . . . . . . 241. Appendices. 281. A. GNS Science report: Scoping study for evaluating the tsunami vulnerability of New Zealand buildings for use as evacuation structures . . . . . . . . . . . . . . . . . . . . . . . . 283 B. Excerpts from EEFIT report: The MW 9.0 Tōhoku Earthquake and Tsunami of 11th March 2011 — A Field Report by EEFIT . . . . . . . . . . . . . . . . . . . . . . . . . . . . 285 C. Bulletin of Earthquake Engineering: Tsunami damage to coastal defences and buildings in the March 11th 2011 MW 9.0 Great East Japan earthquake and tsunami . . . . . . . . . 287 D. GNS Science Report: Tsunami evacuation: Lessons from the Great East Japan earthquake and tsunami of March 11th 2011 . . . . . . . . . . . . . . . . . . . . . . . . . . . . . 289.
(13) xii. Contents. E. GNS Science Report: Validation of a GIS-based attenuation rule for indicative tsunami evacuation zone mapping. . . . . . . . . . . . . . . . . . . . . . . . . . . . . . . . . 291. F. Potential ground shaking at Napier . . . . . . . . . . . . . . . . . . . . . . . . . . . . 293 G. Evacuation modelling process charts . . . . . . . . . . . . . . . . . . . . . . . . . . . 301 H. Contribution Statements for co-authored papers . . . . . . . . . . . . . . . . . . . . . 311 I. Publication list . . . . . . . . . . . . . . . . . . . . . . . . . . . . . . . . . . . . . . 321.
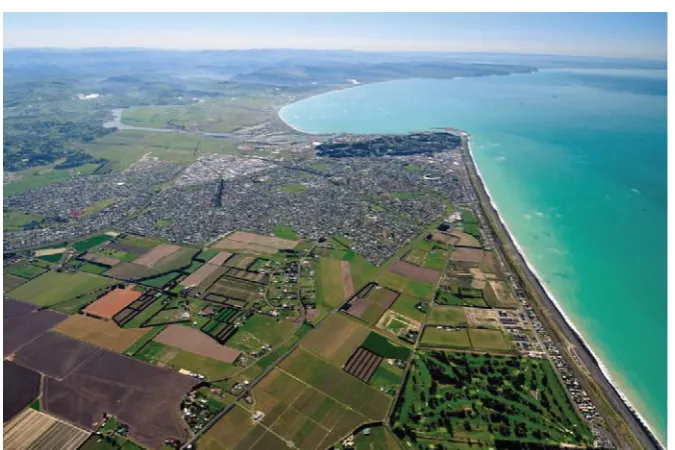
(14) LIST OF FIGURES. 1.1. Maps of tsunami source events, 2000 BC – 2013 AD. A: Earthquake sources, B: Coseismic (red triangle) and aseismic (black circle) landslide sources, C: Volcanic sources (with and without earthquake and/or landslide), D: Meteorological sources. Source of event data: National Geophysical Data Center/World Data Service (2014).. 1.2. 5. The New Zealand Civil Defence Emergency Management (CDEM) framework (MCDEM, 2008b). . . . . . . . . . . . . . . . . . . . . . . . . . . . . . . . . . . . .. 7. 1.3. Risk management process (Standards New Zealand, 2009). . . . . . . . . . . . . .. 8. 1.4. An holistic disaster risk reduction framework (Johnston et al., 2014). . . . . . . . .. 9. 1.5. The research method. . . . . . . . . . . . . . . . . . . . . . . . . . . . . . . . . . 12. 1.6. A generic framework for the development of an evacuation plan, after Scheer, Varela, and Eftychidis (2012). . . . . . . . . . . . . . . . . . . . . . . . . . . . . 12. 1.7. A: Study area shown in the national context. B: Napier Territorial Authority in the Hawkes Bay regional context with numbered locations indicating palaeo-ecological analysis referred to in-text. The boundary of Napier Territorial Authority is shown and other locations referred to in-text are also indicated. C: Digital Elevation Model (DEM) of 10 m horizontal resolution showing topography of Napier Territorial Authority with labelled unit areas (suburbs), rivers, Napier Port and Hawkes Bay Airport. . . . . . . . . . . . . . . . . . . . . . . . . . . . . . . . . . . . . . . . . 13. 1.8. Oblique aerial photograph looking north towards Napier. The majority of the Territorial Authority is visible in this photograph. Photo credit: D Townsend/GNS Science . . . . . . . . . . . . . . . . . . . . . . . . . . . . . . . . . . . . . . . . 20. 1.9. Oblique aerial photograph looking south across Westshore, Napier Port and Bluff Hill/Hospital Hill. Photo credit: D Townsend/GNS Science . . . . . . . . . . . . . 20. 1.10 Oblique aerial photograph looking south-west over Napier Port, Bluff Hill, Ahuriri and Westshore. Photograph taken in 2001. Source: Hawke’s Bay Regional Council. 21 1.11 Oblique aerial photograph looking southeast across the residential suburbs of Napier. Note the three large tree-lined culverts, crossed by major roads. Photo credit: D Townsend/GNS Science . . . . . . . . . . . . . . . . . . . . . . . . . . . . . . 21 2.1. Schematic diagram of tsunami wave terminology. . . . . . . . . . . . . . . . . . . 26.
(15) xiv. List of Figures 2.2. Predicted wave amplitude for two tsunami scenarios in the Pacific Ocean (UNESCO/IOC, 2011). . . . . . . . . . . . . . . . . . . . . . . . . . . . . . . . . . . 29. 2.3. The tectonic setting of New Zealand, showing the major subduction and strike-slip faults at the boundary of the Pacific and Australasian Plates. Slip rates are shown in red for each of the Hikurangi subduction margin, Alpine Fault and Puysegur Trench. Source: GNS Science Geological Map of New Zealand, http://data.gns. cri.nz/geoatlas/text.jsp?Page=1. . . . . . . . . . . . . . . . . . . . . . . . . . . . . 34. 2.4. Run-up height from distant and local-source tsunami in the New Zealand historic record, 1820s to 2013. Flags indicate source location for local-source events, and general direction of origin for distant-source events. Source: GNS Science, the original image has been updated to include recent events. . . . . . . . . . . . . . . 35. 3.1. Map of locations at which field investigation was conducted. The ria and plains coastal environments are also highlighted. . . . . . . . . . . . . . . . . . . . . . . 50. 3.2. Standard Tsunami signs for New Zealand (MCDEM, 2008c). Signs shown are A: Tsunami evacuation zone; B: Tsunami evacuation zone with reference to a specific zone; C: Evacuation route direction (arrow can be turned any direction); D: Vehicular evacuation route; E: Pedestrian evacuation route; F: Vertical evacuation route; G: Safe location for pedestrian routes; H: Safe location for vertical evacuation; I: Previous event sign, indicating maximum flow depth in that event. . . . . . . . . . 71. 3.3. Examples of the blue lines used in an increasing number of Wellington coastal communities. a) A blue line at the edge of the maximum inundation zone, credit: Nick Thompson. b) A directional sign with the distance to the blue line, credit: RadioNZ. . . . . . . . . . . . . . . . . . . . . . . . . . . . . . . . . . . . . . . . 72. 4.1. A: Study area shown in the national context. B: Napier Territorial Authority in the Hawkes Bay regional context with numbered locations indicating palaeo-ecological analysis referred to in-text. The boundary of Napier Territorial Authority is shown and other locations referred to in-text are also indicated. C: 10 m DEM showing topography of Napier Territorial Authority with labelled unit areas (suburbs), rivers, Napier Port and Hawkes Bay Airport. Virtual tide gauges quoted in the text are identified . . . . . . . . . . . . . . . . . . . . . . . . . . . . . . . . . . . . . . . 86. 4.2. Map illustrating the shaded bathymetry of the model domain. The main map shows grid 1 with the plate boundary marked. The inset shows Hawkes Bay and nested grids 2–4 . . . . . . . . . . . . . . . . . . . . . . . . . . . . . . . . . . . . . . . 88. 4.3. Surface roughness values (Mannings coefficients) applied in Napier, based on New Zealand Landcover Database 2 data (Ministry for the Environment, 2009, LCDB2;) 95.
(16) List of Figures 4.4. xv. Vertical deformation applied as tsunami generation in COMCOT, with source patches delineated (grey dashed lines). A: Lachlan Fault rupture using simple fault geometry and 9.0 m slip (MW 7.7); B: Rupture of the plate interface offshore of Hawkes Bay (MW 8.4); C: Rupture of southern and central Hikurangi subduction margin (MW 8.8); D: Rupture of the whole Hikurangi subduction margin (MW 9.0). Vertical scale differs on each image. The background value of approximately zero deformation is retained to indicate the extent of vertical deformation domain. Depth contours (km) of the plate interface model (Ansell and Bannister, 1996) are shown in C . . . . . . . . . . . . . . . . . . . . . . . . . . . . . . . . . . . . . . 97. 4.5. Maximum flow depth and inundation extent 1 h after rupture in and around Napier Territorial Authority due to simulated scenarios. Legend and scale are identical for each map. A1, A2: Lachlan Fault rupture using simple fault geometry with 9.0 m slip (MW 7.7) at Mean Sea Level (MSL) and Mean High Water (MHW), respectively; B: Rupture of the plate interface offshore Hawkes Bay (MW 8.4) at MSL; C: Rupture of southern and central Hikurangi subduction margin (MW 8.8) at MSL; D1, D2: Rupture of the whole Hikurangi subduction margin (MW 9.0) at MSL and MHW, respectively . . . . . . . . . . . . . . . . . . . . . . . . . . . . . 105. 4.6. Maximum flow depth and inundation extent 1 h after rupture in Napier city due to simulated scenarios. Legend and scale are identical for each map. A1, A2: Lachlan Fault rupture using simple fault geometry with 9.0 m slip (MW 7.7) at MSL and MHW, respectively; B: Rupture of the plate interface offshore Hawkes Bay (MW 8.4) at MSL; C: Rupture of southern and central Hikurangi subduction margin (MW 8.8) at MSL; D1, D2: Rupture of the whole Hikurangi subduction margin (MW 9.0) at MSL and MHW, respectively . . . . . . . . . . . . . . . . . . 106. 4.7. Tsunami travel times for the North Island and northern South Island with key urban centres indicated. Arrival times are shown for waves above the 0.05 m threshold. Insets show arrival times in Hawkes Bay. A: Lachlan Fault rupture using simple fault geometry and 9.0 m slip (MW 7.7); B: Rupture of the plate interface offshore of Hawkes Bay (MW 8.4); C: Rupture of southern and central Hikurangi subduction margin (MW 8.8); D: Rupture of the whole Hikurangi subduction margin (MW 9.0) 108. 4.8. Comparison of simulated wave forms at key offshore and onshore gauges. Water level (m) is shown for offshore gauge 1, and flow depth (m) is shown for onshore gauges 2, 3, 4 and 5. Water level is adjusted for coseismic deformation . . . . . . . 109.
(17) xvi. List of Figures 4.9. Damage potential maps providing comparison between: i. timber frame building damage levels due to a whole-margin rupture using fragility curves from Japan 2011 (Suppasri et al., 2013a) (A–C) and Chile 2010 (Mas et al., 2012b) (D); ii. RC building damage levels due to a whole-margin rupture using fragility curves from Japan 2011 (Suppasri et al., 2013a) (E–G) and American Samoa 2009 (Mas et al., 2012b) (H); iii. probability of moderate damage to timber frame building due to each scenario using fragility curves from Japan 2011 (Suppasri et al., 2013a) (A, I–K) . . . . . . . . . . . . . . . . . . . . . . . . . . . . . . . . . . . . . . . . . . 114. 4.10 Probabilistic hazard curve for Napier, showing maximum amplitude of tsunami at the coast due to all possible tsunami sources (Power, 2013). . . . . . . . . . . . . . 117 4.11 The Geographic Information System (GIS)-calculated attenuation rule based evacuation zone for Napier, compared against the simulated inundation zone from a scenario of a whole margin rupture (MW 9.0). . . . . . . . . . . . . . . . . . . . . 118 5.1. Map and images of Tsunami Vertical Evacuation Buildings (TVEB) in MinamiSanriku Town, including numbers of people saved and tsunami inundation marked in yellow (University of Tokyo, 2011). (A) Matsubara apartment block; (B) TakanoKaikan conference venue; (C) Shizugawa Hospital; (D) Fishing Cooperative. . . . 125. 5.2. Map and images of nine vertical evacuation buildings in Kesennuma City, including numbers of people saved and tsunami inundation marked in yellow (University of Tokyo, 2011). These comprise office buildings (A, F, G, I); a cannery (B), a retail building (C), welfare centre (D), a car parking deck (E) and a community centre (H). . . . . . . . . . . . . . . . . . . . . . . . . . . . . . . . . . . . . . . . 127. 5.3. Map and images of vertical evacuation buildings in Kamaishi City and tsunami inundation marked in yellow (University of Tokyo, 2011). These are the Kamaishihamachō Post Office and apartment building (A) and government offices (B). . . . 130. 5.4. Vertical evacuation signage used in Japan. (A) Sign displayed prominently on the Kamaishihamachō Post Office, (B) signage on the Matsubara apartment block in Minami-Sanriku, (C) a sign displayed above an entrance to the Kamaishihamachō Post Office (Translation: Evacuation building entrance (stairways)). . . . . . . . . 135. 6.1. A) Location of Hawke’s Bay on a national scale; B) Location of Napier Territorial Authority in the context of Hawke’s Bay; C) Napier Territorial Authority boundary overlain on a Digital Elevation Model (DEM) to illustrate local topography; D) Map of survey locations and evacuation destinations overlain on the DEM and road network. Basemap sources: GEBCO, NOAA, National Geographic, DeLorme, and Esri; OpenStreetMap and contributors, Creative Commons-Share Alike License (CC-BY-SA). . . . . . . . . . . . . . . . . . . . . . . . . . . . . . . . . . . . . . 155.
(18) List of Figures 6.2. xvii. Heights of buildings in Napier, assuming that one storey is approximately 3 m in height. Data source: Napier City Council. . . . . . . . . . . . . . . . . . . . . . . 156. 6.3. A) Residents’ approximate home location and their intention to evacuate or remain at home following ground shaking. Green circles show intention to evacuate, with evacuation arrows indicating direction to their stated destination (if named during the survey). Red circles mark intention to not evacuate and a square indicates that the reason was because they believed themselves to be safe at that location. B) Survey locations with evacuation direction to respondents’ stated destination (if named during the survey) or their home if that was their intended destination. Evacuation arrows which end off the map indicate evacuation to Hastings, Wairoa and Dartmoor as labelled. Tsunami flow depth and inundation extent generated by Fraser et al. (2014) for an MW 9.0 rupture of the Hikurangi margin is including on the map to indicate the worst-case tsunami hazard zone. Basemap source: OpenStreetMap and contributors, Creative Commons-Share Alike License (CC-BY-SA). . . . . . . 173. 7.1. A: Study area topography and locations of suburbs in Napier Territorial Authority. B: Simulated flow depth due to the maximum credible local-source subduction earthquake and inundation extent at 60 min after rupture (Fraser et al., 2014). Inset shows the position of Napier in the national context. C: Meshblock boundaries and 2013 estimate of Usually Resident Population (URP) density for each meshblock (for clarity, smaller meshblocks are shown without boundaries). URP density is classified using Natural Breaks (Jenks). . . . . . . . . . . . . . . . . . . . . . . . 193. 7.2. Population-time profiles to distribute working-age adults (A, B) and children (C, D) to home, work/school and unspecified locations. Profiles are shown for a weekday (A, C) and weekend (B, D). . . . . . . . . . . . . . . . . . . . . . . . . . . . . . . 197. 7.3. Population-time profiles to distribute visitors (A), independent elderly (B) and dependent elderly (C) to home or accommodation, and unspecified locations. Profiles for these groups are the same for weekdays and weekends. . . . . . . . . . . . . . 200.
(19) xviii 7.4. List of Figures Evacuation time curves in the range 0–90 min, showing wave arrival time and PV E values for each curve. ‘d’ refers to a weekday scenario, ‘e’ to a weekend scenario. The number following ‘d’ or ‘e’ refers to the hour of the day (24 hr clock). A: Mean PV E and 95% confidence intervals based on 500 simulations for the February weekday 02:00 exposure scenario; B: Diurnal variation in evacuation time for February weekday and weekend scenarios; C: Seasonal variation in evacuation time for a weekend 12:00 scenario; D: Comparison of evacuation time curves for a February 02:00 scenario, with and without evacuation departure time; E: Comparison of analysis with distributed travel speeds compared to fixed speeds for a February 02:00 scenario; and F: The impact of applying a different probabilities that unimpaired adults and children run to evacuate. . . . . . . . . . . . . . . . . . 203. 7.5. Minimum and maximum bounds of evacuation departure time, represented by Rayleigh functions with μ=7 min and μ=38 min. In each simulation, mean evacuation departure time is sampled from the range 7–38 min, and a new Rayleigh function generated. Each individual’s evacuation departure time is then sampled from that curve, which falls in the shaded area. . . . . . . . . . . . . . . . . . . . 204. 7.6. Normally-distributed travel speed for each population group based on statistics presented in Table 7.2. Distributions are derived from the range of travel speeds identified for different groups in the evacuation literature (Table 7.1). . . . . . . . . 206. 7.7. Point density maps showing the density of population with an evacuation time greater than wave arrival time PV E . Generated using the distributed travel speed approach, these maps indicate the variation due to diurnal changes in population distribution. A: Feb weekday 02:00; B: Feb weekday 12:00; C: Feb weekend 12:00; D: Maximum density from all tested exposure scenarios; E: Feb weekday 02:00 with evacuation delay omitted (evacuation travel time only); F: Feb weekday 02:00 using fixed speed of 0.89 ms-1 ; G: Feb weekday 02:00 using fixed speed of 1.1 ms-1 ; H: Feb weekday 02:00 using fixed speed of 1.79 ms-1 . . . . . . . . . . . 210. 7.8. Average total evacuation time (ETt ) for the population in Napier, in a February 02:00 exposure scenario. Time data is overlaid on maximum flow depth values, indicating that the areas of maximum ETt are also those with flow depths >3 m. . 217. 7.9. Mean and range of PV E for each suburb in Napier, across all modelled exposure scenarios. . . . . . . . . . . . . . . . . . . . . . . . . . . . . . . . . . . . . . . . 221. 7.10 Top five locations for TVEB in Napier, based on maximum evacuee density across all scenarios. . . . . . . . . . . . . . . . . . . . . . . . . . . . . . . . . . . . . . 222 7.11 Minimum elevation of vertical evacuation refuge, according to FEMA (2008) guidelines and maximum credible flow depth (Fraser et al., 2014). . . . . . . . . . . . . 223 7.12 Potential impact on the February 02:00 evacuation time curve due to implementation of the two most-optimal TVEB, individually and in combination. . . . . . . . 224.
(20) List of Figures 8.1. xix. Proposed options for vertical evacuation signs for improved representation of TVEB. Symbology is consistent with current signage standards but provides clearer depiction of the role of buildings and refuges. Image (b) shows an example of the sign with additional directional information noting the safe storey or distance to refuge. . . . . . . . . . . . . . . . . . . . . . . . . . . . . . . . . . . . . . . . . . 231. F.1. United States Geological Survey (USGS) Predefined Vs30 Mapping for New Zealand. Source: http://earthquake.usgs.gov/hazards/apps/vs30/predefined.php . . . . . . . 296. F.2. Modified Mercalli Intensity (MMI) ShakeMap produced for a MW 9.0 earthquake finite-source model on the Hikurangi subduction margin, using OpenSHA. Log10(MMI) = 0.96 corresponds to MMI IX; Log10(MMI) = 0.96 corresponds to MMI VIII . . 297. F.3. USGS ShakeMap estimated MMI for the 2011 Great East Japan earthquake. Source: http://earthquake.usgs.gov/earthquakes/shakemap/global/shake/c0001xgp/ . . . . . 298. G.1 Model diagram of the model methodology developed in this thesis, which augments the method of Wood and Schmidtlein (2012, 2013). . . . . . . . . . . . . . 302 G.2 Flow chart indicating the process developed to generate distributed exposure datasets.303 G.3 Flow chart indicating the process developed to generate evacuation compliance rate (CR). . . . . . . . . . . . . . . . . . . . . . . . . . . . . . . . . . . . . . . . . . 304 G.4 Flow chart indicating the process developed to apply variable travel speeds into methodology. . . . . . . . . . . . . . . . . . . . . . . . . . . . . . . . . . . . . . 305 G.5 Flow chart indicating the process developed to generate PV E raster. . . . . . . . . 306 G.6 Flow chart indicating the process developed to generate Maximum PV E raster . . . 307 G.7 Flow chart indicating the process developed to develop a raster of safe zones at vertical evacuation facilities. . . . . . . . . . . . . . . . . . . . . . . . . . . . . . 308 G.8 Flow chart indicating the process developed to develop a revised path distance raster including vertical evacuation buildings as safe zones. This raster is applied in further evacuation analyses to assess the impact of different combinations of TVEB sites. . . . . . . . . . . . . . . . . . . . . . . . . . . . . . . . . . . . . . . 309.
(21)
(22) LIST OF TABLES. 1.1. The 10 most deadly tsunami since the 1980s, based on number of reported fatalities. Total number of deaths for some events differ in the literature, dependent on whether the number of missing people is included . . . . . . . . . . . . . . . . . .. 2. 3.1. Proposed classification of evacuation areas (Shibayama et al., 2013). . . . . . . . . 53. 3.2. Description of tsunami loads considered by FEMA (2008). . . . . . . . . . . . . . 54. 4.1. COMCOT model domain information, showing spatial extent and cell resolution of model grids in arc seconds and metres, data source and data resolution. . . . . . 93. 4.2. List of virtual tide gauges with their location and elevation. . . . . . . . . . . . . . 96. 4.3. Scenario fault parameters. *Denotes that the scenario uses variable slip parameters on multiple source patches, for which this table presents a summary. A range of slip values, strike and dip angles are given for these events. Full variable slip parameters are provided on the accompanying CD. . . . . . . . . . . . . . . . . . 100. 4.4. Approximate peak flow depth and maximum inundation extent in selected suburbs. Refer to Fig 4.5 for inundation mapped for all suburbs. Values refer to inundation at MSL conditions, unless scenario is denoted with *, in which case the first value refers to inundation under MSL conditions, the second to MHW conditions. Where no inundation occurred, this is denoted by ‘–’. . . . . . . . . . . . . . . . . . . . . 103. 4.5. Key parameters of waveforms at virtual tide gauges. Arrival time is relative to a threshold of 0.05 m. Height refers to water level for offshore gauge and flow depth for onshore gauges. The first peak is recorded, and if that peak is negative the first positive peak is shown in order to demonstrate lag-time of the drawdown and peak water level. Only data due to maximum slip are shown for scenarios A and B. . . . 110.
(23) xxii. List of Tables 5.1. Summary of TVEB in locations visited during this research. Field observations were not made at all buildings listed. A full inventory of known building features is provided by Fraser et al. (2012a). Not all buildings were available for observation during field investigations, but data on those buildings has been collected through interviews. (a) Tsunami data from field surveys [30]; (b) Casualty data at 14th February 2012 [31];(c) Buildings designated as refuge for multiple hazards evacuation, not specifically as TVEB; (d)Number of people saved is available for only one TVEB in Ōfunato City; (e) Number of people saved at Sendai International Airport is not included. . . . . . . . . . . . . . . . . . . . . . . . . . . . . . 122. 5.2. TVEB 24-hour access methods, showing numbers of buildings for each method in the locations surveyed. Data on external stairs is from field observations. Data on alternative access methods is from local interviews. Not all TVEB were accessible for observation during field investigations.. (a) Schools. in Natori have external stairs. but staff members are also organised to open the building. . . . . . . . . . . . . . . 133 6.1. Residential status of respondents. Residents are classed as those living in Napier Territorial Authority. Visitors are separated into those from Hawke’s Bay, those from the rest of New Zealand and those from overseas. Percent values may not sum to 100% due to rounding. . . . . . . . . . . . . . . . . . . . . . . . . . . . . 157. 6.2. Distribution of age group in the survey sample and the Subnational Population Estimates: At 30 June 2012 (SNPE; http://www.stats.govt.nz/browse for stats/population/ estimates and projections/). Age group shows 16–39, while the SPE original data showed 15–39. SNPE data for ages <15 are omitted from the total. Percent values may not sum to 100% due to rounding. . . . . . . . . . . . . . . . . . . . . . . . . 157. 6.3. Distribution of gender within the survey sample and the 2006 census data for Napier City, excluding people under the age of 15. Source: http://www.stats.govt. nz/Census/about-2006-census/regional-summary-tables.aspx. Percent values may not sum to 100% due to rounding. . . . . . . . . . . . . . . . . . . . . . . . . . . 157. 6.4. Distribution of ethnicity within the survey sample and the 2006 census data for Napier City. *For the census, people stating multiple ethnic groups are included in as many groups as they list, so one person listing their ethnic group as European and Maori is counted once in each of the separate groups. All ages are included in the census totals as the data does not allow exclusion of people under the age of 16. Source: http://www.stats.govt.nz/Census/about-2006-census/regionalsummary-tables.aspx. Percent values may not sum to 100% due to rounding. . . . 158.
(24) List of Tables 6.5. xxiii. Distribution of highest level of education within the survey sample. *Trade qualification includes Level 1, 2, 3, 4, Certificates gained post-school; Undergraduate includes Level 5 and 6 Diplomas, Bachelor degree and Level 7 qualifications. Source: http://www.stats.govt.nz/Census/about-2006-census/regional-summary-tables. aspx. Percent values may not sum to 100% due to rounding. . . . . . . . . . . . . 158. 6.6. Distribution of household income within the survey sample. Household income statistics are not available at the Territorial Authority or regional level for the 2006 census or more recently. Percent values may not sum to 100% due to rounding. . . 159. 6.7. Length of time residents have lived in Napier. Percent values may not sum to 100% due to rounding. . . . . . . . . . . . . . . . . . . . . . . . . . . . . . . . . . . . . 159. 6.8. Percentage of respondents who believed each hazard has the potential to cause damage or casualties at Napier. . . . . . . . . . . . . . . . . . . . . . . . . . . . . 163. 6.9. Cross-tabulation of the percentage of residents and visitors who regard earthquake and tsunami as hazards in Napier. The table captures presents belief in neither hazard, both hazards, or one hazard but not the other affecting Napier. . . . . . . . 163. 6.10 Respondents’ opinions on whether a tsunami might be possible after long or strong ground shaking at Napier. . . . . . . . . . . . . . . . . . . . . . . . . . . . . . . . 164 6.11 Percentage of respondents citing potential information sources of tsunami warning. Respondents were requested to name as many formats as possible. . . . . . . . . . 165 6.12 Percentage of respondents who anticipate tsunami arrival in each timeframe following a natural warning. Respondents were requested to select all categories that they believed to be applicable — percentage reflects the ‘Yes’ responses in each timeframe as a percentage of the status group. Only respondents who answered ‘Yes’ to the previous question (Do you believe that a tsunami may be possible after long or strong ground shaking?) were asked to provide estimates of arrival time. . . 167 6.13 Percentage of respondents who anticipate tsunami arrival in each timeframe following an official warning. Respondents were requested to select all categories that they believed to be applicable — percentage reflects the ‘Yes’ responses in each timeframe as a percentage of the status group. . . . . . . . . . . . . . . . . . 167 6.14 Percentages of respondents who would evacuate from the survey location or from home, split by residential status and gender. These values represent intentions after prompting in the survey to consider tsunami evacuation. . . . . . . . . . . . . . . . 169 6.15 Influence of level of education on intention to evacuate from the survey location and from the home. Percentage values refer to the number of respondents quoting each theme. . . . . . . . . . . . . . . . . . . . . . . . . . . . . . . . . . . . . . . 170 6.16 Percentage of respondents citing intended evacuation actions at the survey location and the home. Action themes are sorted (descending order) by percentage citing the action at the survey location. . . . . . . . . . . . . . . . . . . . . . . . . . . . 171.
(25) xxiv. List of Tables. 6.17 Reasons given for non-evacuation of the survey location. *Four of these responses were given at Clive Square and one at Marewa shops, both of which are located within the tsunami hazard zone. . . . . . . . . . . . . . . . . . . . . . . . . . . . 172 6.18 Respondents’ reported destinations if intending to evacuate from the survey location.176 6.19 Proportion of residents and visitors with vehicle or pedestrian intended travel modes. Respondents were able to answer with more than one travel mode, therefore percentages may sum to greater than 100%. . . . . . . . . . . . . . . . . . . . . . . . 177 6.20 Percentage of respondents citing different possible safe locations in a tsunami. . . . 179 7.1. Pedestrian travel speeds used in previous evacuation analyses; these speeds are used in this study to generate travel speed distributions. Sources — 1: FEMA (2008, P646 pg. 52); 2: Wood and Schmidtlein (2012); 3: Cabinet Office Government of Japan (2005); 4: Yagi and Hasemi (2010); 5: Chooramun, Lawrence, and Galea (2012); 6: Revi and Singh (2006); 7: Knoblauch, Pietrucha, and Nitzburg (1996); 8: Park et al. (2012a); 9: Liu et al. (2009); 10: Johnstone (2012); 11: Liu, Hatayama, and Okada (2006); 12: Goto et al. (2012b); 13: Sugimoto et al. (2003);14: Post et al. (2009); 15: Mas et al. (2012a). . . . . . . . . . . . . . . . . 206. 7.2. Travel speed statistics (ms-1 ) for each travel speed group, compiled from travel speeds in the citations given in Table 7.1. . . . . . . . . . . . . . . . . . . . . . . 207. 7.3. Absolute PV E for each suburb in Napier across modelled exposure scenarios, with relevant statistics. . . . . . . . . . . . . . . . . . . . . . . . . . . . . . . . . . . . 218. 7.4. Population values for each tested exposure scenario. Columns show the number of people in the safe zone, with sufficient evacuation potential (<38 min), and with insufficient evacuation potential (≥38 min). . . . . . . . . . . . . . . . . . . . . . 220. 7.5. The potential impact of implementing TVEB at the two most optimal locations, on PV E in a February 02:00 scenario. Percentage change shows the impact of implementing TVEB on PV E , relative to the situation with no TVEB. . . . . . . . 220. F.1. Estimated rupture duration (s) from a range of rupture length (km) and rupture velocity (kms-1 ) values. *Denotes the lower and upper limits of the MW 9.0 earthquake applied in Chapter 4 . . . . . . . . . . . . . . . . . . . . . . . . . . . . . . 293. F.2. The New Zealand MMI scale. Source: http://info.geonet.org.nz/display/quake/ Shaking+Intensity. . . . . . . . . . . . . . . . . . . . . . . . . . . . . . . . . . . 299.
(26) LIST OF ACRONYMS. ABM Agent Based Model. ADA Americans with Disabilities Act. AEP Annual Exceedance Probability. ANUGA Australian National University-Geoscience Australia. API Application Programming Interface. ASCE American Society of Civil Engineers. BP Years before present. CAPI Computer-Assisted Personal Interviewing. CDEM Civil Defence Emergency Management. COMCOT COrnell Multi-grid COupled Tsunami. DART Deep-Ocean Assessment and Reporting of Tsunamis. DEM Digital Elevation Model. DRR Disaster Risk Reduction. EEFIT Earthquake Engineering Field Investigation Team. EQC New Zealand Earthquake Commission. FEMA Federal Emergency Management Agency. GIS Geographic Information System. GPS Global Positioning System. HFA The Hyogo Framework for Action 2005–2015..
(27) xxvi. List of Acronyms. IBC International Building Code. IL Importance Levels. ISO International Standards Office. IStructE UK Institution of Structural Engineers. JMA Japanese Meteorological Agency. LCD Least-Cost Distance. LiDAR Light Detection and Ranging. MCDEM Ministry of Civil Defence and Emergency Management. MHW Mean High Water. MMI Modified Mercalli Intensity. MOST Method of Splitting Tsunami. MSL Mean Sea Level. NIWA National Institute of Water and Atmospheric Research. NOAA National Oceanic and Atmospheric Administration. NPO-CeMI Crisis and Environment Management Policy Institute. NSHM National Seismic Hazard Map. NTHMP National Tsunami Hazard Mitigation Program. NWS National Warning System. NZCPS New Zealand Coastal Policy Statement. NZTA New Zealand Transport Agency. PEP Public Education Programme. PTHA Probabilistic Tsunami Hazard Assessment. PTWC Pacific Tsunami Warning Center. PTWS Pacific Tsunami Warning System..
(28) List of Acronyms. xxvii. RC Reinforced Concrete. RiCOM River and Coastal Ocean Model. RMA Resource Management Act. SMS short message service. SRC Steel Reinforced Concrete. SWE Shallow Water Equations. TEP Tsunami Expert Panel. TUNAMI Tohoku University’s Numerical Analysis Model for Investigation of Near-field tsunamis. TVEB Tsunami Vertical Evacuation Buildings. URP Usually Resident Population. US United States. USD United States Dollars. USGS United States Geological Survey. VBA Visual Basic for Applications. WREMO Wellington Regional Emergency Management Office. WTPS ‘What’s The Plan Stan?’..
(29)
(30) 1. INTRODUCTION. Vertical evacuation is a strategy for risk reduction, which can enhance evacuation capacities in local-source tsunami, floods and storm surges. New Zealand science and emergency management communities have begun to consider the application of vertical evacuation strategies to provide additional evacuation capacity in the case of local-source tsunami due to Hikurangi subduction zone earthquakes. This thesis presents new inundation modelling of local-source tsunami in New Zealand and research on vertical evacuation in the 2011 Great East Japan tsunami. It contributes new data on evacuation behaviour and pedestrian evacuation potential in local-source tsunami. These distinct research components combine to provide recommendations for the application of vertical evacuation in New Zealand. This research is timely, commencing weeks before the 2011 Great East Japan tsunami, which demonstrated the potentially devastating impacts of large-magnitude local-source tsunami and provided a unique post-tsunami case study of vertical evacuation. Tsunami have the potential to cause massive destruction and a high death toll when they inundate populated coastlines. Over 200,000 people died in the 2004 Indian Ocean tsunami, over 19,000 people died in the 2011 Great East Japan tsunami, and several other tsunami since the 1980s have each resulted in hundreds to thousands of deaths (Table 1.1). Past events have shown that evacuation of the hazard zone is important for maximising chances of personal survival. Evacuation is most-often recognised as the horizontal movement of people to safe locations outside the hazard zone, i.e., further inland or to areas of high ground outside the inland extent of the hazard. In local-source tsunami there may only be minutes before tsunami arrival in proximal locations, precluding dissemination of official warnings to the public. For earthquake-generated local-source tsunami, ground shaking is likely to be felt in coastal areas proximal to the source. When this shaking is interpreted as a natural warning of tsunami, which often requires public education, it can trigger evacuation of the exposed population. In tsunami with particularly short arrival times or in areas with long distances to high ground, the exposed population may not have sufficient time to travel to safety, even if they evacuate immediately after the earthquake. Vertical evacuation has been proposed as a solution to enhance evacuation capacity in such situations (Cabinet Office Government of Japan, 2005; FEMA, 2008, 2009; Okada et al., 2005; Project Safe Haven, 2011a,b). In vertical evacuation, people seek safety above the tsunami flow within the hazard zone by moving into multi-storey tsunami-resistant buildings or towers, or to raised areas of natural/artificial high ground..
(31) 2. 1. Introduction. Tab. 1.1: The 10 most deadly tsunami since the 1980s, based on number of reported fatalities. Total number of deaths for some events differ in the literature, dependent on whether the number of missing people is included. Event. Date. No. of fatalities. Source. Indian Ocean. 26 Dec 2004. 226,898. United States Geological Survey (Earthquakes with 50,000 or More Deaths). Great East Japan. 11 Mar 2011. 19,000. Suppasri et al. (2013b). Papua New Guinea. 17 July 1998. 2,182. Kawata et al. (1999). Flores, Indonesia. 12 Dec 1992. 1,712. Yeh et al. (1993). Java. 17 July 2006. 802. National Geophysical Data Center/World Data Service (2014). Mentawai, Sumatra. 25 Oct 2010. 431. National Geophysical Data Center/World Data Service (2014). Java. 3 June 1994. 344. Tsuji et al. (1995). Okushiri, Japan. 12 July 1993. 230. Satake and Tanioka (1995). Samoa. 29 Sep 2009. 189. Okal et al. (2010). Nicaragua. 2 Sep 1992. 168. Lander, Whiteside, and Lockridge (2003). Maule, Chile. 27 Feb 2010. 124. Fritz et al. (2011). Izmit, Turkey. 17 Aug 1999. ≥150. Lander, Whiteside, and Lockridge (2003). Irian Jaya, Indonesia. 17 Feb 1996. 110. Disaster Prevention Research Institute (2004). Sea of Japan, Japan. 26 Apr 1983. 103. Lander, Whiteside, and Lockridge (2003). Total. 1983-2011. 252,443.
(32) 3 Tsunami science effectively began in Japan following the 1896 Meiji Sanriku tsunami, which killed 22,000 people (Shuto and Fujima, 2009). Since then, the major advances in this field have been in response to major events, notably the development of forecasting and ‘comprehensive countermeasures’ following the 1933 Shōwa Sanriku tsunami (Shuto and Fujima, 2009). The distant-source 1960 Chile tsunami provided insight in Japan into the different onshore impacts that can occur in distant tsunami compared to previous local-source tsunami, for example longer wave period. This event was the catalyst for development of some of the founding theories of tsunami science (Kajiura, 1970), and development of structural tsunami defences, including tsunami breakwaters that were designed using the first instance of numerical modelling for tsunami (Shuto and Fujima, 2009). Elsewhere, the 1960 tsunami triggered the expansion of the Pacific Tsunami Warning System (PTWS) to become a Pacific-wide warning system, having been solely focussed on the United States (US) since its inception. Progression in numerical simulation developed from proposal of a method for simulating the initial tsunami surface deformation due to an earthquake (Mansinha and Smylie, 1971b), implementation of shallow water theory (Goto and Ogawa, 1982) and increasing computational capabilities. With the increased ability to assess tsunami hazard, risk reduction practices have been continuously developed and have become more widely applied around the World. Tsunami are generated when a source event rapidly displaces a sufficiently large volume of water in a body of water. The most common cause is displacement of the sea bed during submarine earthquakes (1,811 events (72%) of 2,501 contained in the NOAA/NGDC tsunami event data catalogue; National Geophysical Data Center/World Data Service, 2014). Tsunami can also occur due to: coseismic (88, 4%) or aseismic (85, 3%) sub-marine or sub-aerial landslides; submarine or sub-aerial volcanic eruptions (146, 6%); meteorological conditions (91, 4%). Thirteen events (1%) are listed as ‘questionable earthquakes’, two are attributed to ‘astronomical tide’ and one is attributed to ‘explosion’. The remaining 11% (264 events) are listed as having an unknown source. The greatest tsunami hazard exists along coastlines that face subduction boundaries, in Indonesia, the Mediterranean Sea and around the Pacific ‘Ring of Fire’ (Fig 1.1). Global historic tsunami statistics show that 43% of all offshore earthquakes (>MW 5.0, a focal depth shallower than 200 km and a sea depth less than 7 km) in the years 1963-2011 have been tsunamigenic (Suppasri, Imamura, and Koshimura, 2012). The highest ratio of tsunamigenic earthquakes to all offshore earthquakes occurs in New Guinea-Solomon (62%), Alaska-Aleutians (59%) Japan (56%), KurileKamchatka (56%), South America (54%) and New Zealand-Tonga (51%) (Suppasri, Imamura, and Koshimura, 2012). Tsunami are commonly categorised in terms of their travel time from source to impact. Localsource tsunami (also near-field tsunami) are defined in New Zealand as having a source that is <1 hr of tsunami travel time to the location of interest. Regional-source tsunami have a travel time of 1–3 hr1 and distant-source tsunami, >3 hr. The same tsunami source may be considered 1. The Solomon Islands is regarded as a regional source, despite having travel time of 4-5 hours.
(33) 4. 1. Introduction. local to one area and regional or distant to other areas, dependent on the location of interest. This classification is useful for tsunami research and response because: (a) the distance from source influences the impact of a tsunami, and (b) effective tsunami response is reliant on the time interval between event generation and arrival of waves at the location of interest. The primary impacts of tsunami are damage to coastal defences, buildings, infrastructure and lifelines. Tsunami pose a significant threat to life of anyone who comes into contact with inundation, due to the significant flow depths and velocities and the entrainment of debris, which can range in size from sand grains to large debris such as ships. Historic tsunami (most notably Peru 1868, Gisborne 1947, and Chile 1960) have inundated coastal areas of New Zealand and demonstrate the potential for casualties and economic damage from local and distant source events. Additionally, palaeo-tsunami studies provide evidence of significant (>MW 7.0) tsunamigenic earthquakes at the Hikurangi subduction margin (Cochran et al., 2005, 2006). The first New Zealand national tsunami hazard and risk reviews were conducted in 2005 (Berryman, 2005; Webb, 2005). Since then, there has been an increased focus on tsunami hazard assessment and risk reduction through ongoing tsunami education, installation of warning sirens and evacuation route planning. Damage and life loss can be mitigated by land-use planning to minimise development within the tsunami hazard zone, by installing tsunami-resistant coastal defences, bridges and buildings, and by maximising people’s ability to evacuate the hazard zone prior to wave arrival. A comprehensive disaster mitigation strategy should comprise all of these approaches, but implementation of each element is not always suitable or feasible. While there has been much progress in tsunami risk reduction and readiness in New Zealand in the last decade, vertical evacuation could enhance tsunami evacuation capabilities in a number of locations around the country where the distance to high ground would present difficulties for evacuation during a local-source tsunami. Additionally, vertical evacuation could be used in regional-source tsunami. The distance of regional-source earthquake from land means that there may be no natural warning in the form of ground shaking or gentle swaying, but the time required to process and disseminate official warnings could result in minimal available evacuation time between a warning and wave arrival. This introductory chapter presents the research aim and objectives, contextualises the research within the framework of risk management in New Zealand, outlines the research methodology and describes the structure of the thesis..
(34) Fig. 1.1: Maps of tsunami source events, 2000 BC – 2013 AD. A: Earthquake sources, B: Coseismic (red triangle) and aseismic (black circle) landslide sources, C: Volcanic sources (with and without earthquake and/or landslide), D: Meteorological sources. Source of event data: National Geophysical Data Center/World Data Service (2014).. 5.
(35) 6. 1. Introduction. 1.1. Research aim and objectives. Recognising the aforementioned New Zealand tsunami hazard, impacts of tsunami and importance of evacuation, there has been much progress in developing tsunami warnings, evacuation signs, maps and education around the country (Johnston et al., 2014). To address the potential for difficulty in evacuating certain areas in a local tsunami, New Zealand research and emergency management communities initiated a scoping study to review international examples of vertical evacuation and explore the potential for using Tsunami Vertical Evacuation Buildings (TVEB) in New Zealand (Leonard et al., 2011). The scoping study focussed on structural components of TVEB and how they would be incorporated into the New Zealand emergency management legislative framework, building standards and land-use planning. Importantly, the scoping study did not address the assessment of where vertical evacuation might be a suitable evacuation option, or how to determine optimal placement of refuges. This thesis seeks to address this knowledge gap and provide recommendations for the implementation of vertical evacuation in New Zealand. Internationally, engineers are currently applying the experience of structural damage in Tōhoku, Japan, in the development of new design guidelines for tsunami-resistant buildings (Chock, 2012). These will provide guidance for development of tsunami-resistant standards within the New Zealand national building codes, and this thesis does not seek to pre-empt or replicate this engineering work. The overall aim of this thesis is to enhance the current theoretical and methodological basis for development of vertical evacuation strategies in New Zealand. The objectives set to achieve this aim are to: 1. Determine maximum credible inundation extent, flow depth and available evacuation time due to local-source subduction zone tsunami at a case study location in New Zealand (Chapter 4); 2. Elucidate experiences of vertical evacuation in the March 2011 Great East Japan tsunami to inform vertical evacuation planning in New Zealand (Chapter 5); 3. Explore intended evacuation behaviours in local-source tsunami in New Zealand, and gather preliminary research on public perception of vertical evacuation facilities (Chapter 6); 4. Develop a method to assess pedestrian evacuation potential of the exposed population to inform decision-making on evacuation planning, including vertical evacuation strategies (Chapter 7).. 1.2. Conceptual framework. This research contributes to natural hazards management and risk reduction in New Zealand, which is conducted within the Civil Defence Emergency Management (CDEM) sector. The 2002 CDEM.
(36) 1.2. Conceptual framework. 7. Act promotes: sustainable management of hazards; encourages communities to reduce risk to acceptable levels; provides for planning and preparation for civil defence emergencies, and for response and recovery; requires local authorities to co-ordinate reduction, readiness, response and recovery activities through regional groups; provides a basis for the integration of national and local CDEM; and encourages coordination across a wide range of agencies, recognising that civil defence emergencies are multi-agency events (MCDEM, 2008b). The approach prescribed by the Act is described by four areas of activity: Reduction, Readiness, Response, and Recovery. By informing the development of evacuation plans, this thesis makes its primary contribution to Readiness, in that it develops capabilities for public response in advance of a civil defence emergency. CDEM in New Zealand is led by the Ministry of Civil Defence and Emergency Management (MCDEM) and the operational structure (Fig 1.2) is determined by the CDEM Act 2002, which requires local authorities to be part of a regional CDEM group. The 16 CDEM groups in New Zealand must each have a CDEM Group Plan, which states and provides for the arrangements necessary to manage hazards and risks affecting that region. The information presented in this thesis is intended to be of use by CDEM group members (i.e., local authorities) to ascertain the requirement for vertical evacuation in coastal communities within their jurisdiction. It is expected that the research would contribute to the development of a national standard on planning and design of vertical evacuation facilities.. Fig. 1.2: The New Zealand CDEM framework (MCDEM, 2008b).. The CDEM Act 2002 ‘requires that a risk management approach be taken when dealing with hazards’ (MCDEM, 2008b, p. 5). This is achieved by working to the New Zealand Standard risk management guidance, which requires anticipation and understanding of risk before evaluation of whether that risk warrants modification, when judged against risk criteria (Standards New Zealand, 2009, Fig 1.3). Leonard et al. (2008a), and later Johnston et al. (2014) presented the New Zealand.
(37) 8. 1. Introduction. Fig. 1.3: Risk management process (Standards New Zealand, 2009).. Standard risk management process in a hazards context (Fig 1.4). Risk is commonly defined as the product of hazard and vulnerability (Blaikie et al., 1994). Risk identification is the first phase of risk assessment and requires that the sources and causes of risk are identified, in addition to potential areas of impact and consequences (Standards New Zealand, 2009). Hazard is ‘[a] dangerous phenomenon, substance, human activity or condition that may cause loss of life, injury or other health impacts, property damage, loss of livelihoods and services, social and economic disruption, or environmental damage’ (UNISDR, 2009, p.17). Hazard comprises the probability or frequency of an event occurring, the potential intensity of its damaging parameter (e.g., ground shaking, flow depth or wind speed), its onset speed and spatial extent (Wisner, Gaillard, and Kelman, 2012). Hazard frequency is described in terms of exceedance probability: the probability of exceeding a chosen intensity threshold in any given year. This can be converted into a recurrence interval or return period by taking the inverse of exceedance probability. Therefore, a 1% Annual Exceedance Probability (AEP) is the same as an average recurrence interval (or ‘return period’) of 100 yr and a 1 in 500 yr annual recurrence interval is equivalent to 0.2% AEP. Vulnerability refers to ‘[t]he characteristics and circumstances of a community, system or asset that make it susceptible to the damaging effects of a hazard.’ (UNISDR, 2009, p.30). The consequences of a hazard are influenced by vulnerability, which is a product of numerous interacting social, cultural and economic factors (Wisner, Gaillard, and Kelman, 2012). In engineering terms, vulnerability refers to the structural damage sustained at a given level of impact (e.g., earthquake magnitude or tsunami flow depth) in terms of vulnerability or fragility curves. Risk analysis develops the understanding of the risk and its consequences (Standards New.
(38) 1.2. Conceptual framework. Fig. 1.4: An holistic disaster risk reduction framework (Johnston et al., 2014).. 9.
(39) 10. 1. Introduction. Zealand, 2009). Numerical modelling of past events or stochastic event sets, statistical analysis or experimental analysis is used to determine the spatio-temporal dimension of the hazard impact. Vulnerability models translate the impact into consequences, in terms of casualties (killed or injured), damage ratio or monetary loss. Insured loss assessment (‘catastrophe modelling’) is widely conducted in the reinsurance industry (Grossi and Kunreuther, 2005). Several loss models exist to assess economic loss and casualties to aid mitigation planning, including the Federal Emergency Management Agency (FEMA) HAZUS2 model and the GNS/NIWA RiskScape model (Schmidt et al., 2011). Risk evaluation requires decision-makers to define a set of risk criteria that reflect their organisation’s or community’s risk appetite or level of acceptable risk. The results of risk analysis are compared against these criteria to determine what form, if any, of risk treatment is warranted to reduce the risk (Standards New Zealand, 2009). Risk management forms an important component of Disaster Risk Reduction (DRR) — the over-arching ‘concept and practice of reducing disaster risks through systematic efforts to analyse and reduce the causal factors of disasters’ (UNISDR, 2005, 2009). DRR includes: reduction of hazard exposure and vulnerability of people and property; sustainable land and environment management; and improvements in preparedness and early warning capabilities3 . Mitigation aims to reduce the likelihood of a hazardous event occurring, reduce the negative consequences if it does occur, avoid the risk altogether, or transfer/spread the risk. Risk transfer is primarily achieved through (re)insurance mechanisms that spread financial risk. It is currently impossible to reduce the likelihood of tsunami occurrence. Therefore, tsunami mitigation focusses on reduction of negative consequences by reducing or avoiding exposure to tsunami (through land-use planning and relocation of assets and population), and reducing vulnerability by improving warning systems and evacuation infrastructure, installing sea defences, and constructing/strengthening buildings to tsunami-resistant standards. In the international DRR context, The Hyogo Framework for Action 2005–2015 (HFA) recognises evacuation in its ‘Priority for Action’ number 5: ‘Strengthen disaster preparedness for effective response at all levels’ (UNISDR, 2005, p.12): ‘losses can be substantially reduced if authorities, individuals and communities in hazard-prone areas are well prepared and ready to act and are equipped with the knowledge and capacities for effective disaster management.’ Key activities under this priority are to: ‘Prepare or review and periodically update disaster preparedness and contingency plans and policies at all levels, with a particular focus on the most vulnerable areas and groups. Promote regular disaster preparedness exercises, including evacuation drills, with a view to ensuring rapid and effective disaster response and access to essential food and non-food relief supplies, as appropriate, to local needs.’ 2 3. http://www.fema.gov/hazus http://www.unisdr.org/who-we-are/what-is-drr.
Figure


+7


Related documents
It was decided that with the presence of such significant red flag signs that she should undergo advanced imaging, in this case an MRI, that revealed an underlying malignancy, which
This study aims to test whether the liquidity proxied by Current Ratio (CR) has an effect on the dividend policy of manufacturing sector of consumer goods sector
Assessing the Impact of Biodiversity Conservation in the Management of Maize Stalk Borer (Busseola f
Field experiments were conducted at Ebonyi State University Research Farm during 2009 and 2010 farming seasons to evaluate the effect of intercropping maize with
Radio and TV broadcast music related programmes which provide opportunities not just. to listeners but also to the
21 Department of Neurosurgery, Tangdu Hospital, The Second Affiliated hospital of the Fourth Military Medical University, 1 Xinsi Road, Xian, Shanxi Province 710038, People ’ s
The use of sodium polyacrylate in concrete as a super absorbent polymer has promising potential to increase numerous concrete properties, including concrete
19% serve a county. Fourteen per cent of the centers provide service for adjoining states in addition to the states in which they are located; usually these adjoining states have
