INTRODUCTION
The arrow squid Nototodarus gouldi(Cephalopoda: Ommastrephidae) is widespread across southern Australia and in northern New Zealand. Recent biolog-ical studies have shown that, in Australian waters, N. gouldi are genetically well-mixed (Triantafillos et al. 2004), live for less than 1 yr and are multiple spawners, with hatching occurring year-round (Mc-Grath & Jackson 2002, Jackson et al. 2003). The spe-cies is a valuable by-catch of shelf and slope trawl fish-eries and is the exclusive target of Australia’s largest squid jig fishery, which occurs seasonally in waters off Victoria (Winstanley et al. 1983, Lynch 2004). There is also a sporadic jig fishery in inshore Tasmanian waters during the summer months, concentrated primarily off the southeast coast. Samples from this fishery have shown that female N. gouldi are mostly immature
when they first move into coastal waters, but mature progressively throughout the Tasmanian summer (Willcox et al. 2001). The inshore movement in south-eastern Tasmania is most likely related to feeding as females of this species must meet the cost of ma-turation with increased food consumption rather than through energy re-allocation (McGrath & Jack-son 2002). Similar feeding migrations are well-documented for other Ommastrephid squid (Haimovici et al. 1998, Perez & O’Dor 1998, Mokrin et al. 2002, Nigmatullin et al. 2002, Watanabe et al. 2004).
Nototodarus gouldiis the most important cephalo-pod resource in Australian waters, yet little is known about its ecology and nothing about its movement patterns. The biomass (based on fishery production) of N. gouldi in southeastern Tasmania varies greatly, both within and between years (Willcox et al. 2001), and movement, possibly in response to
environmen-© Inter-Research 2005 · www.int-res.com *Email: [email protected]
Tracking arrow squid movements with an
automated acoustic telemetry system
Kate E. Stark
1, 2,*, George D. Jackson
1, Jeremy M. Lyle
21Institute of Antarctic and Southern Ocean Studies, University of Tasmania, Private Bag 77, Hobart, Tasmania 7001, Australia 2Marine Research Laboratories, Tasmanian Aquaculture & Fisheries Institute, University of Tasmania, Private Bag 49,
Hobart, Tasmania 7001, Australia
ABSTRACT: This study investigated the movement, spatial usage and activity patterns of the arrow squid Nototodarus gouldi (Cephalopoda: Ommastrephidae) using an automated acoustic telemetry system. Sixty-four automated acoustic receivers were aligned as underwater ‘curtains’ across the entrances to bays and inlets around Storm Bay, southeastern Tasmania. N. gouldiwere tagged with small uniquely coded transmitters and released. Twelve tagged squid were detected for up to 37 d over an area of more than 300 km2. Tagged squid moved widely between Storm Bay and the Derwent River, but none were detected moving into the adjoining bays or the D’Entrecasteaux Channel. Tagged squid appeared to move out of Storm Bay throughout the study period, suggesting a highly dynamic population. There was evidence of a relationship between level of activity and photoperiod, with visits to receivers being longer and more variable in duration in the night compared to the day-time. Schooling or group movement was not observed. Rates of movement between non-adjacent receivers varied widely with those over distances of 10 km or more, ranging from 0.09 to 0.52 mantle lengths per second (ML s–1), and 1 instance of an average speed of 3.6 ML s–1over 9.3 km.
KEY WORDS: Ommastrephid squid · Acoustic telemetry · Tagging · Movement · Behaviour · Cephalopod · Tasmania
tal conditions, is thought to play a key role in shap-ing these patterns. Despite this, we have no under-standing of the timing and nature of movement between inshore and offshore areas, how N. gouldi utilise the inshore environment, and how they behave with regard to schooling and activity pat-terns. With the development of electronic tagging systems, these issues can now be addressed with fewer logistical constraints than traditional tag recap-ture methods.
The use of acoustic tracking systems and archival data loggers has provided valuable insights into migration patterns (e.g. Block et al. 2001, Comeau et al. 2002), gene flow and dispersion (e.g. Moran et al. 2003), habitat preferences and home ranges (e.g. Parsons et al. 2003), and responses to physical and biological variability (e.g. Brill et al. 2002, Heupel & Hueter 2002). However, few studies using this tech-nology have been conducted on cephalopods. Most have focussed on behaviour and energetics over small spatial and temporal scales, employing radio-acoustic positioning and telemetry systems (RAPT; O’Dor et al. 1994, Sauer et al. 1997, O’Dor 2002, Aitken et al. 2005). Larger-scale
movement and migration patterns are known to be important processes in cephalopod populations, but are usually implied from analyses of dis-tribution, abundance and biological patterns (e.g. Hatfield & Rodhouse 1994, Arkhipkin 2000). There has been very limited tag-recapture work (Nagasawa et al. 1993, Sauer et al. 2000, Markaida et al. 2005), active tracking (Nakamura 1993) or use of archival and pop-up satel-lite tags (TOPP; www.toppcensus. org).
The aims of this study were to investigate and describe the move-ment patterns of Nototodarus gouldi in southeastern Tasmania using an automated underwater acoustic tracking system (Vemco). The system comprises compact acoustic receivers, each containing a hydrophone and data recorder, and small tags that transmit a unique acoustic signal (Klimley et al. 1998, Voegeli et al. 1998). Receivers moored at specific locations continuously record the presence of any tag that moves into its detection radius, and thus movement pathways and spatial usage patterns can be derived.
MATERIALS AND METHODS
Study site. The study was carried out in Storm Bay and its associated bays, inlets and estuaries (Fig. 1). Storm Bay is a large shallow basin in southeast Tas-mania. It has an area of more than 500 km2 and a maximum depth of 85 m (Clementson et al. 1989). The waters are mostly less than 50 m in depth and the bot-tom primarily sand, with occasional small patches of rocky reef.
[image:2.612.238.540.377.669.2]Acoustic receivers. Sixty-four VR2 acoustic recei-vers (Vemco) were deployed within the study area. Each receiver was fastened to a vertical steel pole on a concrete mooring, approximately 1 m above the sea floor. Acoustic release mechanisms (Sub Sea Sonics) were attached to receivers deployed in deep water (> 20 m); otherwise, divers were used for retrieval. Receivers were aligned equidistantly into ‘curtains’ across the entrances to several water bodies in the study area (Curtains B, C, D, E, F, G, H and I; Fig. 1). Receivers at L were not aligned in a single curtain but as 3 short lines perpendicular to the coastline (Fig. 1) and are referred to as ‘Array’ L. These receivers were
originally deployed as part of another study, but are included here because arrow squid detections were recorded on them.
The depths of receivers ranged from 2 to 55 m, and were placed on sand, silt or seagrass, although 1 recei-ver (E1) was on low profile reef. Receirecei-vers were spaced between 725 and 930 m apart within each curtain. Although not range-tested, a detection radius of be-tween 365 and 465 m was required for full curtain coverage.
The receiver network was deployed in October 2002 but due to a lack of availability, squid were not tagged until January 2003. Most receivers were retrieved in early April 2003, although 1 receiver in Curtain H was removed earlier (21 March) after becoming entangled in a fishing net. The receivers in Array L were not retrieved until May 2003 and a receiver in Curtain G was not retrieved until July 2003 due to difficulties in relocating it.
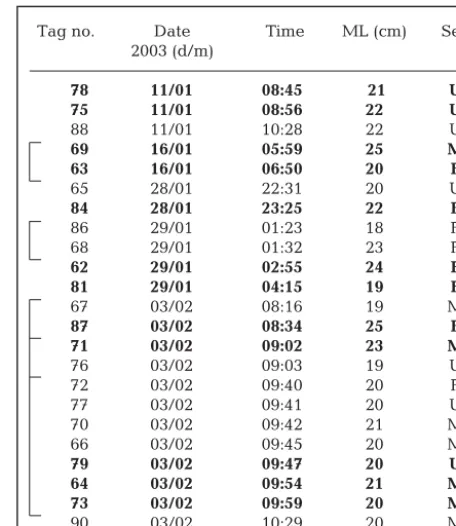
Acoustic transmitters. The transmitters used to tag arrow squid were V8SC-2H coded pingers (Vemco). The cylindrical transmitters are 30 mm in length, 9 mm in diameter, and weigh 3.1 g in water. They each trans-mit a unique pinging sequence at a frequency of 69 kHz, which is repeated after a random delay of between 20 and 60 s. Battery life was rated at 87 d. Transmitters were activated by soldering together the 2 activation wires and prepared for tagging by gluing a fine 1.10 mm × 38 mm needle across the top of the transmitter. Squid were tagged with the transmitters 2 to 25 d after activation, the delay for some transmitters being due to unexpected difficulty in obtaining squid for tagging. Nototodarus gouldi were scarce and patchy during the 2002/03 summer; individuals were rarely captured at the same location and time as each other (Table 1). Thus, transmitter batteries were due to expire between 62 and 85 d after actual deployment.
Nototodarus gouldiwere caught using jigs on hand lines and immediately placed in a tagging cradle. Dorsal mantle length (ML) was measured to the near-est centimetre and individuals were sexed where pos-sible by noting the presence of hectocotylisation on arm IV. A minimum tagging size of 18 cm ML was set, ensuring the transmitter was less than 2.5% of the total body weight in all individuals (Willcox et al. 2001).
The transmitter was placed just inside the ventral mantle of the squid, the needle piercing through the mantle to the outside where it was crimped in place and cut off. Silicon washers were used to prevent the transmitter and crimp from abrading the squids’ man-tle (after O’Dor et al. 1994). After tagging, squid were injected at the base of the arms with 1 to 2 ml of the antibiotic tetracycline, dissolved to saturation in sea-water (approx. 6 mg ml–1). Squid were held gently in the water and released when deemed to have
recov-ered sufficiently (when jetting water strongly). Squid were out of the water during the tagging process for less than 1 min.
Analyses. Data were downloaded as text files from the VR2s and then transferred to an MS-Access data-base. Individual movement tracks were plotted in ArcView 3.2 using the Animal Movement extension point-to-polyline tool (Hooge & Eichenlaub 1997). Spa-tial usage was examined by comparing detection data between receivers and curtains. No statistical tests were conducted due to the spatial autocorrelation of the data. The coverage of each curtain was calculated as the proportion of a straight line running along a cur-tain (through each receiver) that was within detection range, assuming receiver detection radii of 400 m. This is probably a conservative estimate, given that detec-tion ranges have been found to be at least 400 m over a range of depths and habitats (Arendt et al. 2001, Heupel & Hueter 2001, Comeau et al. 2002, Welch et al. 2003).
Activity patterns were inferred by the number of visit events. A visit event for a particular transmitter was defined as a continuous string of observations at a curtain, where there was no more than 30 min be-tween consecutive observations. Thus, a single visit event could comprise only 1 observation at 1 receiver,
Tag no. Date Time ML (cm) Sex
2003 (d/m)
78 11/01 08:45 21 U
75 11/01 08:56 22 U
88 11/01 10:28 22 U
69 16/01 05:59 25 M
63 16/01 06:50 20 F
65 28/01 22:31 20 U
84 28/01 23:25 22 F
86 29/01 01:23 18 F
68 29/01 01:32 23 F
62 29/01 02:55 24 F
81 29/01 04:15 19 F
67 03/02 08:16 19 M
87 03/02 08:34 25 F
71 03/02 09:02 23 M
76 03/02 09:03 19 U
72 03/02 09:40 20 F
77 03/02 09:41 20 U
70 03/02 09:42 21 M
66 03/02 09:45 20 M
79 03/02 09:47 20 U
64 03/02 09:54 21 M
73 03/02 09:59 20 M
[image:3.612.308.536.139.402.2]90 03/02 10:29 20 M
Table 1. Nototodarus gouldi. Details of tagged squid. Bold text indicates tags that were detected during the study. ML: mantle length (cm). Sex: male (M), female (F) or not deter-mined (U). Brackets indicate squid tagged and released
or a large number of observations at several receivers within a curtain. Visit event duration was the time between the first and last detection of a visit event, plus 1 min. This ensured that visit events of just 1 ob-servation had a duration of 1 min, the maximum possi-ble time between pulse transmissions. The distribution of visit event durations was highly skewed and could not be normalised by transformation, so the median and median absolute deviation (MAD) (Quinn & Keough 2002) were used as location and spread descriptors.
Time, distance and speed (rate of movement) were calculated for movements recorded between non-adjacent receivers. Time was the period between the last detection at one receiver and the first detection at the next non-adjacent receiver. Distance was mea-sured between the positions of the 2 relevant receivers (km and ML specific to the squid in question).
Associations between tagged squid were investi-gated by arranging all observations into time intervals of (1) 20 and (2) 60 min. Squid were considered to be associated with one another if detected at the same location within the same time interval (i.e. a paired or group detection).
RESULTS
Acoustic receivers and transmitters
Twenty-three Nototodarus gouldiwere tagged with transmitters and released over a 4 wk period between mid-January and early February 2003 (Table 1). All squid were released within the northern part of Storm Bay (between Curtains F, G and H), except for 2 that were released near the mouth of the
Derwent River, north of Curtain F. Of the tagged squid, 8 were female, 8 were male, and sex was not determined for 7. They ranged in size between 18 and 25 cm ML and all appeared to recover rapidly from the tagging proce-dure.
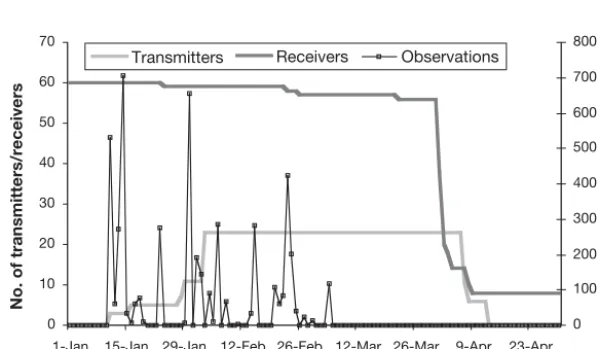
Two of the receivers in Curtain E and one in Array L were not recovered due to detachment from their moorings. Another receiver, in Curtain G, was recovered but had been irretrievably damaged, so effectively a maximum of 60 receivers were present at any stage during the study and this number declined as the study progressed (Fig. 2). One receiver had a memory failure while deployed (Curtain F), and for 2 others, the data did not download
completely after retrieval (Curtain G). Thus, the end date for these 3 receivers is not the retrieval date, but rather the date of the last recorded detection (F: 23 January, G: 22 January and 25 February).
Overlap of receiver ranges was evident for Curtains F, G and H, as some transmitter signals were detected at the same time at adjacent receivers within these curtains. Despite this, the loss and failure of receivers in Curtains E, F and G means they could not have full coverage for at least some of the study duration.
Detections
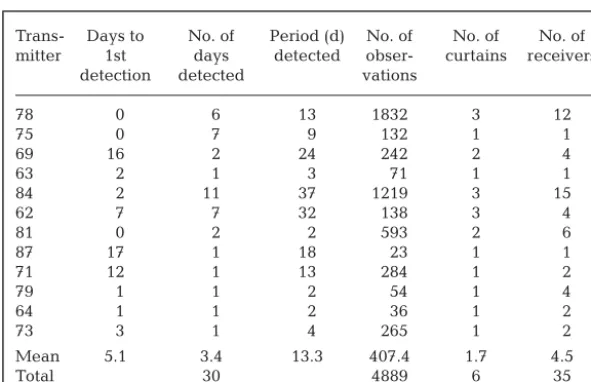
Twelve of the tagged squid (52%) were detected at least once during the study (Table 2). This group com-prised 5 females, 4 males and 3 of unknown sex. They ranged in size from 19 to 25 cm, thus reflecting the size structure and sex ratio of the tagged sample (see Table 1). Neither the release date nor the location of release appeared to have any bearing on whether a squid was detected or not.
Each of the 12 detected squid accounted for between 23 and 1832 observations (Table 2), representing between 1 and 24 visit events. Squid were first detected either on the day they were released or up to 17 d later (Table 2). The number of separate days on which individual squid were detected ranged between 1 and 11 d, over periods of 2 to 37 d (i.e. from the date of release to the date of last detection). There were no detections recorded after 5 March 2003 (Fig. 2), despite the fact that more than 50 receivers were present in the study area until the end of March and transmitter batteries should not have expired until early April.
0 10 20 30 40 50 60 70
1-Jan 15-Jan 29-Jan 12-Feb 26-Feb 12-Mar 26-Mar 9-Apr 23-Apr
Date
No. of transmitters/receivers
0 100 200 300 400 500 600 700 800
No. of observations
[image:4.612.240.540.526.700.2]Transmitters Receivers Observations
General movement patterns
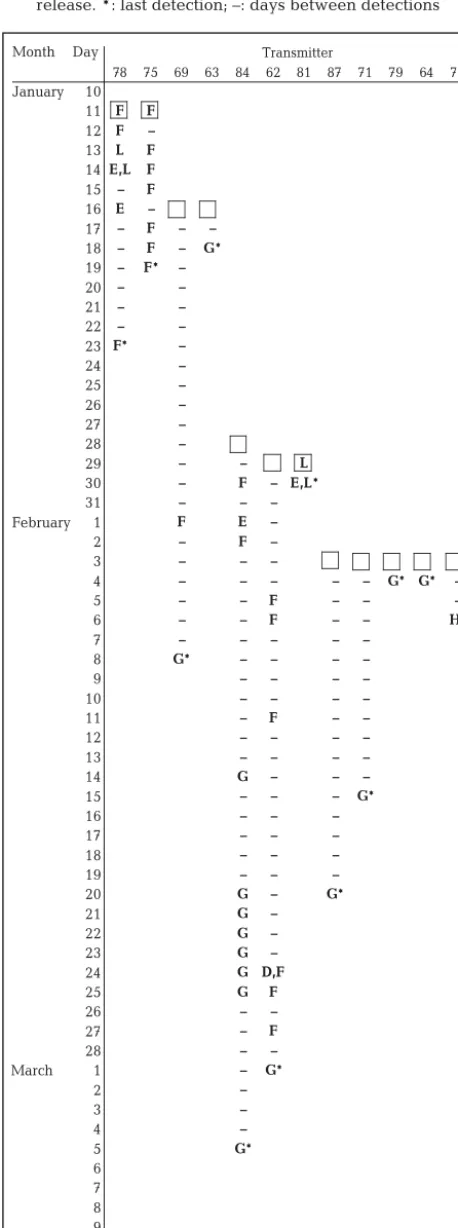
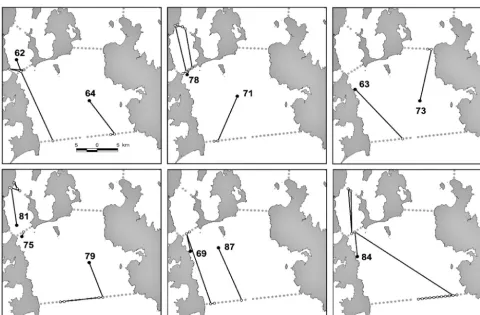
Of the 12 tracked squid, 8 were detected at least once at Curtain G at the entrance to Storm Bay, and for each of these squid, Curtain G was also the site of their final detection (Table 3, Fig. 3). There was no consistent pattern of movement by squid prior to their final detection at Curtain G. Five of the squid detected at Curtain G did not visit any other curtain (Transmitters 63, 64, 71, 79 and 87; Fig. 3). After being tagged, these 5 squid took between 1 and 17 d to travel to Curtain G, where they were detected on 1 d only, and never again. The other 3 squid detected at Curtain G (Transmitters 62, 69 and 84) first spent time around Curtains D, E, and F, arriving at Curtain G between 23 and 36 d after being tagged and released (Table 3). The date of final detection at Curtain G var-ied widely, ranging from 18 January to 5 March (Table 3).
Four transmitters were not detected at Curtain G at any stage; instead, these squid moved further inshore/ upstream from their tag and release point. Only one of these squid (Transmitter 81) did not at any stage move into Storm Bay; instead, all detections were recorded within the Derwent Estuary. Transmitter 73 was detected for the first and last time at Curtain H, and Transmitters 75 and 78 at Curtain F (Table 3, Fig. 3).
Only 1 squid (Transmitter 62) was detected at the entrance to the D’Entrecasteaux Channel (Curtain D). It was detected later that same day at Curtain F, sug-gesting that if it indeed had moved into the Channel, it did not travel far or spend long there. A squid detected
at Curtain H (Transmitter 73) was there for approximately 3.5 h, but as it was not detected again, it is impossi-ble to determine whether it continued into Frederick Henry Bay or moved back into Storm Bay.
Spatial usage
Tagged squid were detected at 6 of the 9 curtains (Table 4). There were no observations recorded at Curtains B, C or I, indicating that the tagged squid did not move down the D’Entre-casteaux Channel, or into Norfolk Bay. The 3 most visited curtains, in terms of number of tagged squid and number of observations, were G, F and E, which were also the curtains with the poorest coverage due to missing or failed re-ceivers (Table 4). Most squid vis-ited few receivers within a curtain (Table 2); however, the particular receivers visited var-ied among squid and thus, transmitters were detected at at least two-thirds of the active receivers within each curtain (excluding Curtains D and H which only de-tected 1 transmitter each; Table 4). Observations were recorded at receivers covering a wide range of depths (2 to > 50 m) and distances from the shoreline (0.6 to >10 km).
Receivers that recorded observations were generally spread across the curtains; however, the number of observations recorded and transmitters detected var-ied greatly among receivers within curtains. Two adja-cent receivers in both Curtains E and F recorded the most observations of all receivers, and several squid returned to these same receivers after spending time elsewhere (Fig. 3). The other active receivers in these curtains had comparatively few or no observations. There were no particular receivers that dominated Curtain G in terms of the number of observations recorded, although squid were not detected at the receivers closest to the shore of the Tasman Peninsula and Bruny Island.
Activity patterns
The duration of visit events was highly skewed, with 30% of visit events only 1 min in length (the minimum possible visit event duration by definition), and 70% less than 1 h. This suggests that squid were either often near the detection limit of receivers, or that they were passing through a narrow area of overlap. The longest Trans- Days to No. of Period (d) No. of No. of No. of
mitter 1st days detected obser- curtains receivers detection detected vations
78 0 6 13 1832 3 12
75 0 7 9 132 1 1
69 16 2 24 242 2 4
63 2 1 3 71 1 1
84 2 11 37 1219 3 15
62 7 7 32 138 3 4
81 0 2 2 593 2 6
87 17 1 18 23 1 1
71 12 1 13 284 1 2
79 1 1 2 54 1 4
64 1 1 2 36 1 2
73 3 1 4 265 1 2
Mean 5.1 3.4 13.3 407.4 1.7 4.5
[image:5.612.59.355.137.328.2]Total 30 4889 6 35
Table 2. Nototodarus gouldi. Details of detected transmitters: the number of days between release and 1st detection; the number of actual days on which each squid was detected; the number of days from release to last detection; the number of observations recorded; the number of curtains visited; and the
visit event was Transmitter 78 at Curtain F for 8.7 h. Curtain G and Array L both had a similar median visit event duration of just over 30 min, while the median for Curtains D and F was only around 17 min. Curtain E had a median of just 10.5 min, and for Curtain H there was only 1 visit event (Transmitter 73), 3.5 h long (Table 4).
Over all receivers in all curtains except Curtain G, 87% of visit events occurred in the first 10 d after an individual was tagged and released (Table 4). At Curtain G, however, the majority of transmitters were detected after at least 10 d at liberty, and these detec-tions tended to be towards the end of the study, regardless of the date of tag and release (Table 3). At Curtain G, 80% of visit events occurred more than 30 d after the start of the study.
The number of visit events detected varied through-out the day withthrough-out any clear pattern associated with photoperiod. The median duration per visit event, however, was highly variable after sunset and before sunrise (21:00 till 06:00 h) and relatively low during daylight hours (Fig. 4).
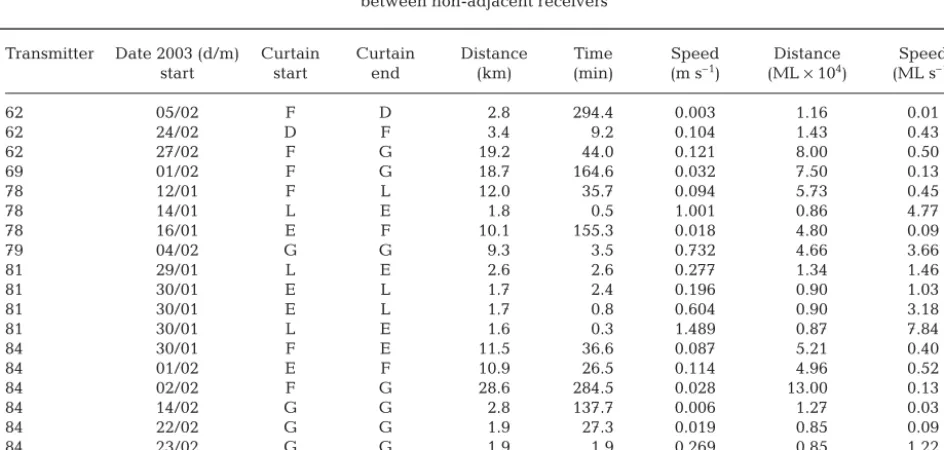
There were 19 trips between non-adjacent receivers by 6 of the detected squid. The longest distance trav-elled between consecutive receiver detections was 28.6 km, although half of the distances travelled were less than 3.5 km (Table 5). Sixty-eight percent of the trips were less than 2 d in duration, although they ranged up to 12.3 d. There was large variability in the calculated speed of straight-line travel, from 0.003 to 1.489 m s–1, or 0.01 to 7.84 ML s–1. Shorter distances had more variable speeds, while trips of 10 km or more never had speeds greater than 0.12 m s–1or 0.5 ML s–1 (Table 5).
Only 2 transmitters were detected at the same receiver within the same 20 min time interval. Trans-mitters 75 and 78 were both detected over a 2 h period at Curtain F, less than 1 h after being tagged. They both remained in the general area of Curtains E, F and Array L for a further 8 d; however, the only time during this period that they were both detected within the same 20 min time interval, they were at different cur-tains, at least 10 km apart (Table 3). No other pairs or groups of transmitters were detected at the same receiver in the same time interval, even when the time interval was increased to 60 min. However, Transmit-ters 64 and 79 were detected at different receivers in Curtain G on 4 February, the day after they were both tagged (Table 3). These 2 pairs of transmitters (75 and 78, and 64 and 79) were the only squid detected together throughout the study. In both cases, they were squid tagged and released together. Other groups of squid were tagged and released together but they were not detected during the study (e.g. Transmitters 68 and 86, Table 1).
Transmitter
Month Day
78 75 69 63 84 62 81 87 71 79 64 73
January 10
11 F F
12 F –
13 L F
14 E,L F
15 – F
16 E –
17 – F – –
18 – F – G*
19 – F* –
20 – –
21 – –
22 – –
23 F* –
24 –
25 –
26 –
27 –
28 –
29 – – L
30 – F – E,L*
31 – – –
February 1 F E –
2 – F –
3 – – –
4 – – – – – G* G* –
5 – – F – – –
6 – – F – – H*
7 – – – – –
8 G* – – – –
9 – – – –
10 – – – –
11 – F – –
12 – – – –
13 – – – –
14 G – – –
15 – – – G*
16 – – –
17 – – –
18 – – –
19 – – –
20 G – G*
21 G –
22 G –
23 G –
24 G D,F
25 G F
26 – –
27 – F
28 – –
March 1 – G*
2 –
3 –
4 –
5 G*
[image:6.612.59.288.107.721.2]6 7 8 9 10
Table 3. Nototodarus gouldi. Curtains at which each squid was detected, by date. Square box indicates date of tag and
DISCUSSION
A significant finding of this research relates to the im-plied movement of individuals away from the study area. Two-thirds of the tracked squid were last detected at Curtain G, across the entrance to
Storm Bay. Although the design of the receiver network precludes determi-nation of the movement direction (see below), the fact that receivers and transmitters were active for an exten-sive period after the final detections at Curtain G supports the notion that the squid moved out of the study area to other coastal or deeper shelf waters. It is possible that other tagged squid may have moved out of the study area with-out being detected. Three receivers failed while deployed within Curtain G and it is possible that gaps may have existed elsewhere. Without extensive range testing, we cannot be certain of the precise level of curtain coverage during the study. However, with an
[image:7.612.59.539.81.396.2]as-sumed detection range of 400 m, extrapolation of the numbers of squid observed moving through Curtain G to that expected with complete coverage would account for just 1 or 2 of the undetected squid. Those squid that were never detected most likely remained within the Fig. 3. Nototodarus gouldi. Movement tracks for the 12 detected squid. d: point of tag and release, number refers to the
transmit-ter number; s: receivers where the animal was detected; : the straight-line track between receivers. Grey circles are all
active receivers
Curtain Squid Obser- Receivers Coverage Visit Median visit
vations events event duration
B 0 0 0/4 1.00 0
C 0 0 0/3 1.00 0
D 1 18 1/2 1.00 2 0.28 (0.26)
E 3 880 2/3 0.62 11 0.18 (0.16)
F 5 1491 5/5 0.75–0.91 46 0.30 (0.28)
G 8 1534 18/24 0.76–0.83 30 0.53 (0.52)
H 1 265 2/8 0.87 1 3.54
I 0 0 0/4 0.91 0
L 2 701 7/7 7 0.58 (0.49)
Table 4. Nototodarus gouldi. For each curtain, the number of tagged squid (i.e. transmitters) detected, observations recorded, the number of receivers with observations/the maximum number of active receivers, the proportion of cover-age by the curtain (assuming a 400 m detection radius), the number of visit events and median visit duration (h), with median absolute deviation (MAD) in parentheses. The coverage for Curtains F and G is a range as some receivers did
[image:7.612.243.537.595.722.2]confines of Storm Bay, never moving into the detection range of Curtains F, H or G, or were subject to post-tagging mortality or tag loss.
It is difficult to interpret the relationship between individual movements out of the study area and the dynamics of the whole population as the year of the study was a poor one for Nototodarus gouldiin south-ern Tasmania. The available biomass was very low and as such, there was little commercial fishing, with catches of just 2 t taken in 2002/03, the lowest catch in 10 yr (Lyle 2003). Without commercial fishery or survey data, we cannot relate the observed movement pat-terns to the distribution and persistence of the popula-tion in Storm Bay over the study period. However, the timing of movement out of Storm Bay seen in this study is consistent with that evidenced by the fishery in pre-vious years (1998/99, 1999/00, 2000/01), for which con-siderable data are available (Willcox et al. 2001). In
general, commercial catches declined through Febru-ary, and were very small by March. The movement of tagged squid in our study suggests that this decline in catch may be consistent with squid leaving the Storm Bay area, with most tagged individuals moving to the outer curtain (G) during February.
Movement out of the study area was not in any way synchronous, with individuals apparently leaving over an extended time period, suggesting a dynamic popu-lation whose composition changes throughout the inshore summer season. Although the movement dynamics may differ during periods of high abundance (as the variables influencing the abundance may also affect the population level patterns of residency), the patterns seen during this study have important impli-cations from a fishery and ecosystem management perspective as it suggests that the decline in commer-cial catches in late summer is not entirely due to localised fishing effects, but is influenced by emigra-tion too. The complexity of separating the effects of migration from the effects of commercial catches adds to the difficulty of assessing the resource (Basson et al. 1996).
There was no evidence of tagged squid moving from Storm Bay or the Derwent Estuary into the D’Entre-casteaux Channel. Nototodarus gouldi are known to utilise the Channel, having been caught in large num-bers by recreational fishers in previous years (e.g. 1999/00; J. M. Lyle pers obs.), and the connectivity of these areas is of particular interest as the Channel is closed to commercial fishing and is perceived as a
0.00 0.05 0.10 0.15 0.20
0 2 4 6 8 10 12 14 16 18 20 22
Hour of day
Median visit event
[image:8.612.56.287.81.185.2]duration (d)
Fig. 4. Nototodarus gouldi. The median visit event duration (plus median absolute deviation) by hour of day
Transmitter Date 2003 (d/m) Curtain Curtain Distance Time Speed Distance Speed start start end (km) (min) (m s–1) (ML ×104) (ML s–1)
62 05/02 F D 2.8 294.4 0.003 1.16 0.01
62 24/02 D F 3.4 9.2 0.104 1.43 0.43
62 27/02 F G 19.2 44.0 0.121 8.00 0.50
69 01/02 F G 18.7 164.6 0.032 7.50 0.13
78 12/01 F L 12.0 35.7 0.094 5.73 0.45
78 14/01 L E 1.8 0.5 1.001 0.86 4.77
78 16/01 E F 10.1 155.3 0.018 4.80 0.09
79 04/02 G G 9.3 3.5 0.732 4.66 3.66
81 29/01 L E 2.6 2.6 0.277 1.34 1.46
81 30/01 E L 1.7 2.4 0.196 0.90 1.03
81 30/01 E L 1.7 0.8 0.604 0.90 3.18
81 30/01 L E 1.6 0.3 1.489 0.87 7.84
84 30/01 F E 11.5 36.6 0.087 5.21 0.40
84 01/02 E F 10.9 26.5 0.114 4.96 0.52
84 02/02 F G 28.6 284.5 0.028 13.00 0.13
84 14/02 G G 2.8 137.7 0.006 1.27 0.03
84 22/02 G G 1.9 27.3 0.019 0.85 0.09
84 23/02 G G 1.9 1.9 0.269 0.85 1.22
84 25/02 G G 8.4 185.0 0.013 3.81 0.06
Table 5. Nototodarus gouldi. The distance (km and mantle length, ML), time (min) and speed (m s–1and ML s–1) of travel recorded
[image:8.612.64.536.497.722.2]‘refuge’ area, particularly in years of high fishing intensity. Our data suggest that either there was lim-ited mixing of N. gouldibetween the Channel and its adjacent waters (the Derwent Estuary and Storm Bay), or that the mixing was primarily unidirectional, with the Channel acting as a passageway for squid into the adjacent inshore waters, but not vice versa. Alterna-tively, N. gouldimay not have utilised the Channel at all during the study. Unfortunately, we have no infor-mation on the availability of N. gouldiin the D’Entre-casteaux Channel during the study period, nor on the connectivity of these water bodies in years when the biomass was high. Again, it is feasible that factors influencing the low inshore biomass may have also affected the patterns of residency in the study area. The environmental and/or prey conditions may only have been suitable in some areas, and not in the Chan-nel during the study. Alternatively, it may be simply that sample sizes were insufficient to detect movement into all areas.
Nototodarus gouldimade use of a large part of the remaining study area, with several individuals moving extensively between curtains in the Derwent Estuary and Storm Bay. Some individual receivers in the lower Derwent Estuary region had notably more detections from more tagged squid, implying that they may have been within a passageway or frequently used route between the Derwent River and Storm Bay, or may have been desirable areas for other reasons, such as concentration of prey. These observations may have been influenced by the tag and release position, though it was noted that several individuals returned to these same receivers on multiple occasions. Further research coupling N. gouldi movement and spatial usage to small-scale environmental conditions, partic-ularly prey density (e.g. Reid & Hindell 2000, Heupel & Hueter 2002) would be of value, particularly if con-ducted over seasons of contrasting abundances.
Rates of movement varied greatly, particularly over short distances. Half the trips measured were less than 0.5 ML s–1 and approximately 80% were less than 1.5 ML s–1. In general, speeds greater than this (includ-ing the maximum calculated, 7.8 ML s–1) were be-tween receivers placed less than 2 km apart and were, therefore, greatly influenced by the fact that the calcu-lations do not take into account the detection radius of each receiver. If the detection radius is, for example, 500 m, the difference in the distance between the transmitters when detected and that estimated by receiver placements could be up to 1 km, which has significant influence on straight-line speeds calculated over short distances.
Rates of movement calculated over 10 km or more ranged from 0.09 to 0.52 ML s–1; however, there was 1 instance of an average speed of 3.6 ML s–1 over
9.3 km by Transmitter 79 moving between receivers G10 and G20. This movement was clearly not straight-line as the squid was not detected at the receivers in-between and is, therefore, a minimum. Maximum speeds of another ommastrephid squid, Omma-strephes bartramii, determined by active tracking, were only 0.5 ML s–1 while on spawning grounds (Nakamura 1993) and 0.8 ML s–1when migrating to the spawning grounds (Yoshida et al. 1990), whereas tag recapture studies of Todarodes pacificus recorded travelling at speeds of up to 2.14 m s–1 (Araya 1967 cited in Nagasawa et al. 1993). Assuming a maximum ML of 50 cm (Roper et al. 1984), this is equivalent to 4.3 ML s–1. High-speed travel is clearly feasible for squid, although actual swimming speed may be quite different to observed movement rates due to the influ-ence of water movements (e.g. currents). We also can-not rule out the fact that tagged squid may have been preyed upon, and the observed speeds were those of a larger predator not the squid.
Sonar and echo sounding surveys of Nototodarus gouldihave shown that they form dense aggregations close to the sea floor during the day and disperse throughout the water column at night (Evans 1986). However, on only 1 occasion in this study were more than 2 individuals caught at the same time and place. Either our catchability was extremely poor, or the squid were not forming large daytime aggregations in the study area; it may be that the numbers of N. gouldi during the study were below some ‘threshold’ for schooling behaviour. There was little evidence of positive association among individuals tagged and released together. Only a small number of individuals released in ‘groups’ were subsequently detected, and rarely together, except shortly after release. There was no evidence that they remained together further into the study. A lack of group fidelity throughout the study may be due to new aggregations being formed each day after nighttime dispersion. While it seems likely that squid might be found in the same region at the same time in response to external variables such as prey concentration, we would not necessarily expect them to move together over the course of the study. Sample sizes were simply too small and this study not designed to maximise information regarding such behavioural patterns; however, the potential of the automated VR2 system for elucidating school structure and behaviour is recognised.
1983, Nowara & Walker 1998). However, these results are confounded by the use of commercial jig boats with light attractants to obtain samples. Diurnal feeding behaviour is variable among other ommastrephid spe-cies, but it appears that they are active hunters during both the day and night, with several feeding peaks, depending on the diurnal behaviour of the prey (Haimovici et al. 1998, Quetglas et al. 1999, Lap-tikhovsky 2002). Variability in the duration of evening visits in this study might be explained by a combina-tion of periods of low activity as individuals remain in an area to feed or rest, set against short visit durations indicative of active movement into and out of the range of receivers, perhaps as the squid search for prey.
The use of the automated acoustic tracking system has provided new insight into the movement and activ-ity dynamics of the inshore Nototodarus gouldi popula-tion in southeastern Tasmania. Future research could benefit from larger samples sizes (feasible given the relatively low cost of transmitters compared to other electronic tag types), and being able to couple the indi-vidual movement data to population distribution and abundance data. The design of the receiver network in this study made it difficult to determine direction of movement, or indeed whether the tagged animal actu-ally crossed through a curtain, unless it was subse-quently detected at another curtain. In future studies, where understanding directionality is important, it could be more suitable to have double curtains, or to at least stagger the placement of receivers in a zigzag design along the line of the curtain. This would have the added benefit of reducing the size of gaps created by lost or failed receivers.
Acknowledgements. We thank all staff of the Tasmanian Aquaculture & Fisheries Institute and volunteers who assisted with fieldwork. In particular, we thank J. Semmens, J. Stark, S. Tracey, L. Triantafillos and the crew of the FRV ‘Chal-lenger’. Two anonymous reviewers provided comments that resulted in an improved manuscript. Financial support for the study was provided by grants from the Australian Research Council (Grant DP0210373 to G.D.J. and D. Welch), the Holsworth Wildlife Research Fund Postgraduate Award (Grant L0013234 to K.E.S.) and operational support from the Tasmanian Aquaculture & Fisheries Research Institute. This project was conducted with ethics approval (A0006997).
LITERATURE CITED
Aitken JP, O’Dor RK, Jackson GD (2005) The secret life of the giant cuttlefish Sepia apama (Cephalopoda): behaviour and energetics in nature revealed through radio acoustic positioning and telemetry (RAPT). J Exp Mar Biol Ecol 320:77–91
Arendt M, Lucy J, Munroe TA (2001) Seasonal occurrence and site-utilization patterns of adult tautog, Tautoga onitis
(Labridae), at manmade and natural structures in lower Chesapeake Bay. Fish B-NOAA 99:519–527
Arkhipkin A (2000) Intrapopulation structure of winter-spawned Argentine shortfin squid, Illex argentinus (Ce-phalopoda, Ommastrephidae), during its feeding period over the Patagonian Shelf. Fish B-NOAA 98:1–13 Basson M, Beddington JR, Crombie JA, Holden SJ, Purchase
LV, Tingley GA (1996) Assessment and management tech-niques for migratory annual squid stocks: the Illex argenti-nusfishery in the Southwest Atlantic as an example. Fish Res 28:3–27
Block BA, Dewar H, Blackwell SB, Williams T and 5 others (2001) Archival and pop-up satellite tagging of Atlantic bluefin tuna. In: Sibert JR, Nielsen JL (eds) Electronic tag-ging and tracking in marine fisheries. Kluwer Academic, Dordrecht, p 65–88
Brill R, Lutcavage M, Metzger G, Bushnell P, Arendt M, Lucy J, Watson C, Foley D (2002) Horizontal and vertical move-ments of juvenile bluefin tuna (Thunnus thynnus), in relation to oceanographic conditions of the western North Atlantic, determined with ultrasonic telemetry. Fish B-NOAA 100:155–167
Clementson LA, Harris GP, Griffiths FB, Rimmer DW (1989) Seasonal and interannual variability in chemical and bio-logical observations in Storm Bay Tasmania. I. Physics, chemistry and the biomass of components of the food chain. Aust J Mar Freshw Res 40:25–38
Comeau LA, Campana SE, Castonguay M (2002) Automated monitoring of a large-scale cod (Gadus morhua) migration in the open sea. Can J Fish Aquat Sci 59:1845–1850 Evans K (1986) Arrow squid behaviour and vulnerability to
netting techniques. Department of Sea Fisheries, Tasma-nia, Technical Report 12, Hobart
Haimovici M, Brunetti NE, Rodhouse PG, Csirke J, Leta RH (1998) Illex argentinus. In: Rodhouse PG, Dawe EG, O’Dor R (eds) Squid recruitment dynamics. FAO, Rome, p 27–58 Hatfield EMC, Rodhouse PG (1994) Migration as a source of bias in the measurement of cephalopod growth. Antarct Sci 6:179–184
Heupel MR, Hueter RE (2001) Use of an automated acoustic telemetry system to passively track juvenile blacktip shark movements. In: Sibert JR, Nielsen JL (eds) Electronic tag-ging and tracking in marine fisheries. Kluwer Academic, Dordrecht, p 217–236
Heupel MR, Hueter RE (2002) Importance of prey density in relation to the movement patterns of juvenile blacktip sharks (Carcharhinus limbatus) within a coastal nursery area. Mar Freshw Res 53:543–550
Hooge PN, Eichenlaub B (1997) Animal movement extension to ArcView. Ver 1.1. Alaska Biological Science Center, US Geological Survey, Anchorage, AK
Jackson GD, McGrath Steer B, Wotherspoon S, Hobday AJ (2003) Variation in age, growth and maturity in the Australian arrow squid Nototodarus gouldiover time and space — what is the pattern? Mar Ecol Prog Ser 264: 57–71
Klimley AP, Voegeli FA, Beavers SC, Le Boeuf BJ (1998) Auto-mated listening stations for tagged marine fishes. Mar Technol Soc J 32:94–101
Laptikhovsky V (2002) Diurnal feeding rhythm of the short-fin squid Illex argentinus (Cephalopoda: Ommastrephi-dae) in the Falkland waters. Fish Res 1373:1–5
Lyle JM (2003) Tasmanian scalefish fishery — 2002. TAFI fish-ery assessment report. Tasmanian Aquaculture & Fish-eries Institute, Hobart
Lynch AW (2004) Southern squid fishery data summary 2002–2003. Logbook Program, Australian Fisheries Man-agement Authority, Canberra
on the jumbo squid (Dosidicus gigas) in the Gulf of California, Mexico. Fish B-NOAA 103:219–226
McGrath BL, Jackson GD (2002) Egg production in the arrow squid Nototodarus gouldi (Cephalopoda: Ommastrephidae), fast and furious or slow and steady? Mar Biol 141:699–706 Mokrin NM, Novikov YV, Zuenko YI (2002) Seasonal migra-tions and oceanogaphic condimigra-tions for concentration of the Japanese flying squid (Todarodes pacificus Steenstrup, 1880) in the northwestern Japan Sea. Bull Mar Sci 71: 487–499
Moran MJ, Burton C, Jenke J (2003) Long-term movement patterns of continental shelf and inner gulf snapper (Pagrus auratus, Sparidae) from tagging in the Shark Bay region of Western Australia. Mar Freshw Res 54:913–922 Nagasawa K, Takayanagi S, Takami T (1993) Cephalopod tagging and marking in Japan: a review. In: Okutani T, O’Dor R, Kubodera T (eds) Recent advances in fisheries biology. Tokai University Press, Tokyo, p 313–329 Nakamura Y (1993) Vertical and horizontal movements of
mature females of Ommastrephes bartramiiobserved by ultrasonic telemetry. In: Okutani T, O’Dor R, Kubodera T (eds) Recent advances in fisheries biology. Tokai Univer-sity Press, Tokyo, p 331–336
Nigmatullin CM, Laptikhovsky VV, Moustahfid H (2002) Brief review on the ecology of arrow squid Todarodes sagittatus(Cephalopoda: Ommastrephidae). Bull Mar Sci 71:581–590
Nowara GB, Walker TI (1998) Effects of solar day, jigging method and jigging depth on catch rates and size of Gould’s squid, Nototodarus gouldi(McCoy), in southeast-ern Australian waters. Fish Res 34:279–288
O’Dor R (2002) Telemetered cephalopod energetics: swim-ming, soaring, and blimping. Integr Comp Biol 42: 1065–1070
O’Dor RK, Hoar JA, Webber DM, Carey FG, Tanaka S, Mar-tins HR, Porteiro FM (1994) Squid (Loligo forbesi) perfor-mance and metabolic rates in nature. Mar Freshw Behav Physiol 25:163–177
O’Sullivan D, Cullen JM (1983) Food of the Squid Nototodares gouldiin Bass Strait. Aust J Mar Freshw Res 34:261–285 Parsons DM, Babcock RC, Hankin RKS, Willis TJ, Aitken JP,
O’Dor RK, Jackson GD (2003) Snapper Pagrus auratus
(Sparidae) home range dynamics: acoustic tagging studies in a marine reserve. Mar Ecol Prog Ser 262:253–265 Perez JAA, O’Dor RK (1998) The impact of environmental
gradients on the early life inshore migration of the short-finned squid Illex illecebrosus. S Afr J Mar Sci 20:293–303 Quetglas A, Alemany F, Carbonell A, Merella P, Sanchez P (1999) Diet of the European flying squid Todarodes sagit-tatus(Cephalopoda: Ommastrephidae) in the Balearic Sea (western Mediterranean). J Mar Biol Assoc UK 79: 479–486
Quinn GP, Keough MJ (2002) Experimental design and data analysis for biologists. Cambridge University Press, Cambridge
Reid TA, Hindell MA (2000) Coarse-scale relationships between seabirds and zooplankton off south-eastern Tasmania. Mar Freshw Res 51:789–798
Roper CFE, Sweeney MJ, Nauen CE (1984) Cephalopods of the world, Vol 3. FAO, Rome
Sauer WHH, Roberts MJ, Lipinski MR, Smale MJ, Hanlon RT, Webber DM, O’Dor R (1997) Choreography of the squid’s ‘Nuptial Dance’. Biol Bull (Woods Hole) 192:203–207 Sauer WHH, Lipinski MR, Augustyn CJ (2000) Tag recapture
studies of the chokka squid Loligo vulgaris reynaudii
d’Orbigny, 1845 on inshore spawning grounds on the south-east coast of South Africa. Fish Res 45:283–289 Triantafillos L, Jackson GD, Adams M, McGrath Steer B
(2004) An allozyme investigation of the stock structure of arrow squid Nototodarus gouldi(Cephalopoda: Ommas-trephidae) from Australia. ICES J Mar Sci 61:829–835 Voegeli FA, Lacroix GL, Anderson JM (1998) Development of
miniature pingers for tracking Atlantic salmon smolts at sea. Hydrobiologia 371/372:35–46
Watanabe H, Kubodera T, Ichii T, Kawahara S (2004) Feeding habits of neon flying squid Ommastrephes bartramiiin the transitional region of the central North Pacific. Mar Ecol Prog Ser 266:173–184
Welch DW, Boehlert GW, Ward BR (2003) POST — the Pacific Ocean salmon tracking project. Oceanol Acta 25:243–253 Willcox S, Lyle J, Steer M (2001) Tasmanian arrow squid fishery — status report 2001. Tasmanian Aquaculture and Fisheries Institute, Hobart
Winstanley RH, Potter MA, Caton AE (1983) Australian cephalopod resources. Mem Natl Mus Vic 44:243–253 Yoshida M, Baba T, Kiyota M, Koido T (1990) Behavioural
study of flying squid by an ultrasonic telemetry. In: Japan-ese society of fisheries oceanography (ed) Abstracts of symposium of squid resources and its use. p 5–8 (in Japan-ese) (cited in Nakamura Y 1993)
Editorial responsibility: Otto Kinne (Editor-in-Chief), Oldendorf/Luhe, Germany