Misconceptions about marketing : a thesis presented in partial fulfilment of the requirements for the degree of Master of Business Studies in Marketing at Massey University
62
0
0
Full text
(2) MISCONCEPTIONS ABOUT MARKETING. A thesis presented in partial fulfilment of the requirements for the degree of Master of Business Studies in Marketing at Massey University. Yu Gu. 1998. 10 June, 1998.
(3) ABSTRACT. In recent years, many researchers have addressed the importance of developing empirical generalisations in marketing. A number of studies found that many marketing theories have not passed rigorous tests yet, but are widely accepted by marketing academics and practitioners.. This research was designed to survey marketing beliefs held by marketing academics and practitioners. Ten marketing generalisations that have not been proved by research were selected, and each of them was expressed into a short statement which particularly addressed the theoretical effect on business profitability. Respondents were asked to make their judgements on the statements. A total of ~~ondents participated in this survey, including 43 New Zealand university teachers, 24 New Zealand polytechnic teachers , 112 New Zealand managers, and 15 non-New Zealand marketing professionals.. Three important findings were reported: 1.) over two thirds of respondents chose wrong answers for more than half of the ten statements; 2.) academics made more accurate judgements than practitioners; and 3.) university teachers were not more accurate than polytechnic teachers judging the ten statements..
(4) ii. ACKNOWLEDGEMENTS. I would like to thank Zane Kearns and Don Esslemont, my supervisor and advisor, for showing me the importance of critical view of marketing theories. In this research I came to realise that marketing theories may not be obviously true. There are many studies with controversial findings towards marketing theories.. Zane Kearns initiated this research project and created a comfortable atmosphere to encourage me to develop the ability to solve a variety of problems. Don Esslemont devoted much of his time to this research, helping me to design the research plan and motivating me to learn more research techniques from this research. When I encountered problems during my research, they were always willing to reach their hands.. Thanks must also go to those marketing teachers and managers who participated in the survey and wrote many constructive suggestions. Without their contributions, it is impossible to complete this thesis..
(5) iii. TABLE OF CONTENTS. ABSTRACT ......... .. ... .. .... ..... . . ........... .. .. ... .... ... .... .. .... . .. .... .... ... .. .. .. ...... ..... ........ .... . .......... i ACKNO~VLEDGElv!.E'VTS .... . .... .. ... ...... .......... .. ................................ ... ............................... ii. T ABLE OF CONTENTS ........ ... . ........ .... ... .. .. .... .......... ... ...... ... ..... .. ....... ... ... .... ... ............... iii. LIST OF TABLES ........ ........ ... .. ....................................................................................... v. CHAPTER ONE. INTRODUCTION ........ ... .. ... ... .... ... ........... .... .... .... .............. ...... ... .... 7. CHAPTER Two. B ACKGROUND ... ............ ....................... .. .......... ...... ...... ............... 8. 2. 1 Predictive Value of Consumer Behaviour Theories ... .. .......................................... .. ...... 9 2. 2 Practical Value of Principles in Marketing Textbooks ....................... .......... ......... .. ..... 10 2. 3 Repiication and Extension of Findings in Marketing Journals ............ .............. .. .......... 11 CHAPTER THREE. ~v.IETHOD ............ .. ........................ .................. .... ... .. ... ... .... .. .... 12. 3. 1. Selection c t' Studie~ ........... .... .. .............. ..... ........ .. .. .............................................. .. . 12. 3. 2. Questionnaire Design ............ .. ................... .... ...... .. ... ........ ...................................... 13. 3. 2. Research Hypotheses .............. ....... ...... ......... ............. .. ... .. ....... .. ....... ... ... ............... 15. 3. 4. San1pling Procedure .. .. ..... .. .. ............. .. ........ ....... .......... .. ... ... ...... .... ... .... ........... .. ..... 15. 3. 4. 1. New Zealand Marketing Academics ... .... ....... .................. .. .... .... ............ ..... .... .. 15. 3. 4 . 2. New Ze".land Marketing P ractitioners .... ............ .............. ....... .. ....................... 16. 3. 4 . 3. International Marketing Academics and Practitioners .... .............. .. ................... 17. CHAPTER } ' OUR. LITERATURE REVIEW ..... ..... .. .. ... ............... .. ............... ... ..... ..... 18. 4. 1. Customer Needs ....... ....... .................... ..... ... ... .... .... .. .......... ..... ... ........ .... ..... ......... . 19. 4. 2. B ackground Research .... ..... ....... .. ..... ........ ... .... ....................... .... ..... ..................... 22. 4. 3. Formal Strategic Planning ... .. ... ............. ......... ............................... ... .............. .... .. 24. 4. 4. The BCG Matrix ............ ..... .... ............ .. ... ...... .. ..... .. ......... .. .............. .................. .. 26. 4. 5. Market Share and Profitabiiity .................... ............ ...... .. ............. ......................... 28. 4. 6. Brand Loyalty ....................................................................................................... 30. cY. Consumer Attitudes and Behaviour .. ..................................................................... 32. 4. 8. Advertising Effective Frequency .... ............ .. .... .......... ... .............. .... ...... .... ............. 34. 4. 9. Service Quality ....... .... ....... ................ .............. ........... .. .. .. ...... .................. ...... .... .. 36. 4. 10. Market Segmentation ....... .. .... .. .. .... ....... .. .... ......... .... ..... ...................... .. ......... ....... 37.
(6) IV. CHAPTER FIVE. RESULTS ............................. ........ ........................ ................ ....... 38. 5. 1 Profile of Respondents ...... ..................................... ... .............................................. 38 5. 2. Overall Marketing Beliefs among Academics and Practitioners ................................ 40. 5. 3. Difference of Marketing Beliefs between Academics and Practitioners .................... .41. 5. 4. Difference of Marketing Beliefs across Different Groups of Respondents ................ .44. 5. 5. Association between Research Part and Curricula/Business Part Statements ............ 46. CHAPTER SIX. DISCUSSION ............ ... ..... ..... ...... ........... ............ ... ......... ....... .... .. . 48. 6. 1 A Large Proportion of Wrong Choices ...................................... .. ............................. 48 6. 2 Judgements of Academics More Accurate than Those of Practitioners .............. ...... .. .49 6. 3 Judgements of Polytechnic Teachers More Accurate than Those of University Teachers .............................................. ....... .... .. .. ................. ................... 50 CONCLUSION .......................................................................... 51. APPENDICES ... .. ..... ...... ... ..... ....... ....... .. .... .. ......... .... ... ....... .. ..................................... 52. CHAPTER SEVEN. Appendix A Questionnaire ........................ ...... ............................... ...... .... ............... 52 Appendix B Illustration of Detailed Data ......................... ........ ........ .. ...................... 55 REFERENCES ... ............. ..... ........... .... ....................... ...................... ......... ... .. .. .... ..... 57.
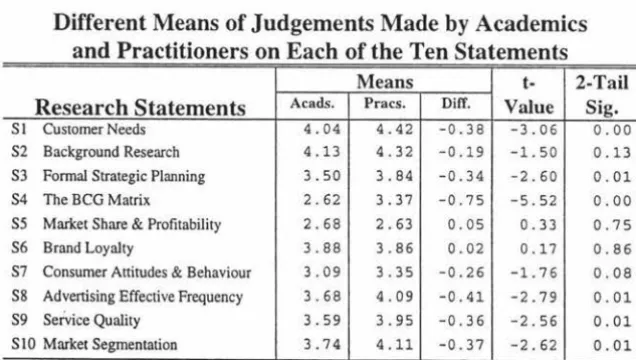
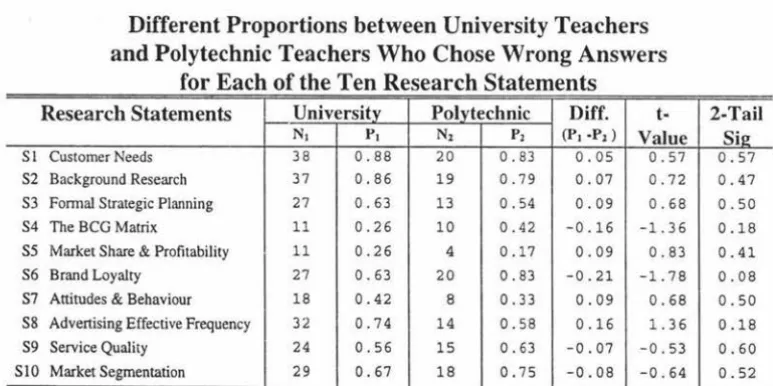
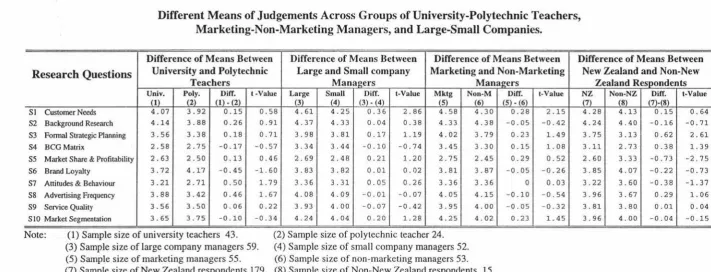
(7) v. LIST OF TABLES. 1. Table 3.1 Ten Research Statements ...... ...... .. .. ... ................. ... ....... .... .. ..... ....... 14. 2. Table 4.1 Results of Empirical Studies ... ....... .... ................ ..... .............. .. .. ...... . 18. 3. Tabie 5.1 Profile of Respondents .. ...... ... .. ..... ... ......... .................. ................. ... 38. 4. Table 5.2 Number of Wrong Answers Chosen by the Respondents .... .. ... ....... .40. 5. Table 5.3 Proportion of Respondents Who Chose Wrong Answers for Each of the Ten Research Statements ........................ .. ............................. .. 41. 6. Table 5.4 Number of Wrong Answers Chosen by Academics and Practitioners ... ...... .. .. ........... ....... .. .... ......... .... .. .. ................... .......... .... .. .... ... .... 42. 7. Table 5.5 Different Proportions between Academics and Practitioners Who Chose Wrong Answers for Each of the Ten Research Statements ............ 43. 8. Table 5.6 Different Means of Judgements Made by Academics and Practitioners on Each of the Ten Statements ..................................................... 43. 9. Table 5.7 Different Means of Judgements Across Groups of University-Polytechnic Teachers, Marketing-Non-Marketing Managers, and Large-Small Companies ............................................. ............... 47. 10. Table 5.8 Number of Wrong Answers Chosen by University Teachers and Polytechnic Teachers ..................................... .. ...... ...... .... ... .... .... 45. 11. Table 5.9 Different Proportions between University Teachers and Polytechnic Teachers Who Chose Wrong Answers for Each of the Ten Statements ............................................ ...... .................................... 45.
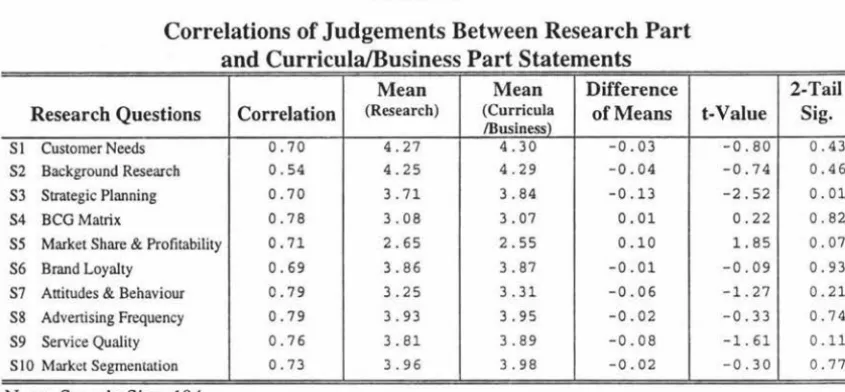
(8) vi. 12. Table 5.10 Correlations of Judgements between Research Part and Curricula/Business Part Statements .... .............. .............. ........ ................... 46.
(9) 7. CHAPTER ONE. INTRODUCTION. The objective of this thesis is to investigate the extent to which a variety of marketing generalisations, have not been empirically established, are accepted by marketing academics and practitioners. In recent years, many researchers have addressed the importance of development of empirical generalisations in marketing. However, a number of studies found that many marketing theories included in marketing textbooks and taught in marketing courses have not been subjected to rigorous empirical tests (Jacoby 1978, Armstrong and Schultz 1993, Ehrenberg and Bound 1993, Hubbard 1994, Hubbard and Annstrong 1994, and Armstrong 1996, etc.).. These studies have pointed out an inconsistency or a gap between marketing theories in textbooks and research journals. Marketing theories are often described in textbooks with little reference to the results of empirical studies published in research journals. As a result, on the one hand, some of marketing theories have been proved to be false by research. On the other hand, dissemination of these research results among marketing academics and practitioners suffered from extensive time lags. It is necessary to conduct a survey to find out those marketing theories which have been uncritically accepted. This research may help to draw academics and practitioners' attention to the erroneous beliefs in marketing.. In Chapter Two three important studies carried out to evaluate progress of empirical generalisations in marketing are examined. Based on these studies, the methodology used in this research is formulated in Chapter Three. Chapter Four presents a literature review which provides empirical evidence to support that none of the marketing theories included in this research has been well established. The results are given in Chapter Five, and then discussed in Chapter Six. Conclusions are presented in Chapter Seven. The questionnaire is provided in Appendix A. AppendixB.. Finally, detailed data is provided in.
(10) 8. CHAPTER TWO. BACKGROUND. Marketing theories have been extensively criticised. For instance, Leone and Schultz (1980) summarised the state of marketing knowledge, saying "this body of knowledge, method and their theory is, unfortunately, meagre, ill defined, and, interestingly enough, unappreciated." Traditionally, various theories of marketing have been developed with little reliance on empirical evidence. Some of them, for instance, the concept of customer needs, were put forward as a tautological argument that was unfalsifiable in principle, and therefore, had no practical and predictive value. Other marketing theories were merely based on researchers' brilliant speculations, intuitional beliefs, or folkloric ideas, which were subjected to the empirical tests before they could enter the body of scientific knowledge of marketing (Armstrong 1996).. In recent years, an increasing amount of attention has been devoted to the development. of empirical generalisations in marketing. Many researchers have addressed the importance of establishment of the rigorous procedure to systematically examine empirical findings in marketing research (Jacoby 1978, Armstrong and Schultz 1993, Ehrenberg and Bound 1993, Hubbard 1994, Hubbard and Armstrong 1994, Bass 1995, and Amstrong 1996, etc.) . The proposed procedure by various researchers for assessment of progress in marketing knowledge can be summarised into three important criteria: 1.) ensuring falsifiability and theoretical competition, 2.) overcoming uncertainty through replication, and 3.) using extension to develop generalisations and identify boundary conditions (Wright and Kearns 1998).. A number of studies have been carried out to assess progress in developing empirical theories of marketing (Leone and Schultz 1980, Armstrong 1991, Armstrong and Schultz 1993, Hubbard and Armstrong 1994, Bass 1995, Ehrenberg 1995, and Barwise 1995, etc.). For instance, Bass and Wind (1995) initiated a conference for assessment of empirical generalisations in marketing at Wharton School, University of Pennsylvania. A total of 22 papers participated in this conference have been published in a special issue of.
(11) 9. Marketing Science in 1995. Three important studies in this area are briefly examined in the following sections, which outline the background of this research.. 2. 1 PREDICTIVE VALUE OF CONSUMER BEHAVIOUR THEORIES. Armstrong (199i) conducted a study to test the predictive value of scientific knowledge of consumer behaviour. He selected 20 empirical studies from Journal of Consumer Research that tested at least one hypothesis. A total of 105 hypotheses were identified from the 20 studies. The hypotheses were kept in their original wordings, but each study was summarised into two pages.. The respondents for his study were academics, practitioners and novices. He assumed that these three groups of respondents had varying knowledge of, and ability to predict, consumer behaviour. Two hypotheses about consumer behaviour predictions were formulated:. Hl: Experts can make more accurate predictions than novices. H2: Academics can make more accurate predictions than practitioners.. Academics were selected from the members of the Association for Consumer Research. Practitioners were selected from members of American Marketing Association who were not in the academic category. Tenth- and eleventh-grade (equivalent to sixth- and seventh-form in New Zealand) students in a high school were selected to represent novices. Each respondent received five of the 20 studies.. The results of this research indicated that the experts (academics and practitioners) did not make more accurate predictions, and academics were not more accurate than practitioners. None of the respondent groups performed better than chance. The academics did significantly worse than chance..
(12) 10. 2. 2. PRACTICAL VALUE OF PRINCIPLES IN MARKETING TEXTBOOKS. Armstrong and Schultz ( 1993) conducted a survey of nine representative marketing textbooks published between early 1930s and late 1980s. From the textbooks, they first identified 556 principles that told managers what must be done or should be done in given types of situations. When looking for the practical value and predictive value of the 556 principles, however, they found that only 20 principles were "meaningful", that is, they provided clear guidelines for decision making or action in specified conditions.. At the second step of this research, when looking for empirical evidence to support these principles, they found that the textbooks did not provide empirical support for any of the 566 principles. Considering the possibility that the principles may be supported by evidence that is not presented in the textbooks, then, they presented the 20 meaningful principles to a group of marketing professors, and asked them whether they thought the principles were correct, and whether they were aware of any evidence supporting the principles. Two sets of the 20 principles were prepared. Each set contained half of the items with the original wording and the other half with reversed wording.. The results of the professors' response to the correctness of the 20 principles showed that the original wording was judged to be substantially more correct than the reversed wording for 12 principles. For three principles, the reversed wording was judged to be more correct than the original. On the other hand, the results of professors' ratings on evidence showed that of the ten correct principles, evidence was available for only two. Only one principle was judged to be correct, supported by evidence, and useful by all the professors..
(13) 11. 2. 3. REPLICATION AND EXTENSION OF FINDINGS IN MARKETING JOURNALS. Hubbard and Armstrong ( 1994) argued that publication of replication with extension would help to protect the literature from the uncritical acceptance and dissemination of erroneous and questionable results. They claimed that marketing theory construction is over dependent on uncorroborated, exploratory-empirical studies. To support their claim, Hubbard and Armstrong conducted a large scale survey of marketing literature published in the Journal of Marketing, Journal of Marketing Research, and Journal of Consumer Research over the period 1974-1989.. From the above three journals, they selected 835 empirical papers. The results of this survey indicated three important findings. The first is that of the 835 empirical papers, only 20 papers did some replications, but none of them was a straight replication. The second finding is that of the 20 replications, 15 per cent confirmed earlier results, 25 per cent provided some support, and 60 per cent conflicted with their predecessors. The third finding is that marketing replication and extensions suffered from extensive time lags.. Hubbard and Armstrong questioned the present journal editorial policies that obstructed publication of replications and extensions in marketing. Editors and reviewers of academic journals would like to accept papers when the findings agreed with their existing beliefs. Papers with highly significant results favouring their beliefs would be more likely to be published. They suggested editorial policies should be modified to allow more replications and extensions, particularly, failed replications and controversial findings that challenge existing theories, to be published..
(14) 12. CHAPTER THREE. METHOD. This chapter describes the research method used in this research. The first two sections describe the scope of studies and the questionnaire design. The research hypotheses are given in the third section. The last section presents the sampling procedure.. 3. 1. SELECTION OF STUDIES. The present research intended to integrate the merits of the three studies discussed in the previous chapter. However, the research was extended to investigate several marketing theories that have been widely taught in marketing courses and used in the business world, but have not been proved by research. Some of them, for instance, the BCG matrix and brand loyalty, have been proved to be false by empirical studies (Armstrong and Brodie 1994; Ehrenberg and Bound 1993 ). The truth or falsity of the others has not been established empirically.. The selected theories covered ten different areas of marketing research: 1.) customer needs, 2.) background research, 3.) formal strategic planing, 4.) the BCG matrix, 5.) market share and profitability, 6.) brand loyalty, 7 .) consumer attitudes and behaviour, 8.) advertising effective frequency, 9.) service quality, and 10.) market segmentation.. The theories selected from these ten areas were each expressed in a short statement which particularly addressed the theoretical effect on business profitability. Respondents were asked to make their judgements on the statements. The ten research statements were examined and refined by a group of senior teaching staff at the Department of Marketing, Massey University..
(15) 13. 3. 2. QUESTIONNAIRE DESIGN. The questionnaire contained the same ten statements jn two parts. Respondents were asked to identify their agreement with each of the ten statements on both sides, that is, whether it has been proved by research, and whether it should be included in curricula or should be used to guide business practice.. The adoption of the two-part questionnaire design in this research was to reduce the chance that the majority of the respondents would choose uncertainty when they were not sure how many empirical studies have been done in the ten selected research areas.. The degree of agreement with each statement was measured in a 5-point scale, ranging from "strongly agree" to "strongly disagree" with a rruddle point labelled "not sure".. Table 3.1 illustrates the ten research statements. A complete set of questionnaires is provided in Appendix A..
(16) 14. Table 3.1 Ten Research Statements. No. Research Topics. S1. Customer Needs. Companies that put a lot of effort into finding out what their customers' needs are, tend to be more profitable .. S2. Background Research. Companies should conduct background research to make sure they understand their customers properly before they start to design marketing programmes.. S3. Formal Strategic Planning. Companies that make formal strategic plans are, on average, more profitable than companies that do not.. S4. The BCG Matrix. Using the BCG matrix which classifies products or firms by market share and rate of market growth to make investment decisions is an effective way to increase the chance of making optimal investment decisions.. SS. Market Share & Profitability. Companies with large market share are usually much more profitable than firms with small market share.. S6. Brand Loyalty. There is no point in trying to develop loyalty to a small brand: brand loyalty is usually greater for brands with a large market share than for brands with a small market share.. S7. Consumer Attitudes & Behaviour. An effective way to increase sales is to use advertising to change the attitudes of potential customers.. S8. Advertising Effective Frequency. To be effective, an advertisement has to be exposed to its audience more than once.. S9. Service Quality. Companies with high scores on service quality measures are, other things being equal, more profitable than firms with low scores.. Market Segmentation. Companies that divide potential customers into segments, and concentrate on marketing to a target segment, are much more likely to be profitable than firms that just try to achieve the best overall results.. SlO. Research Statements.
(17) 15. 3. 3. RESEARCH HYPOTHESES. The first step of this research was to investigate how many academics and practitioners are aware that the ten research statements have not been well established by research.. The second step was to test the difference of performances between academics and practitioners. It was expected that academics could make more accurate judgements on the ten statements than practitioners because academics would be more aware about the scientific content of theories. On the other hand, marketing practitioners are not likely to be as familiar with this scientific literature as marketing academics. They mainly obtain marketing knowledge through their own experiences and informal reading although some may have formal marketing education or training.. Finally, the respondents' judgements should be consistent of each of the ten statements in the two parts. That is, if respondents agree that a statement has been proved by research, they must agree that it should be included in curricula, or used to guide business practice, and vice versa.. 3. 4. SAMPLING PROCEDURE. Respondents for this survey were marketing teachers at New Zealand universities and polytechnics, business managers at New Zealand companies, and members of Institute for Operations Research and the Management Sciences (INFORMS).. 3. 4.1. NEW ZEALAND MARKETING ACADEMICS. The New Zealand academics in this survey were all marketing teachers at tertiary institutions other than Massey University. In New Zealand, all the six universities are offering marketing papers for either undergraduate or post-graduate programme, but.
(18) 16. only 19 out of 25 polytechnics are offering marketing papers for the New Zealand National Diploma Programme of Business Studies (NZDipBus).. A total of 79 university marketing teachers were identified from the 1998 university calendars, and 41 marketing teachers were identified from the directory of polytechnic lecturers of the New Zealand National Diploma Programme of Business Studies, a database provided by Manawatu Polytechnic.. A copy of the questionnaire, together with a covering letter and a reply-paid return envelope, was mailed to each of the 120 marketing teachers. A follow-up letter was sent two weeks later. A total of 6 uncompleted questionnaires were returned because of incorrect addresses, and 4 teachers refused to participate in this survey, resulting in an effective base of 114. A total of 67 responses were obtained, 43 from university teachers and 24 from polytechnic teachers, a response rate of 59 per cent.. 3. 4. 2. NEW ZEALAND MARKETING PRACTITIONERS. In the sample of marketing practitioners, 40 marketing managers were drawn from the NZSE 40 companies, and 165 business managers were randomly drawn from the directory of New Zealand Business Who's Who. The combined sample size was 205.. The selection of NZSE 40 companies in this sample was based on the situation that the majority of New Zealand companies were very small. For the small companies, they might not have qualified marketing professionals. Further, a larger sample size was used in case of the occurrence of a lower response rate for marketing practitioners. Unlike. academics, business managers might not have interests in testing theories.. A copy of the questionnaire together with a cover letter addressed to marketing manager and a reply-paid return envelope, was mailed to each of the 205 managers. A follow-up letter was sent two weeks later. A total of 19 uncompleted questionnaires were returned because of incorrect addresses, and 7 managers refused to participate in this survey, resulting in an effective base of 186. A total of 112 responses were obtained, 20 from.
(19) 17. managers of NZSE 40 companies and 92 from managers of other companies, a response rate of 60 per cent. The response rate for marketing practitioners was as high as that for marketing academics, which reflected that marketing practitioners in this survey also had strong interests in the ten selected marketing theories.. 3. 4. 3. INTERNATIONAL MARKETING ACADEMICS AND PRACTITIONERS. The sample of marketing academics and practitioners outside New Zealand was randomly drawn from the directory of INFORJv1S membership. New Zealand members and members without an e-mail address were excluded from the sample. The sample size was 200, and e-mail survey was used to collect date. A copy of questionnaire together with a personalised message was sent to each of the 200 individuals via e-mail. A followup message was sent two weeks later. A total of 28 individuals could not be reached because of invalid e-mail addresses, and 4 individuals refused to participate in this survey, resulting in an effective base of 172. Only 15 responses were received, a response rate of 9 per cent..
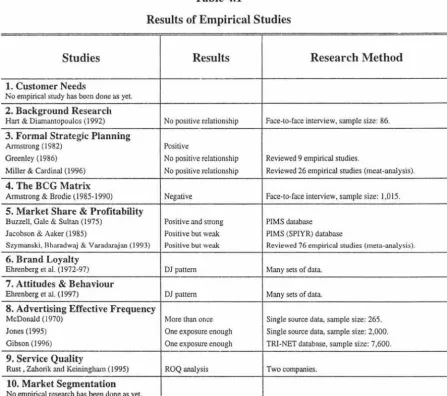
(20) 18. CHAPTER FOUR. LITERATURE REVIEW. This chapter presents the results of empirical studies associated with each of the ten research statements. This literature review mainly concentrates on searching for empirical evidence to demonstrate a clear relationship between each of the proposed theories (for instance, customer needs, market segmentation, or BCG matrix, etc.) and its effects on business performance. The results of these empirical studies are outlined in Table 4.1.. Table 4.1. Results of Empirical Studies Studies. Results. Research Method. 1. Customer Needs No empirical srudy has been done as yet.. 2. Background Research Hart & Diamantopoulcs (1992). No positive relationship. Face-to-face interview, sample size: 86.. 3. Formal Strategic Planning Armstrong (1982). Positive. Greenley (1986). No positive relationship. Reviewed 9 empirical studies.. Miller & Cardinal (1996). No positive relationship. Reviewed 26 empirical studies (meat-analysis).. Negative. Face-to-face interview, sample size: 1,015.. 4. The BCG Matrix Armstrong & Brodie (1985-1990). 5. Market Share & Profitability Buzzell, Gale & Sultan (1975). Positive and strong. PIMS database. Jacobson & Aaker (1985). Positive but weak. PIMS (SPIYR) database. Szymanski , Rharadwaj & Varadarajan (1993). Positive but weak. Reviewed 76 empirical studies (meta-analysis).. DJ pattern. Many sets of data.. DJ pattern. Many sets of data. Single source data, sample size: 265.. 6. Brand Loyalty Ehrenberg et al. ( 1972-97). 7. Attitudes & Behaviour Ehrenberg et al. (1997). 8. Advertising Effective Frequency McDonald (1970). More than once. Jones (1995). One exposure enough. Single source data, sample size: 2,000.. Gibson (1996). One exposure enough. TRI-NET database, sample size: 7,600.. ROQ analysis. Two companies.. 9. Service Quality Rust, Zahorik and Keiningham (1 995). 10. Market Segmentation No empirical research has been done as yet..
(21) 19. ll4.. 1. CUSTOMER NEEDS. Statement J:. Research has proved that companies that put a lot of effort into finding out what their customers' needs are, tend to be more profitable.. The marketing concept was first introduced to the business world by the General Electric Company in early 1950s, ar.d widely adopted as a philosophy of business management (Barksdale and Darden 1971). The concept was so simple and so basic it was unarguable in principle. That is, the only way that a company can achieve success is to find out its customers' needs , and then to produce goods or provide services to satisfy their needs. On the other hand, if a company can not find out and satisfy its customers' needs, it must fail. Obviously, the marketing concept in this sense is a logically true statement.. This concept, however, does not provide any practical guide for ensuring business success unless it can be expressed as a statement that can be established by an appeal to empirical evidence. Over more than forty yea.rs, very little research has been conducted to investigate the empirical statement. The questions raised by individual researchers to argue whether the marketing concept works as well in actual practice as its advocates promise have been largely ignored, and the basic issue has not been explored in any detail.. In recent years, there has been a strong resurgence of academic as well as practitioner interest in the marketing concept and its assumed positive relationship with company performance. They expected "the concept to have a clear meaning, a rich tradition of theory development, and a related body of empirical findings" (Kohli and Jaworski 1990). To achieve this goal, they set up a research procedure to develop a valid instrument that could be used to measure the marketing concept, or they called "marketing orientation", and then, related it to business perform.a.nee. As a result, a variety of measures of "marketing orientation" have been developed by different researchers (Kotler 1977, Narver and Slater 1990, Jaworski and Kohli 1990, Kohli and.
(22) 20. Jaworski 1993, Deshpande, Farley and Webster 1993, Liu and Davies 1997), but each of them has been associated with different contents, components, or attributes of business activities.. For instance, Kotler ( 1977) proposed that marketing orientation should be measured as a combination of five important components: 1.) consumer philosophy, 2.) integrated marketing organisation, 3.) adequate marketing information, 4.) strategic orientation, and 5.) operational efficiency. Kohli and Jaworski (1990), on the other hand, argued that marketing orientation should include three different components: 1.) organisation-wide generation of market intelligence, 2.) dissemination of the intelligence across departments, and 3.) organisation-wide responsiveness to it. Narver and Slater (1990) suggested that marketing orientation should be regarded as composed of three other components: 1.) a customer orientation, 2.) a competitor orientation, and 3.) their interfunctional co-ordination. Although their measures were rather different, they all claimed that their measures were able to predict business performance.. However, although a variety of operational measures of "marketing orientation" have been developed, and each of them has been successfully related to a positive effect on business performance, none of them was relevant to the central point of the statement tested in the present research, that is, understanding customer needs. For instance, Jaworski and Kohli developed 25 items to aggregate their marketing variable. However, none of the 25 questions in their questionnajre was designed to ask about business activities involved in investigating or satisfying customer needs . Nor was there in Kotler' s and N arver and Slater's questionnaires. Therefore, the recent studies did not provide any piece of evidence to support the statement tested in the present research. Little progress has been made in this area.. N arver and Slater ( 1990) conducted a study to test the effect of their measure on business performance. Data was collected from 140 business units of a major US forest corporation. A total of 15 items (questions) were developed and lumped together to measure the variable of "marketing orientation". Business performance was measured in return on assets (ROA). Eight extraneous variables likely to affect business performance.
(23) 21. were identified and combined together with the marketing variable into a multiple regression equation. They reported that a substantial positive effect of their measure on business profitability has been found.. Kohli and Jaworski (1993) carried out another study to test the effect of their measure on business performance. Data was collected from the member companies of the Marketing Science Institute, the top 1000 companies list in the Dun and Bradstreet Million Dollar Directory, and 500 members of the American Marketing Association. A total of 25 items were developed and lumped together to measure the marketing variables. Business performance was measured in respondent's subjective judgement and market share. Six extraneous variables were identified and combined together with the marketing variable into a multiple regression equation. They reported a robust linkage between their measure and business performance.. Unfortunately, a number of new studies failed to replicate their predecessors' findings. For instance, Esslemont and Lewis ( 1991) published the results of three small studies carried out at Massey University to test the effect of Kotler' s measure on business performance, and reported that "the results failed to demonstrate any clear association between marketing orientation and success." Au and Tse (1995) conducted another study to test the effects of Kotler' s measure on hotel performance in Hong Kong and New Zealand, and found only a weak and insignificant correlation between Kotler' s measure and hotel performance. Greenley (1995) replicated Narver and Slater's study in British companies using the same measure and the same method of data analysis. He did not find a direct relationship between N arver and Slater's measure and business performance.. In summary, although an overwhelming majority of researchers agreed that the marketing concept is a cornerstone of the marketing discipline, very little attention has been given to its implementation. There is no inventory of empirical generalisations in this area as yet. Numerous researchers attempted to develop an operational instrument for measuring the marketing concept. However, this effort has shown only limited progress towards proving the theory that understanding customer needs will contribute.
(24) 22. to improvement of business performance. The present status of research in this area is, as Jacoby (1978) pointed out, that "the failure to use existing models and theories has not discouraged some from proposing new models and theories , thereby generating a different kind of problem." The recent empirical studies resulted in a proliferation of erroneous measures of "marketing orientation" in marketing literature.. 4. 2. BACKGROUND RESEARCH. Statement 2:. Research has proved that companies should conduct background research to make sure they understand their customers properly before they start to design marketing programmes.. As discussed in the former section, marketing concept was developed based on a simple logical argument. That is, a company's success depends on whether it can satisfy its customers' needs. Obviously, a possible instrument which can help managers to investigate their customers' needs is marketing research. There is almost universal acceptance that marketing research acts a vital role in implementing the marketing concept (Baker and Hart 1989). However, relatively little empirical work has been conducted focusing on the link between marketing research activity and business performance.. Hart and Diamantopoulos ( 1992) conducted a study to examine the effects of three marketing research activities on business performance. The three identified marketing research activities were: 1.) the use of in-house or commissioned marketing research, 2.) the types of research information collected, and 3.) the sources of such information. A sample was .drawn from 190 companies in seven sectors of British manufacturing industry, including both high-and low-growth sectors. Sales growth rate, profit margin, and ROI were used to measure business performance. Multi-item scales were developed to measure the variables pertinent to the underlying three marketing research activities..
(25) 23. The results of this study showed that these marketing research activities were not positively related 'Nith company performance.. To test the effects of use of marketing research, they first classified the sample on the basis of three dimensions: user or non-user, in-house research or commissioned research, and small, medium, or large business size. They found that there appeared to be a greater percentage of above-average performers who were users of marketing research compared to below-average performer, but there was only a single case that this pattern was significant and that only at the 10 per cent. leve~ .. It did not provide sufficient support. for the positive relationship between use of marketing research and company performance.. To test the effects of types of marketing research information collected, they identified sixteen different types of information, and performed two data analyses on them. First, principal component :u1alysis (they called "factor-analysis") was used to reduce number of variables (16 items). Five factors were extracted and named as: operating information, market information, strategic information, competitive information, and price trends, respectively. And then, factor scores were computed for each of the five extracted factors, and these were used as dependent variables in a series of two-way analyses of variance (ANOV A), with industry type (high- or low-growth) and competitive performance (above or below average) as the main effects. They found that none of the main effects was significant for any of the five information dimensions, or five extracted factors, arid only a single instance showed a clear interaction effect. That is, frequency of collection of competitive information was higher among above average performers in high-growth industries and among below average performers in low-growth industries, but the level of significance was very low. The results gave no support to the notion that the frequency of use of various types of marketing research information was associated with company performance.. Finally, to test the effects of sources of marketing research information, they performed. analysis of covariance (ANCOVA) by using nine information sources as dependent variables. Industry type and company performance were used as the main effects. The.
(26) 24. results showed that company performance effect was non-significant across all nine information sources, indicating no differences between above and below average performance. Again, there was no evidence to support that different sources of information used in marketing research had a positive impact on business performance.. They concluded that "the empirical evidence provided by the present investigation does not support the mainstream view of the literature that marketing research activity is positively related with company performance." This conclusion reflects the fact that no matter how much effort companies have put into finding out their customers' needs, for instance, using different techniques to collect different types of infonnation from different sources, there is no guarantee that they must be more profitable than others. What really matters is not what information is collected or from where it is obtained. Instead, the crucial questions are how good is the infonnation gathered and how effectively it is used.. 4. 3. FORMAL STRATEGIC PLANNING. Statement 3:. Research has proved that companies that make formal strategic plans are, on average, more profitable than companies that do not.. The relationship between strategic planning and business performance has been a subject of growing interest in the field of strategic management. The theory of strategic planning can be stated that, strategic planning positively affects business performance, or more specifically, the amount of strategic planning a company conducts positively affects its profitability.. Some academics adv.ocated formal strategic planning. Armstrong ( 1982), for instance, argued that an explicit planning process rather haphazard guesswork results in the collection and interpretation of data critical to creating and maintaining organisation-.
(27) 25. environment alignment. Similarly, Ansoff (1991) argued that planning generally produces better alignment and financial results than does trial-and error learning.. Despite the intuitive appeal of these arguments, many researchers have countered that explicit strategic planning is dysfunctional, or at best irrelevant. Mintzberg ( 1990), for instance, pointed out that all organisations must deal with uncertainty and that it is therefore dangerous for them to articulate strategies because explicit strategies are blinders designed to focus direction and block out peripheral vision.. In the past two decades, numerous empirical studies have been conducted to investigate the relationship between strategic planning and business performance, but have not produced consistent support for either of the positions stated above. Whereas early research suggested a positive relationship between planning and performance, later research was less reassuring, and that the overall effect was at best extremely weak (Boyd 1991). This section presents two comprehensive reviews that examined the previous findings in this area.. Greenley (1986) reviewed nine previous studies in UK and US manufacturing industry, but concluded that "the nature of such a relationship has yet to be established." Sample sizes of the nine studies ranged form 10 to 386. Of the nine studies, five claimed that companies which utilise strategic planning achieve higher levels of performance. The remaining four studies claimed that there was no such a positive relationship.. After assessing methodological rigour of the two groups of studies based on sampling strategy, sample size, control a group, measurement strategy, significance levels, nature of the questions, survey bias, as well as geographical inference and timing, Greenley reported that "an overall conclusion as to the relationship of strategic planning and performance cannot be arrived at.". Miller and Cardinal ( 1996) conducted a meta-analysis to explain the inconsistency of. correlations reported in the 26 pervious studies. A total of 43 samples were obtained from the studies, which provided 36 product-moment correlations between strategic.
(28) 26. planning and profitability. The sample-size-weighted mean of the correlations was 0.12, ranging from -0.21 to 0.71.. To explain the variation of correlations, Miller and Cardinal defined three "substantive contingency variables": 1.) firm size, 2.) capital intensity, and 3.) turbulence, and five "methodological contingency variables": 1.) industry effects uncontrolled or controlled, 2.) archival or infom1ant source of planning data, 3.) archival or informant source of performance data, 4.) operational definition of planning, and 5.) quality of assessment strategy. Multiple regression analysis was performed to test the effects of the defined variables on the correlations provided in the studies.. Miller and Cardinal failed to find that formal strategic planning, which was defined as "standardised planning guidelines or written plans", was strongly and positively related to profitability. The regression coefficient of the formal planning variable was only 0.085. They pointed out that, "With respect to operational definitions of strategic planning, it appears that focusing exclusively on standardised planning guidelines and written plans is problematic.". Above all, when assessing progress of empirical generalisations in this area, one would find that numerous empirical studies have been carried out by different researchers to test the effects of strategic planning on business performance, but their findings were rather controversial. There is no evidence to support that formal strategic planning will lead to the better business performance.. 4. 4. THE BCG. Statement 4:. MA TRIX. Research has proved that using the BCG matrix which classifies products or firms by market share and rate of market growth to make investment decisions is an effective way to increase the chance decisions.. of making optimal investment.
(29) 27. As a diagnostic aid and a prescriptive guide for selecting strategic options, the BCG matrix has been widely taught in marketing courses and used by managers for strategic decision making over more than twenty years. The BCG matrix classifies products along two dimensions: market share and rate of market growth. It assumes a causal relationship between market share and profitability.. Despite the lack of favourable evidence to support, it has been widely adopted by textbooks. Capon et al. (1987) presented evidence that the BCG matrix was the most widely used portfolio method in US firms. Morrison and Wensley (1991), in their survey of teachers at 34 business schools in the UK, found that the BCG matrix was taught at all schools.. Armstrong and Brodie (1994) conducted a series of laboratory experiments from 1985 to 1990 to investigate whether decision makers might be misled by the BCG matrix when making an investment decision. In the experiments subjects had to choose between two different investment projects: one involved a money saving invention and the other involved an investment in advertising. To determine whether the BCG matrix would mislead people, they wrote the situation such that the profitable investment would be categorised as a "Dog" (low market growth and low market share), and the other alternative, a bad investment, was in the "Star" category (high growth and high share).. A total of 1015 subjects were randomly assigned to each of three groups. For the BCG group, subjects were given Kotler's description of the BCG matrix. The NPV group was given a description of Net Present Value drawn by Armstrong and Brodie along with a table of discount factors using a 12% cost of capital. The control group received no other information. After making their decisions, subjects were also asked to complete a follow-up questionnaire to indicate the reason for their decisions .. The results of this study showed that 63 per cent of the subjects in the BCG treatment group chose the unprofitable project ("Star"), compared with 37 per cent in the NPV. group and 45 per cent in the control group. The difference between subjects in the BCG group and the control group was significant at p<0.01, whereas the difference between.
(30) 28. the NPV group and the control group was significant at p<0.05. When examining the method of analysis used by subjects, they found that when subjects used the BCG matrix, 87 per cent selectc:d the star, the unprofitable project. Only 13 per cent of subjects who used the BCG matrix in their analysis invested in the more profitable project.. This study provided empirical evidence that use of the BCG matrix interferes with profit maximising. They concluded that, "Profit-oriented approaches, such as NPV, should play an important role in portfolio decisions. One should consider how decisions for a given product affect profits for the whole portfolio. However, we recommend that this be done without use of matrix methods." Interestingly, up to now, it is hard to find any further empirical study that would challenge the results of this study.. 4. 5. MARKET SHARE AND PROFITABILITY. Statement 5:. Research has proved that companies with large market share are usually much more profitable than firms with small market share.. In the past three decades, many researchers and textbooks have claimed that market share is the key to profitability. The theory of economies of scale states that profitability. can be increased by having iarger share businesses, as plant and equipment investment and expenses can be spread over more units. For instance, an oil company can achieve higher profit through expanding its market share. Many market strategies have been designed assuming a causal relationship between market share and profitability. A typical example is the BCG matrix, which suggests that resources should be withdrawn unless the firm could obtain a relatively high market share position. Buzzell, Gale and Sultan (197 5) conducted a study on the relationship between market share and profitability, and reported that a 10% point difference in market share is accompanied by a 5% point difference in ROI. However, numerous studies in this area have found that market share would not appear to be, at least on average, a key to profitability (Jacobson and Aaker 1985, Szymanski, Bharadwaj and Varadarajan 1993)..
(31) 29. Jacobson and Aaker (1985) set up a more rigorous procedure to examine the residuals associated with the results of Buzzell, Gale and Sultan (1975)'s study. Working a decade after the previous study, Jacobson and Aaker selected the data from the SPIYR data base, one of the two principal PIMS data bases, which contains both cross-sectional and time series data and offers the possibility of capturing lagged effects. They expected to separate spurious from the direct influence of market share on ROI.. The first step of this procedure was to capture the impact of lagged ROI effect. They hypothesised that previous years' ROI could act as a surrogate for firm specific factors occurring in previous periods that tend to be constant on a year-to-year basis, influence ROI, and may also influence market share. By regressing ROI on market share variable and on ROI lagged one and two year variables, they found that across all businesses, the lagged ROI had a major impact and was able to substantially increase explanatory power. After controlling of the past ROI, the coefficient of market share variable in the equation dropped to 0.22, compared with 0.50 in Buzzell, Gale and Sultan (1975)'results.. The second step was to investigate the contemporaneous shock effect on both ROI and market share during the current year. Market share was separated into two components . The first component, named anticipated market share (MSAN), is the market share that can be predicted based on controllable or predetermined factors. The second component, termed unanticipated market share (MSUN), is that market share that can be predicted based on the market share model. The market share model was developed and estimated. MSAN was measured as the market share predicted by this equation, and the residual error from this equation was the empirical estimated of MSUN. Regressing market share on the lagged one and two years variables as well as other relevant variables resulted in a 2. high R value, 0.95, which suggested that large part of market share was anticipated or explained by controllable and predetermined variables. In order to separate anticipated from unanticipated market share effects, ROI was regressed on MSAN, MSUN and two ROI lagged variables. The results showed that coefficient for MSUN was far greater than that of MSAN. This suggested that by not controlling for contemporaneous factors causing unexpected changes in market share, there was an upward bias in the estimate of the direct effect of market share..
(32) 30. The final step of data analysis was to test the extent to which market share can affect profitability after controlling potentially relevant explanatory factors. They reported that, "The estimate of the direct effect of market share as represented by the coefficient for · anticipated market share has again rather dramatically fallen. The coefficient for the aggregate.ct grouping is .09, less than one-fifth uf the commonly cited estimate of .5.". Szymanski, Bharadwaj and Varadarajan (1993) reviewed 48 empirical studies on the market share-profitability relationship. They conducted a meta-analysis to assess the reported 276 market share elasticity estimates. The results showed that the 276 elasticities ranged from -0.16 to 0.84. The mean elasticity was as low as 0.2, which reflected that the correlation between market share and profitability was very weak.. In summary, recent studies in this area have provided a large amount of empirical evidence to support that there is no strongly positive correlation between market share and profitability. Rather, efforts to keep or gain market share, for the sake of being number one or having a certain market share rank, may have a detrimental impact on business profitability both in the short and long run .. 4. 6. BRAND LOYALTY. Statement 6:. Research has proved that there is no point in trying to develop loyalty to a small brand: brand Loyalty is usually greater for brands with a large market share than for brands with a small market share.. More than seven decades ago, marketing academics and practitioners had talked of the "loyal" consumer (Jacoby and Chestnut 1978). Brand loyalty was sometimes regarded as a behavioural measure (that is, exclusive purchase, hard-core loyalty, repeat purchase probability, or share of category requirements, etc.) and sometimes regarded as an attitude measure (that is, brand preference, liking, commitment, or intention-to-buy, etc.). Jacoby and Chestnut (1978), for instance, identified 53 different measures used in.
(33) 31. previous studies. They concluded that although there was a variety of measures of brand loyalty, it was widely accepted that the long-term success of a particular brand was based, not on the number of consumers who purchased it only once, but on the number who became repeat purchasers.. Ehrenberg (1972) started with the problem of brand loyalty observing that the Double Jeopardy (DJ) pattern widely occurred in branded packaged goods. That is, in a competitive market, small brands generally attract less "loyalty" among their buyers than large brands among theirs. By further analysing the relationship between market share of a brand (b) and its average frequency of purchase (w), he formulated this pattern into a simple equation: w (1-b). = w0,. and then, subjected this equation to other sets of data.. The results of test showed that the equation still held for different products, countries , points of time, and observers (Ehrenberg and Bound 1993).. According to Ehrenberg, marketing factors, for instance, marketing mix, give brands their different sales levels, which in turn show up in the DJ pattern, but rarely cause big additional differences in brand loyalty. Hence competitive brands tend to differ mainly in how many buyers they have rather than in how loyal those buyers are (Ehrenberg and Goodhardt and Barwise 1990).. In summary, Ehrenberg et al's studies in this area provided a large amount of empirical evidence that undermined the conventional beliefs of brand loyalty. Many popular business strategies based on the concept of brand loyalty such as constant brand-building, brand equity, brand segmentation, loyalty programmes, and advertising-being-strongand-persuasive, are beginning to fade. There is no point in trying to develop loyalty to a small brand because a small brand generally attracts less loyal buyers than large brands..
(34) 32. 4. 7. CONSUMER A TT/TU DES AND BEHAVIOUR. Statement 7:. Research has proved that an effective way to increase sales is to use advertising to change the attitudes of potential customers.. For many years, considerable research has been directed towards the problem of identifying the relationship between consumer attitudes and behaviour. A variety of advertising theories and business strategies have been developed based on the assumption that attitude changes will predict further behaviour changes. Obviously, one of the instruments which managers can use to change their customers' attitudes is advertising. Numerous studies have been carried out to investigate the effects of advertising on consumer attitudes, and many claimed that a positive change of the attitudinal variables would contribute to the improvement of sales.. However, considerable research also found that how many people give an attitudinal response to a brand generally varies with how many of them use the brand and how often they do so. Further, consumer attitudes towards competitive brands were far from stable over time. Even a brand's heavy buyers still buy other brands almost half the time (East and Hammond 1996).. To attack the problem of volatility of consumers' attitudes, Ehrenberg (1997) suggested that consumer attitudes may follow, rather than cause, consumer behaviour. According to Ehrenberg, people occasionally try a brand that is new to them, try it again, then perhaps adopt it, and then begin to feel that they can say in an interview that they like it: "I use it, therefore I like it". In other words, this position would be interpreted that there is no causal relationship between consumer attitudes and behaviour. Rather, they both correlate with the usage of a brand (the third factor). In this sense, if a positive attitude indicates commitment and loyalty; the positive beliefs must be rather stable over time.. Ehrenberg and his colleagues (Riley, Ehrenberg, Castleberry, Barwise, and Barnard 1997) conducted their research to investigate the over-time stability of consumers'.
(35) 33. expressed attitudinal beliefs, both overall intentions-to-buy and free-choice beliefs about specific brand attributes. They reported that "the relationship between the repeat-rate (RR) and the initial response level (RL) is mostly consistent across different product categories, countries, and attribute beliefs, and broadly RR= RL + 20.". The results of their research revealed that consistency of consumer attitudes towards brands depends not on how well people regard them, but on how many people regard them well. In other words, the Double Jeopardy pattern still holds in prediction of consumer attitudes. Ehrenberg et al. therefore suggested that for setting advertising. objectives, managers should not aim at stimulating brand differentiation through attitudes, but should try to reinforce customers' experience and beliefs towards the brand, so that they keep buying it. Strong beliefs in a distinctive characteristic of a brand do not necessarily result in increased sales.. For many decades, many researchers have argued against the assumed causal relationship between attitudes and behaviour. For instance, Zaltman and Wallendorf (1979) pointed out that "certain attitudes and behaviours are not related to each other, although intuitively at least, it seems as if they should be." Chisnall (1994) argued that "there is almost universal agreement that attitude tends to have only a weak relationship to actual behaviour towards the object of the attitude." Craig-Lees, Joy and Browne (1995) stated that "attitude models may help you to assess a consumer's attitude towards a product, but there may be a weak link between the attitude and the behaviour." Joyce (1967) maintained that "attitudes influence purchasing, but purchasing influences attitudes as well.". Above all, Ehrenberg et al's work provides a direction for the further research. The Dirichlet model (DJ pattern) has been extended to explain the variability of consumer attitudinal beliefs and the relationship between consumer attitudes and behaviour. The empirical generalisations in the area of consumer behaviour research have been advanced towards an integrated theory..
(36) 34. 4. 8. ADVERTISING EFFECTIVE FREQUENCY. Statement 8:. Research has proved that to be effective, an advertisement has to be exposed to its audience more than once.. The effective frequency of advertising exposure is the idea that disseminating messages is somehow directly related to receiving them at the other end. Therefore the number of exposures or impressions delivered to a target population by a given media schedule can be calculated and then manipulated to conform to a level that carries the greatest impact.. For more than thirty years, advertising researchers have tried to rationalise two seemingly contradictory facts about advertising effective frequency. On the one hand, Krugman (1972) suggested a three-hit theory. That is, a first exposure creates what might be called a startle effect, the second a recognition effect, the third a comforting familiarity and acceptance effect, while subsequent exposures evoke progressively greater reactions of boredom and uninterest. Bogart et al ( 1970), on the other hand, showed that a single additional exposure could have a marked effect. However, as the concept of advertising effective frequency has become more familiar, there has been a growth in criticism and debate on the multiple exposure theory.. McDonald ( 1970) was one of the earliest researchers who conducted single-source research in UK to test short-term advertising effect. This research was based on the data from a diary kept over 13 weeks among 265 household in the London ITV area at the end of 1966. On each day, the households recorded their purchased in 50 different product fields; the issues they had seen out of 32 newspapers and magazines; and the ITV segments they had seen with each programme segment and commercial break separately identified. Opportunity-To-See (OTS) was specified as the measure of advertising, while Brand Switching was used to measure it effects..
(37) 35. McDonald reported that "two exposures seems to be an optimum number for stimulating a purchase change. One alone runs the risk of being beaten by competition; three or over has no greater stimulating power than two.". Jones (1995) replicated McDonald's single-source research in USA, but reported different findings. In Jones's research the purchase diary was replaced by a digital scanner, and a complicated system called "Monitor Plus" was installed to analyse exposure of TV commercials. Television was the only advertising medium used in this research.. Household purchasing data was collected using household scanners which were installed in 2,000 homes. Household television-viewing information was collected from the meters attached to all TV sets in each of these homes. The identities of the brands advertised were established by Nielsen Monitor Plus, which kept a running log of all television advertising in the defined areas.. The measure of advertising was also based on OTS, but the immediate sales-generating effect of the campaign was measured by the difference between the brand's share of the purchase occasions in the households which had not received television advertising for it during the seven days before purchase, and the brand's share in the households that had received at least one television advertisement in that period.. The analysis of data showed that "one exposure generated the highest proportion of sales, and additional exposures add very little to the effect of the first." Jones pointed out that, "It is wasteful to concentrate media money into 'flights' to provide an average of more than one OTS . Since one exposure within an advertising 'flight' generates much the largest quantity of sales, high-pressure airtime flights are wasteful." This finding contrasts with the widely held belief that there is a threshold, and that one-time effects must be small.. Gibson (1996) reported the results of TRI-NET experiments conducted by General Mills. TRI-NET is a series of "real-world" experiments in which respondents cannot.
(38) 36. know they are subjects in an advertising effectiveness study, either at the time of the commercial exposure or at the time of the research measurement. Data collection started the morning after the test TV commercials were aired. Over 7 ,600 telephone interviews were randomly selected and completed that day. The questionnaire was designed to gather brand choice data prior to any reference to television. The criterion measure was share of coupon selection. The results of the experiments indicated that a single exposure had a strong effects. For several commercials, gains of 25 percent, 50 percent, or more in share of choice were observed. Significant negative effects were also found for some commercials.. In summary, recent studies have provided sufficient evidence to support that one. exposure of advertising can be effective, and multiple exposures are not necessary.. 4. 9. SERVICE QUALITY. Statement 9:. Research has proved that companies with high scores on service quality measures are, other things being equal, more profitable than firms with low scores.. In recent years, both academics and practitioners have raised their concerns about measurement of service quality.. Since the Servqual model was introduced as an. instrument for measuring service quality (Parasuraman, Zeithmal and Berry 1985, 1988; Zeithaml, Berry and Parasuraman 1993), the debate has not specifically investigated the effects of service quality on profitability. There is no evidence to support the claim that improvement of service qualities, for instance, having higher scores on Servqual measures, leads to a better business performance. However, from common sense and real experiences of companies, it is clear that improving quality helps up to a point, but past that point further expenditures on quality are unprofitable. How to make profitable decisions about quality expenditures is still unsolved..
(39) 37. A recent development of research in this area is the ROQ (Return on Quality) model proposed by Rust, Zahorik and Keiningahm (1995), which attempts to establish the linkage between a company's expenditures on improvement of service quality and its financial accountability. Progress will occur as this approach is tested in a variety of different industries and countries, as the research is replicated by different researchers, and the conditions under which it does hold are identified.. 4. 10. MARKET SEGMENTATION. Statement 9:. Research has proved that companies that divide potential customers into segments, and concentrate on marketing to a target segment, are much more likely to be profitable than firms that just try to achieve the best overall results.. Despite the widespread use of segmentation techniques and much applied experience, little research has been carried out to investigate the relationship between market segmentation and business performance. Therefore the theory of market segmentation has not passed any of empirical test as yet..
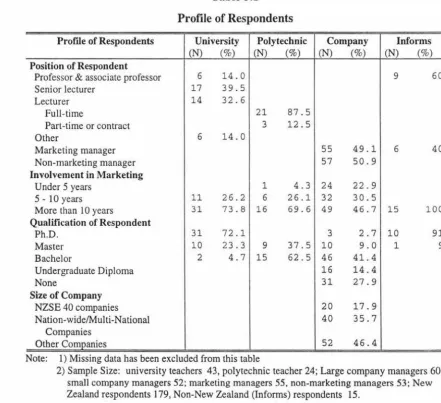
(40) 38. CHAPTER FIVE. 5. 1. RESULTS. PROFILE OF RESPONDENTS. In this survey, a total of 67 New Zealand marketing academics, 112 New Zealand marketing practitioners and 15 international academics and practitioners completed and. returned the questionnaires. Table 5.1 illustrates the profile of respondents.. Table 5.1. Profile of Respondents Profile of Respondents. University (N) (%). Polytechnic (N) (%). Company (N). (%). Informs (N) (%). Position of Respondent 14.0 60 6 9 Professor & associate professor 17 39.5 Senior lecturer 14 32.6 Lecturer 21 87.5 Full-time 3 12.5 Part-time or contract 6 14.0 Other 49.l 40 55 6 Marketing manager 57 50.9 Non-marketing manager Involvement in Marketing 1 4.3 24 22 . 9 Under 5 years 26.1 11 26.2 6 32 30.5 5 - 10 years 31 73 .8 16 69.6 49 46.7 15 100 More than 10 years Qualification of Respondent 31 72.l 3 2.7 10 91 Ph.D. 10 23.3 37.5 10 9 9.0 1 9 Master 2 4.7 15 62.5 46 41. 4 Bachelor 16 14 .4 Undergraduate Diploma 31 27.9 None Size of Company 20 17.9 NZSE 40 companies 40 35.7 Nation-wide/Multi-National Companies 52 46.4 Other Companies Note: 1) Missing data has been excluded from thjs table 2) Sample Size: university teachers 43, polytechnic teacher 24; Large company managers 60, small company managers 52; marketing managers 55, non-marketing managers 53; New Zealand respondents 179, Non-New Zealand (Informs) respondents 15..
(41) 39. Position of Respondent.. In the group of New Zealand marketing academics, about. two thirds of respondents are university teachers, and one third of polytechnic teachers. Among the university teachers, nearly half of respondents occupy senior lecturer or higher positions. For the New Zealand marketing practitioner sample, half of respondents are marketing managers. For the sample of marketing academics and practitioners outside New Zealand, all respondents are senior teaching staff or senior managers.. Involvement in Marketing.. For New Zealand marketing academics, almost all of the. respondents have taught marketing for more than five years, and about two thirds for. more than ten years. Of the New Zealand marketing practitioners, nearly half have been involved in marketing for more than ten years. For marketing academics and practitioners outside New Zealand, all respondents have been involved in marketing for more than ten years.. Qualifications of Respondent.. For. New. Zealand. marketing. academics,. all. respondents hold a bachelor or a higher degree. For New Zealand marketing practitioners, about one third of respondents have not obtained any qualification yet. For marketing academics and practitioners outside New Zealand, most of respondents are holders of Ph.D. degree.. Size of Company.. For New Zealand marketing practitioners, about 20 per cent of. respondents are staff of NZSE 40 companies, and 30 per cent of them are working with nation-wide or multi-national companies. Another half of respondents are owners or managers of small companies..
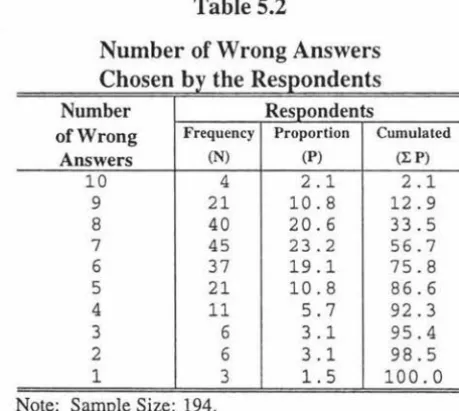
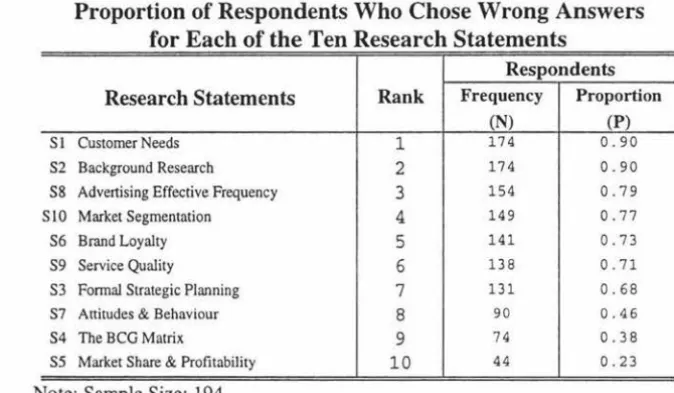
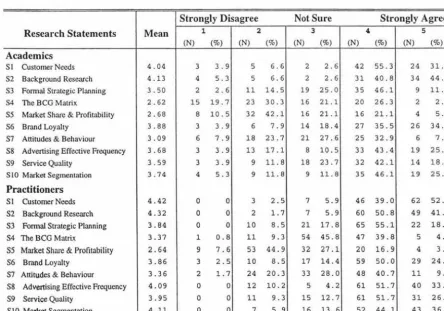
(42) 40. 5. 2. OVERALL MARKETING BELIEFS AMONG ACADEMICS AND PRACTITIONERS. The data obtained from all the respondents in this survey are merged together to assess their overall judgements of the ten research statements. The general results of their judgements on each of the ten statements are shown in Appendix B, Table 1.. As presented in Chapter Four, recent studies showed that none of the ten marketing theories included in the present study has been well established. Therefore, in compliance with this result, two categories of data, score 4 (agree) and score 5 (strongly agree), are combined together as "wrong answer". For the statement of brand loyalty, it is reversely coded to support the theory of brand loyalty. Table 5.2 shows the number of wrong answers chosen by the respondents.. Table 5.2 Number of Wrong Answers Chosen by the Respondents Number of Wrong Answers 10 9 8 7 6 5 4 3 2. Respondents Frequency (N). 4 21 40 45 37 21 11 6 6 1 3 Note: Sample Size: 194.. Proportion (P). Cumulated. 2.1 10 . 8 20 . 6 23 . 2 19 . 1 10.8 5.7 3.1 3.1 1. 5. 2.1 12.9 33.5 56.7 75.8 86.6 92.3 95.4 98.5 100.0. (.I:P). It appears that about 2 per cent of respondents made all the ten wrong choices, and about 80 per cent chose more than half of wrong answers. Table 5.3 illustrates the proportions of respondents who chose wrong answers for each of the ten research statements..
(43) 41. Table 5.3 Proportion of Respondents Who Chose Wrong Answers for Each of the Ten Research Statements Research Statements. Rank. Respondents Frequency Proportion (N) (P). Sl Customer Needs. 1. 174. S2 Background Research. 17 4. 0 . 90. 154. 0.79. S7 Anitudes & Behaviour. 2 3 4 5 6 7 8. S4 The BCG Matrix. SS Advertising Effective Frequency S 10 Market Segmentation S6 Brand Loyalty S9 Service Quality S3 Formal Strategic Planning. S5 Market Share & Profitability. 0.90. 1 49. 0 .7 7. 1 41. 0.73. 13 8. 0. 71. 13 1. 0.68. 90. 0.46. 9. 74. 0 . 38. 10. 44. 0.23. Note: Sample Size: 194.. As seen in Table 5.3, for seven out of ten statements, over two thirds of respondents chose wrong answers. Of the ten statements, two have the equal largest proportions of respondents who chose wrong answers. About 90 per cent of respondents believed that the customer needs statement (S 1) and the background research statement (S2) have been proved by research. The statement with the smallest proportion of respondents who chose wrong answers is the market share and profitability statement (SS) . Only about 20 per cent of respondents agreed that it has been proved by research.. 5. 3. DIFFERENCE OF MARKETING BELIEFS BETWEEN ACADEMICS ANO PRACTITIONERS. For test of the difference between academics and practitioners who chose wrong answers, three different procedures of data analysis are exercised: 1.) analysis of the different numbers of wrong answers chosen by the two groups of respondents, 2.) analysis of different proportions of the two groups of respondents who chose wrong answers for each of the ten statement, 3.) analysis of the different means of their judgements on each of the ten statement..
Figure

+7
Related documents
In this district, community agents followed a door-to-door collection strategy while in Tsihombe nets were collected passively, with commu- nity members being responsible for
With the overall objective of developing blood biomar- kers of angiogenesis, we examined the associations of blood levels of miRs implicated in angiogenesis with those of
Studies that assessed health system costs of malaria control and elimination were abstracted for total costs, cost per population at risk (PAR), and cost per capita.. When total
Using qPCR, we measured SjTK4 mRNA levels in eggs, cercariae and schistosomula and in the testis, ovary, non-testis and non-ovary tissues of adult male and fe- male parasites on days
Impact of high-flow nasal cannula oxygen therapy on intensive care unit patients with acute respiratory failure: a prospective observational study. Sztrymf B, Messika J, Bertrand F,
Prevalence and factors associated with one-year mortality of infectious diseases among elderly emergency department patients in a middle-income country.. Maythita Ittisanyakorn 1,2
Although the information on cold-set gelation is limited as compared to that on heat-induced gelation, the results have showed that cold-set gels are different
The work is not aimed at measuring how effective your local polytechnic is, but rather to see what measures different community groups, including potential students, use when
