Theses Thesis/Dissertation Collections
2012
Stacking of Dangerous Goods in Accordance with
United Nations Stacking Recommendation
Zachary Loughery
Follow this and additional works at:http://scholarworks.rit.edu/theses
This Thesis is brought to you for free and open access by the Thesis/Dissertation Collections at RIT Scholar Works. It has been accepted for inclusion in Theses by an authorized administrator of RIT Scholar Works. For more information, please contactritscholarworks@rit.edu.
Recommended Citation
Stacking of Dangerous Goods in Accordance with United Nations Stacking Recommendation.
By
Zachary Loughery
A Thesis
Submitted to the
Department of Packaging Science
College of Applied Sciences and Technology
In partial fulfillment of the requirements for the degree of
Master of Science
Rochester Institute of Technology
Department of Packaging Science College of Applied Science and Technology
Rochester Institute of Technology Rochester, New York
CERTIFICATE OF APPOVAL
________________________________
M.S. DEGREE THESIS
_________________________________
The M.S degree thesis of Zachary Loughery Has been examined and approved By the thesis committee as satisfactory
For the requirements for the Master of Science Degree
Dr. Daniel Goodwin Date_______________
_______________________________________
Mr. Thomas Kausch Date_______________
COPY RELEASE
TITLE OF THESIS
I, Zachary Loughery, hereby grant permission to the RIT Library of the Rochester Institute
of Technology to reproduce my thesis in whole or in part. Any reproduction will not be for
commercial use or profit.
Permission from Author Required
Stacking of Dangerous Goods in Accordance with United Nations Stacking Recommendation
I, Zachary Loughery, prefer to be contacted each time a request for reproduction is made. If
permission is granted, any reproduction will not be for commercial use or profit. I can be reached
at the following address:
______________________________
______________________________
______________________________
Phone:_________________________
Acknowledgments
I would like to thank the wonderful staff at Rochester Institute of Technology, for all of the work and continuous support of me throughout my career there. I also want to thank Bundersanstalt
für Materialforschung und-prüfung, at which this study was conducted, your reasourses and expertise along with the hard work from my collegues made this testing possible. Finally I would like the thank my loved ones who supported me though out this endevour. This document would not be possible with out the carefull calaboration of many indivuals and my sincerest thanks goes
Stacking of Dangerous Goods in Accordance with United Nations Stacking Recommendation
By
Zachary Loughery
Abstract
The purpose of the study was to determine if the possible interpretations of the UN stacking
recommendation could lead to different results. If this is possible the recommendation would
need to be rewritten to eliminate the possibility of the same product passing or failing within the
standard. The focus of this study was a plstic jerrican filled with water. The acceptable methods
that are mentioned in the recommendation are the type of compression and the optional use of a
fixture to simulate nesting. Each jerrican was filled in accordance with the recommendation and
allowed to Condition in the testing room at 23°C and 50% humidity for at least 24 hours. The
packagings were tested until an appropriate stacking load was placed on to the package. At these
loads, the deflections were compared from each test set up as described by the UN
recommendation. A statistical evaluation was used to compare the results from each set up with a
single variable. This test showed that it was unlikely that the same deflections would occur with
the different set ups and that unguided compression would have greater deflections. A long term
stacking test was performed at 40°C and showed that unguided stacking test would also have a
faster creep rate. The position of the package under the unguided compression was also studied.
A CAD image was used to control the position of the package as it was moved to specific
offsets. This showed a 1 cm offset could greatly change the deflection and that the movement on
the bottom of the plate would change the angle of the swivel platen. Digital Imaging Correlation
(DIC) was used to highlight the internal localized stress. These stresses were analyzed in both
guided and unguided compression. The different methods will give different overall deflections
1. INTRODUCTION ... 1
1.1. GOALS &OBJECTIVES ... 1
1.2. BACKGROUND ... 1
1.3. LITERATURE REVIEW ... 2
2. BASICS ... 6
2.1. SAMPLES STUDIED ... 6
2.2. RELATED THEORY ... 7
2.2.1. Hooks Law ... 7
2.2.2. Creep ... 7
2.2.3. Mann-Whitney U test ... 7
2.2.4. Strain gauges and Load Cells ... 7
3. DESCRIPTION OF TEST... 8
3.1. EQUIPMENT USED ... 8
3.1.1. COMPRESSION TESTER ... 8
3.1.2. STATIC STACKING MACHINES ... 8
3.1.3. TEK PRESSURE MAT ... 8
3.1.4. FLOOR SCALE ... 8
3.1.5. LAB VIEW ... 8
3.2. METHODOLOGY ... 8
3.2.1. Dynamic Compression Test... 9
3.2.2. Static Stacking test ... 11
3.2.3. Resultant Force ... 12
3.2.4. Pressure Test ... 13
3.2.5. Digital Imaging Correlation (DIC) ... 14
3.2.6. Positional Study Using a Compression Machine... 15
4. DATA ACQUISITION AND ANALYSIS ... 17
4.1. DATA ANALYSIS ... 17
4.1.1. Variable Identification ... 17
4.1.2. Calculations ... 18
4.2. DATA PRODUCTS ... 21
4.2.1. Graphs ... 21
4.2.1.1. Histogram ... 21
4.2.2. Tables ... 22
4.2.2.1. Average deflection at Stacking Loads ... 22
4.2.2.2. Positional study ... 23
5. DISCUSSION OF RESULTS ... 23
5.1. OVERALL CONCERNS... 23
5.2. DYNAMIC STACKING TEST ... 25
5.2.1. Condition 1, 5mm/min, Guided Compression, and no Stacking fixture ... 25
5.2.2. Condition 3, 20 mm/min, Guided Compression, no Stacking Fixture ... 26
5.2.3. Condition 1 Compared to Condition 3 ... 27
5.2.4. Condition 4, 5 mm/min, Guided Compression, Stacking fixture ... 28
5.2.5. Condition 1 Compared to Condition 4 ... 28
5.2.6. Condition 6, 20 mm/min, Guided Compression, Stacking fixture ... 29
5.2.7. Condition 4 Compared to Condition 6 ... 30
5.2.8. Condition 7, 5 mm/min, Unguided Compression, no Stacking Fixture ... 31
5.2.9. Condition 1 Compared to Condition 7 ... 31
5.2.10. Condition 9, 20 mm/min, Unguided Compression, Stacking Fixture ... 32
5.2.11. Condition 7 Compared to Condition 9... 33
5.2.12. Condition 10, 5 mm/min Unguided Compression, Stacking Fixture... 33
5.2.13. Condition 4 Compared to Condition 10 ... 34
5.2.14. Condition 7 Compared to Condition 10 ... 35
5.2.15. Condition 12, 20 mm/min, Unguided Compression, Stacking Fixture ... 36
5.2.17. Condition 10 Compared to Condition 12 ... 37
5.2.18. Summary of all Testing Conditions ... 38
5.3. STACKING TEST ... 39
5.4. HORIZONTAL FORCE RESULTS MEASURING THE ANGLE ... 40
5.4.1. PRESSURE MAT RESULTS ... 42
5.5. PRESSURE TEST ... 44
5.6. DIGITAL IMAGING CORRELATION (DIC) ... 46
5.7. POSITIONAL STUDY ... 47
7. ERROR ANALYSIS ... 53
7.1. STATISTICAL ... 53
8. REFERENCES ... 54
9. APPENDICES... 56
9.1. MINI TAB CALCULATION ... 56
9.1.1. Session log ... 56
9.2. HISTOGRAMS ... 73
9.2.1. Condition 1 ... 73
9.2.2. Condition 3 ... 75
9.2.3. Condition 4 ... 77
9.2.4. Condition 6 ... 79
9.2.5. Condition 7 ... 81
9.2.6. Condition 9 ... 83
9.2.7. Condition 10... 85
9.2.8. Condition 12... 87
1. INTRODUCTION
1.1. Goals & Objectives
The goal of the thesis is to determine if there is a difference in the different acceptable
interpretations of the UN stacking recommendation.
The test was performed to show the deviation of the different interpretations of the UN stacking test.
1. Measure all necessary parameters and set-up/calibrate equipment.
2. Perform experiments and collect data.
3. Interpret data to experimental values
4. Perform comparative analysis of the experimental values
5. Determine sources of error and limit the impact of error in the experiment.
6. Generate the report
1.2. Background
The United Nations (UN) has set down a list of testing recommendations for the transport of
dangerous goods. Dangerous goods are any substances that can cause harm to people, animals or
the environment. The UN provides a list of substances that can be classified as dangerous goods
[1]. These test recommendations are not always clearly written and can leave room for different
interpretations. One part in particular is the stacking test described in section 6.1.5.6 of the 16th
edition of the UN recommendations on the transport of dangerous goods. This method suggests
using a compression tester to simulate packaging being warehoused or stored with other
packagings stacked on top of it. For plastic jerricans, the is conducted run for a period of 28
days. The weight of the load should be equal to the weight of similar packagesstacked on top of
the package during transport. The height, including the test sample, should not be less than 3
meters at 40oC. This recommendation fails to address how the load should be applied. The type
of compression being either guided, or unguided as specified in ISO 16104, and the use of a
stacking fixture to simulate the lowest part of the package that would come into contact with the
testing sample during stacking. This is the case with jerricans, as they are designed to interlock
(nest) into each other which would not be properly simulated by a flat plate coming into contact
with the package to be tested. The purpose of this experiment is to show the potential deviation
of results when testing the same packagings under the different acceptable Conditions as
mentioned ISO standard and the UN recommendations.
A company that is testing a product for transport may not have a mechanical compression
it to simulate the stacking load. If the load tips over and the package is said to have failed the
test because it was not able to support the load. A different company tests the same product
using a compression tester and the package survives for the 28 days at 40°C. Another company
uses a similar compression tester where a swivel platen is connected and once again the package
fails to withstand the load for 28 days. What is the difference between the stated test methods?
In one case there is an unguided load being stacked freely on top of a package as the package
starts to yield the load shifts and cause the package to topple. A compression tester with a
guided load evenly distributes the weight across the package so it just keeps getting compressed
without experiencing failure. For the last case, a swivel platen is used in conjunction with the
compression testers.
For this experiment packagings were subjected to a constant rate of loading for each of the
acceptable methods in which a stacking load can be applied. The deflection was recorded as
soon as a full stacking load was applied. These deflections were compared from different
interpretations of the standard.
1.3. Literature Review
Several test standards were evaluated for the development of the experiment. The UN book
of recommendations was the focus of this study and the experiment was devised to show the
variation in the different interpretations of the recommendation. The amount of research
pertaining to this subject in the field of dangerous goods is limited, so the packaging of retail
goods was also analyzed. The biggest issue with the UN recommendation is that it fails to
identify how the load should be applied; according to ISO 16104 there are three acceptable
methods for applying the load to test samples.
An unguided load on an individual packaging;
A guided load on packaging(s);
An unguided load on three packaging’s forming one layer: Where a packaging has an inter-stacking feature the stack loading may be applied using a reproduction of the packaging base shape as the lowest component of the stack.
The ISO identify a rate of loading three types of stacking compression but doesn’t make
mention of a rate of loading or if a fixture to replicate interlocking features (stacking fixture) in
mandatory. There are three areas of concern from the UN recommendations that were studied;
The second is the use of a stacking fixture to simulate the actual bottom of a package, or a pallet;
and finally the rate at which the load is applied.
The paper “Importance of Compression Test Procedure for Plastic Drums for Dangerous
Goods”[2] written by P. Andre, M. Veaux and J. Victor, brings up the same issue as described in
this thesis. The Andrestudy focused on the use of guided and unguided compression. The
findings from this study show that the transport of dangerous goods in Group One, Two and
Three were not altered by the different test methods; however, there was a risk for warehousing
in groups two and three and the non-guided procedure was preferred. In this study actual
stacking tests were performed on different types of barrels. The tests were performed in
accordance with the UN recommendations at a temperature of 40oC on single packagings. Pallet
quantities were also tested but these were done at room temperature. No noticeable failure was
observed from these tests so the authors assumed that there is no difference in the various test
methods. The test was carried out on two different types of barrels but this doesn’t show if the
methods returned different values. The fact that the stacking test didn’t cause failure in the drums
shows that the drums are able to pass the stacking test. Single packagings passed at 40°C and the
pallet quantities passed at room temperature. However, different failure modes may be observed
for different packagings under different circumstances.
One of the issues to be addressed in this study the difference between guided and unguided
testing. “Analytical and Experimental Techniques for Unit Load Design” [17] by Dale
Knockenmuss shows how the stacking strength is affected by horizontal forces along with
vertical forces and failure can occur in both the vertical and horizontal direction. A guided
compression test will not load the package horizontally. All the force is applied in a vertical
direction and will compress the package evenly. Unguided compression is allowed to move
about a point or a plane. These extra degrees of freedom for the plates will apply forces in the
horizontal direction. If failure in the horizontal direction is a concern then unguided
compression is necessary.
Luther “Chip” Stone has brought up the issue of fixed vs. floating vs. swivel platen, in his paper “Compression testing: fixed vs floating platen.”[23] the same terminology was used in the
paper. A fixed platen is a guided platen that will remain flat during compression because it is
compression. Using a fixed platen is a type of guided compression test. Stone also mentions two
types of plates that are used during unguided compression; a swivel platen is the more common
type of unguided plate. A swivel platen is held at the center with a ball and socket type joint to
allow free rotation. As the plate tilts, it adds a horizontal force on to the package; also the plate
will have some horizontal movement. This movement is dependent on the offset of the pivot
point to the platen.
A true floating plate will not add additional horizontal force to the platen as shown in
“Analytical and Experimental Techniques for Unit Load Design”[17] by Dale Knockenmuss, the
compression in this study uses a true floating platen. Other important items from this paper are
how Knockenmuss addresses the failure modes from vertical and horizontal forces. The section
6.1.5.6.3 of the UN recommendations states the criterion for passing a test as the following; “No
test sample may leak. In composite packagings or combination packagings, there shall be no
leakage of the filling substances from the inner receptacle or inner packaging. No test sample
may show any deterioration which could adversely affect transport safety or any distortion liable
to reduce its strength or cause instability in stacks of packagings. Plastics packagings shall be
cooled to ambient temperature before assessment.”[1] This means that failure is subjective but
can come from vertical displacement as well as horizontal displacement. This failure can be
caused by the bottom layer of packaging shifting such that the entire stack is compromised, as
was this case with Knockenmuss findings.
Often, products are made with certain design type features to improve the functionality. The
jerricans used in the study are blown molded in way that allows them to interlock when stacked.
Also, a handle is placed about the filling spout to allow for carrying and the needed space for
stacking is removed from the bottom. A design feature can affect overall strength demonstrated
in. “Effect of Carrying Slots on the Compressive Strength of Corrugated Board Panel”[13]. This
study shows the reduction in overall compression strength when the area is reduced, which is
relevant under two different types of circumstances. One is reduction when the load bearing area
is changed; such as the importance of a stacking fixture for usage of nesting products. The other
circumstance is when stresses are localized about a point, such as a handle. These stresses can
change position dependent on the shifting in the swivel platen. This is relevant when tests are
The International Safe Transit Association ISTA 3J as well as the Series 6 Sam's Club
require a pallet be placed on top of a pallet load before compression is performed. This simulates
the real world stacking of products. “Sam’s Club Distribution Testing Success”[15] notes that
these are the only test protocols that require the use of a pallet to simulate actual loading. This
stacking fixture is only referenced to being permissible in both the ISO 16104 and the UN
recommendations. The ISTA 3J describes how a pallet should be placed on top of unit loads to
simulating compression. This demonstrates the importance of the use of a stacking fixture.
The stacking test is carried out over an extended period of time. For metal containers the
loading time is 24 hours. For plastic and composite packagings the load needs to be applied for
28 days at 40°C. This will cause the packagings to creep. The phenomenon of creep in high
density polyethylene (HDPE) needs to be better understood. A stacking test is unpredictable and
difficult to control, a compression test is better controlled and then understanding how the
package will “creep” can be used to determine the end result. For the purpose of this
experiment, a statistically significant sample could not have been produce in the time period.
However the initial loadings of the packagings could be determined accurately and repeatedly
from the “apply and release” method of a compression machine. The creep behavior will be
approximated to demonstrate the differences that occur from the different types of loadings and
how they affect the end results. “Compressive strength and creep of recycled HDPE used to
manufacture polymeric piling” [9]shows that with a higher strain rate the rate of creep will also
increase for recycled HDPE. Thusly the higher initial deflection that occurs after loading will
result in a more rapid creep. “Influence of Normal Stress on Creep in Tension and Compression
of Polyethylene and Rigid Polyvinyl Chloride Copolymer”[21], additionally developed an
equation for determining the creep rate in HDPE. Again showing that at higher strains the rate of
2. BASICS
2.1. Samples studied
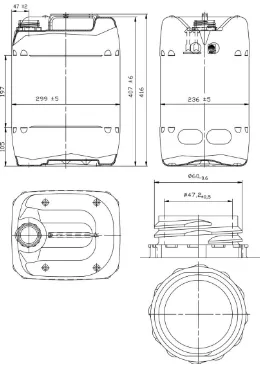
The jerrican used for testing had a nominal volume of 22 l as shown in Figure 1, from
Mauser-Werke GmbH. Each sample was filled with 24.24 liters of water as the 98% brimful
capacity as calculated by ISO 16104. [5] and in accordance with standard procedure at
[image:17.612.185.445.255.621.2]Bundersanstalt für Materialforschung und-prüfung.
2.2. Related theory
This section described the basic mechanical principles that in this document to support
concepts or results.
2.2.1. Hooks Law
Hooks law is the stress strain relationship that within the plastic region of deformation there
is an equal relationship to the amount of deformation to the amount of force applied. This
principle was used to show the difference between the test methods. The force was recorded as
the reaction through the package.
2.2.2.Creep
The Society of Plastic Engineers defines creep as “the tendency of a solid material to slowly
move or deform permanently under the influence of stress that below the yield strength of the
material.” They also identify of how this will be more served with higher stresses and elevated
temperatures. The UN stacking recommendation is to be performed under a load at 40oC for a
duration of either 24 hour or 28 days depending on the type of package.
2.2.3.Mann-Whitney U test
The Mann-Whitney U test is a statistical test that analyzes the medians of a data set instead
of the means so it can be used for non-parametric data. Histograms of all data sets were found to
not have a normal distribution. In this case the Mann-Whitney U test is needed to test the
significance of 2 independent sample sets. It studies the sample of the data to determine if the
data could be in the same population. This would be that the results should be same. The values
are rewritten in ascending order and given a rank. Equal or tied values are adjusted. The two
tailed test means the results were compared to find if they were not equal.
2.2.4.Strain gauges and Load Cells
A strain gauge is generally made from a wire and uses the principle of resistivity to
determine deformation. Given that resistivity is a function of the material’s length and area, as
these factors change, so does the amount of resistance that the wire has. As a strain gage is
compressed the length decreases and the area increases causing a decrease in the resistance, this
drop can be used to determine the amount of deflection. The Tekscan pressure mat uses a lattice
strain gauge in which force is transformed into an electrical signal. The load cells used with
strain load cells with also use the deformation of the material and resistivity to find
3. DESCRIPTION OF TEST
3.1. Equipment Used
3.1.1. Compression tester
Custom built compression tester with four screws in each corner and 10kN load capacity
calibrated in 2012. This was used for all dynamic compression including fixed and floating
platen. The machine ran with Instron Blue Hill software version 6. This is able to control the
rate the load was being applied and record all load and deflection data.
3.1.2. Static stacking machines
Stacking cylinders were used to apply a constant load to packaging. Calibrated cylinders at
which a load was set and applied to the packaging. These cylinders were not able to record the
deflection of the package.
3.1.3.Tek Pressure mat
Map and Sensor Model 3150 with I-scan light software. The software was able to playback
of the force distribution.
3.1.4. Floor scale
Satorius Is300IGG-S floor scale.
3.1.5.Lab view
National Instruments LabVIEW was used to make custom programs to measure the pressure.
These programs were already in use a BAM
3.2. Methodology
This section describes the method used to determine results. For this study all jerricans were
filled with water to 98% brimful capacity as determined in accordance with ISO 16104. The
research was broken up into different tests. A dynamic stacking test (compression) was
performed to accurately apply a load. Samples were allowed to Condition for a period of at least
24 hours in a controlled room set to 23°C and 50% humidity. All samples were placed into a
compression machine and compressed to 50% of the original height. This test was performed
with different set ups as suggested in the UN recommendation. Three stacking loads were
three loads were statically analyzed for comparison. All samples were also place on top of a
pressure mat which was used along with a screen capture device to record the force distribution
of bottom of the jerrican during compression. A static stacking test was performed to determine
the rate of creep in the jerrican. Samples were placed under the highest stacking load calculated
and the lowest height as required by the UN. Both guided and unguided stacking tests were done
while measuring the deflection from each corner. These samples were allowed to Condition for a
period of 48 hours at 40°C. These tests were performed at the same Conditions. To determine
the resultant force that was caused by the use of the swivel platen a pressure test was performed
along with measuring the angle that the swivel platen made. This angle was used in the
calculation of the resultant force that would be applied to the package. Digital Imaging
Correlation was used on 3 samples to show the localized stresses from in jerrican.
3.2.1. Dynamic Compression Test
To evaluate the relationship of different interpretations of the stacking test a compression test
was used with the following method.
80 jerricans were filled with water in accordance with ISO 16104 and compressed to 50% of
the original height original height, or until the package could no longer be compressed. ISO
12048 suggests a speed of 10 mm/min. ASTM D642 uses a compression rate of 12.7 mm/min in
order to show the affects of different rates half and double of the suggested speed will be used (5
mm/min and 20 mm/min) respectively. Three different rates were initially selected at 5 mm/min,
10 mm/min and 20 mm/min. After testing at 5 mm/min and 20 mm/min it was determined that
10 mm/min was not necessary. The load versus deflection will be recorded from the
compression’s machine software. The pressure will be mapped from a strain gauge mat; these
Fixed/Guided Compression
Rate Plate to Plate Stacking Simulation
5mm/min Condition 1 Condition 4
20mm/min Condition 3 Condition 6
Swivel Platen/Unguided Compression
Rate Plate to Plate Stacking Simulation
5mm/min Condition 7 Condition 10
20mm/min Condition 9 Condition 12
Table 1: Testing Conditions used
The stacking simulation indicates that a fixture will be used to simulate the bottom of a
jerrican pressing onto the top instead of the flat compression plate. This was made by filling the
lower section of a jerrican with epoxy to create a ridge fixture. 10 samples were tested in each
Condition. 3 stacking loads were calculated and the deflection at these loads where used for the
comparison. The average deflection at each load for all 80 samples was compared to the average
deflection of the 10 samples for a specific test.
Figure 3: Swivel
3.2.2. Static Stacking test
A stacking test was done to determine the different rates that the jerrican would creep and if
there is a difference depending on the strain rate as shown in the paper by compressive creep in
HDPE [7]. A total of 4 samples were tested in a guided and unguided stacking machine at the
low load and high load. I (?) sample each. This test was performed for an extended period of
time. The deflection was measured at each corner of the compressive plate and the average
Figure 4: Stactic Stacking Machine
3.2.3.Resultant Force
The horizontal component needed to be calculated in order to determine if there was a
significant difference in the resultant load, and the load as found by the compression machine.
Seven samples were used at the two different speeds; the stacking fixture was used to help
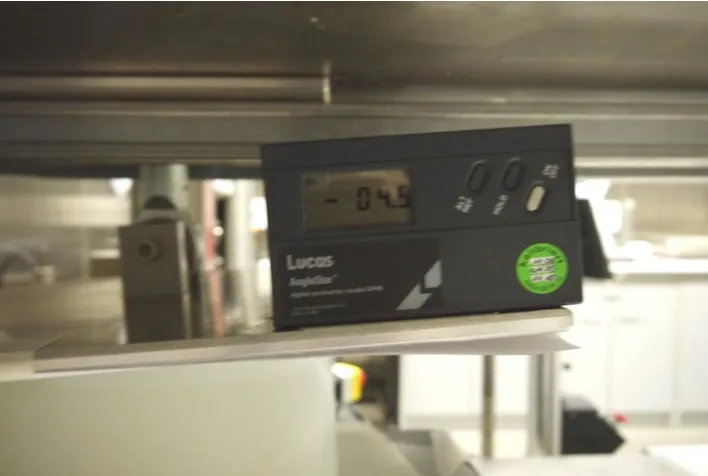
position the samples. The angle was measured and recorded at 10 mm increments. A third order
polynomial was used to fit the trend of the line as shown in Figure 4. This equation was used to
determine the angle at any deflection. The angle as found by the equation was used to calculate
Figure 5: Digital Level
.
3.2.4.Pressure Test
Jerricans were filled with water to 98% brim full capacity. Two samples were tested with
Condition 3, (20 mm/min, guided compression, and no stacking fixture,) two were tested with
Condition 9 (20 mm/min, unguided compression and no stacking fixture) and two samples were
tested with Condition 1 (5 mm/min guided compression and no stacking fixture). A pressure
valve was placed into the side of the jerrican to measure the internal pressure of the package
during loading. From this test it was found that the pressure remained almost the same in both
tests even though the compression tester records a lower load on the swivel platen than on the
fixed platen. The load vs. deflection graphs were plotted with the pressures as shown in Figures
17-19. From this test it was determined that the resultant forces were equal however the
Figure 6: Jerrican with Pressure Valve
3.2.5.Digital Imaging Correlation (DIC)
To determine where the local stresses occur within the jerrican, a digital imaging correlation
(DIC) test was performed. DIC is able to measure the local deformation by using “stereo
photogrammetry” with two cameras. The sample area was painted with an antireflective coating
and then a spray was used to create a pattern on the surface where sub-images called facets could
be tracked. The second camera allows for tracking in all three dimensions. The strain and
displacement parameters for each test are shown below.
Information for Measuring
Front Guided Unguided
Size of facets (x,y) 18 x 18 Pixel 18 x 18 Pixel 18 x 18 Pixel
Distance between facets (x,y) 11 x 11 Pixel 12 x 12 Pixel 12 x 12 Pixel
Number of facets (x,y) 136 x 102 124 x 92 124 x 91
Picture width and height 1624 x 1236 Pixel 1624 x 1236 Pixel 1624 x 1236 Pixel
Temperature 23°C 23°C 23°C
Measuring volume 135mm x 103 mm x 82 mm 135mm x 103 mm x 82 mm 135mm x 103 mm x 82mm
Objective 35mm 35mm 35mm
Measured specimen area 125mm x 100 mm 125 mm x 90 mm 125mm x 100 mm
Figure 7: Digital Imaging Set Up
3.2.6.Positional Study Using a Compression Machine
The position of the jerrican in relationship to the swivel platen was studied to determine how
the forces act when the package is shifted out from center to a controlled offset position. This
was done using a large plotter to print a scale bottom view of a Computer Aided Drawing (CAD)
model of a jerrican. This printing was cut to the size of the plate and placed over the swivel
platen. The stacking fixture was then aligned to the CAD drawing. A total of eleven printings
were created as shown in Figure 8 and at the center position with offset angles of 30 degrees and
Figure 8: Positional Setup
Figure 9: Positions 1-9, 1 cm distance between positions and Image of the bottom of the can with center lines
1
2
3
5
4
6
8
4. DATA ACQUISITION AND ANALYSIS
4.1. Data Analysis
4.1.1. Variable Identification
Variable Definition Units
H Relevant stacking height of Packagings millimeters (mm)
h Height of package millimeters (mm)
C Volume of water Liters (L)
d Density of Transported Substance kilograms per Liter (kg/L)
d.water Density of water kilograms per Liter (kg/L)
d.nitricacid Density of nitric acid kilograms per Liter (kg/L)
m mass of the empty package and components kilograms (kg)
θ Angle of rotation degrees (deg)
M.1 Minimum stacking load Kilonewtons (kN)
M.water Stacking loads for 3-5 meters of water Kilonewtons (kN)
M.nitricacid Stacking loads for 3-5 meters of nitric acid Kilonewtons (kN)
Load.max Maximum load of evaluation Kilonewtons (kN)
Load.min Minimum load Kilonewtons (kN)
Load.med Median Load Kilonewtons (kN)
Length.1 Length of pivot point to plate millimeters (mm)
Fy Vertical compression force Kilonewtons (kN)
Ffx Horizontal force from friction Kilonewtons (kN)
Ry Vertical reaction force Kilonewtons (kN)
Rx Horizontal reaction force Kilonewtons (kN)
H1 N h 7.212 8 9 10 12
416 mm 3 3.328 3.744 4.16 4.992 m 4.1.2. Calculations
The stacking loads were found from the following equation as per ISO 16104 sections 5.3.2.2
M1 = ((H/h) – 1)(C.d.n+m)
The minimum Stacking load was found to be the following,
The force due to loading was found by multiplying the stacking load by acceleration due to
gravity, per below:
The number of jerricans required to meet the minimum height requirement was found according to the following calculation:
The number of jerricans that could occur in the stack was determined to be 7.2-12 cans. For evaluation purposes the height of the stacks is as follows
The maximum height for evaluation was 5 meters, and even though these specific jerricans do not fit perfectly between 3 to 5 meters, this recommendation applies to all packagings that can be subject to the stacking test.
The stacking loads from the previous heights of jerricans were found to do the following
M1 Hh 1
C dwater m
3000mm 416 mm 1
24.25L 1.
kg L
kg
156.841kg
M1 g
156.841kg 9.807 m s2
1.538kN
H h
3000 mm 416 mm
7.212
N H h 8 9 10 12
3000 mm 416 mm
8 9 10 12 7.212 8 9 10 12
Mwater H1h 1
C dwater m
gH1 416 mm 1
24.25L 1.
kg L
kg
3.823kN 1.538kN
2 2.68kN
The density of nitric acid was also used for evaluation to determine the maximum loading that may occur.
The maximum load to be used in the evaluation would occur with a 5 meter stack filled with nitric acid is as follows:
A third point was chosen as the median of the high and low value and was found as the mean of the high and low value
For each of these three loads the corresponding deflections were found.
To determine the resultant force the angle of the plate was recorded. A third order polynomial was fit to the data plot and the equation was found to be.
Given the average deflections for testing Condition 10 the angles were found to be
This equation was used to determine the resultant force that was on the package
The maximum difference would come from the highest angle
Mnitricacid H1h 1
C dnitricacid m
gH1 416 mm 1
24.25L 1.42
kg L
kg
9.807m s2 2.159 2.433 2.78 3.128 3.823 kN
Mnitricacid4 3.823kN
Loadmed Loadmax Loadmin
2
Angle .0002x3 .0149x2.1949x
10 .0002x103 .0149x102.1949x10explicit x10 .0002 11.68 32.38 41.180 3 .0149 11.68 32.38 41.180 2 .1949 11.68 32.38 41.180 0.562 2.521 3.275
A phenomenon that is described in this paper as “lateral shift” can be defined by the following equation. Below are shown the resulting lateral shifts from 1 degree to 9 degrees for the plate that was used.
Lenght137mm
1 3 5 7 9 deg
Lenght 1 tan ( )
0.646 1.939 3.237 4.543 5.86 mm
sin 10
2deg
Loadmax
2
Loadmax2
4.2. Data Products
4.2.1. Graphs
4.2.1.1. Histogram
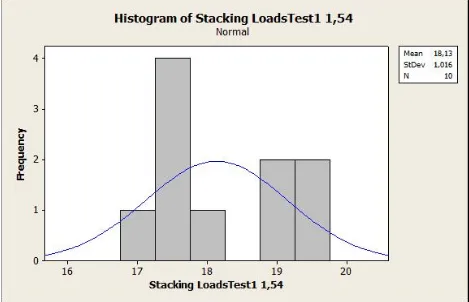
The histograms below show that not enough samples were collected to prove that data would
be normally distributed as is required by the T test. Since the data is impartial we would expect
normally distributed data, in which case the T test could be used. A Mann-Whitney U test was
used since the data did not follow a normal distribution. These values were used for the
[image:32.612.91.560.250.552.2]assessment of the results to determine if the test would yield the same results.
The deflection at each stacking load was compared to the overall average deflection from
every test.
4.2.2.Tables
4.2.2.1. Average deflection at Stacking Loads
Stacking Load (kN) Sample Deflection (mm) Average Deflection (mm) Difference from Average
1.54 kN
Condition 1 17.98
13.73
4.25
Condition 3 18.03 4.31
Condition 4 12.86 -0.87
Condition 6 9.47 -4.26
Condition 7 19.4 5.67
Condition 9 16.13 2.40
Condition 10 11.68 -2.05
Condition 12 9.93 -3.80
2.68 kN
Condition 1 24.92
22.95
1.97
Condition 3 23.73 0.78
Condition 4 22.75 -0.20
Condition 6 17.53 -5.42
Condition 7 26.29 3.34
Condition 9 22.24 -0.71
Condition 10 32.37 9.42
Condition 12 16.93 -6.02
3.83 kN
Condition 1 37.45
36.87
0.58
Condition 3 34.43 -2.43
Condition 4 38.4 1.53
Condition 6 32.87 -4.00
Condition 7 39.97 3.10
Condition 9 36.38 -0.49
Condition 10 41.18 4.31
[image:33.612.67.556.162.587.2]Condition 12 37.37 0.50
4.2.2.2.Positional study
5. DISCUSSION OF RESULTS
5.1. Overall Concerns
Filling the jerricans to 100% brim full capacity requires that they be tilted; this is not
representative of an actually filling process. Section 4.3.3.1 of ISO 16104 says that “no steps
should be taken, by tilting in order to allow water to flow into designed features above the
closures”. Standard operating procedure at Bundersanstalt für Materialforschung
und-Prüfung is to tilt the package. For experimental purposes and to create a worst case scenario
the jerricans were tilted during the filling process resulting in the 98% brim full capacity to
be 24.24 liters.
The position of the jerrican in the compression tester is critical, any movement off center
will change how the swivel platen shirts and settles into a position. The greatest error was
found in Sample 10, in which it was very difficult to control the center position of the
Positional study deflections at Stacking Loads
Minium Load 1.54 kN Median Load 2.68 kN Max Load 3.82 kN
1 7.67 30.00 38.00
2 9.00 30.33 38.33
3 8.67 30.33 37.67
4 9.00 17.00 36.00
5 9.67 16.00 37.00
6 10.00 17.00 36.67
7 9.33 19.00 34.67
8 9.33 15.67 32.67
9 10.67 19.33 33.33
30 7.67 17.33 40.00
60 9.00 17.33 39.33
Minimum Load 1.54 kN Median Load 2.68 kN Max Load 3.82 kN
Max 10.67 30.33 40.00
Average 9.09 20.85 36.70
Minimum 7.67 15.67 32.67
Range 3.00 14.67 7.33
[image:34.612.72.545.146.454.2]Standard Deviation 0.90 6.12 2.35
jerrican. To better understand this process a positional study was developed to show the
effects of moving the package out from the perfect center of the swivel platen. This test is
further described in Section 5.7. The pressure mat was used to show how the jerrican would
respond to the force from the different types of compression. It was desired to export the load
variance over time data for each cell to understand how the force is translated through the
package. The limitations of the software and equipment made this impossible. Another limit
of the software was the inability to record videos of the pressure mat as a load is applied. A
screen capture program was used to record the videos. The pressure mat is able to interpret
the area by the number of activated cells and determines the load by the collective resistance
that is in each cell, in order to make an appropriate calibration an actual jerrican needs to use.
Initially calibration was performed by using a large rigid plate to which a load was applied
and calibrated. A calibration also needs to run at the maximum load so the software can set
the appropriate scale. This also leads to an issue in which the mat interpolates all other loads,
when there may not be a linear relationship. After multiple uses the mat became damaged,
and some of the cells no longer read. This voids the initial calibration file because cells that
were receiving a load are no longer able to read, so the overall load will be lower than what is
read from the compression machine. Other failures included a slight fold in the mat that
would cause a row cell to all be activated. The initial testing shows that the mat is an
excellent tool for the visual comparison, but the load is more accurately read from the load
cells from the compression machine. Because of these limitations and errors it would be
impossible to compare the results of the pressure mat from one sample to another as
accurately as the values from the load cells on the compression machine. Another attempt at
calibrating the mat for use was done by filling a jerrican with sand.
The first set of experiments were run at the slow speed of 5 mm/min. This was done so that
the product would not receive any shock from the weight being loaded. After all four testing
Conditions were run at 5 mm/min there was sufficient evidence that the different
configurations of the testing Conditions would affect the results. To determine if the rate of
dynamic loading had any effect on the initial deflection the 20 mm/min rate was run next.
After completing testing Conditions 7,9,10 and 12 it was found that the compression rate did
make a difference to the deflections at the different stacking loads. However this difference
The compression machine used for the dynamic stacking test has a total of three loads cells
on the underside of the bottom compression plate. These load cells captured the vertical force
that is applied as a reaction from the package being tested. As the unguided compression
starts to rotate the vertical component of the resultant force is measured. This will be an issue
for any person using a load cell to capture data with a swivel platen because the horizontal
component or components will be lost. This results in a higher load being applied to the
package when there is any rotation in the swivel platen and a horizontal load is applied.
Evidence from the pressure tests that were performed shows that the same pressure was
found in both the unguided and guided compression. The pressure is equal to the force
divided by the area. The area is the area of the valve and since the same valve was used in
each sample the force is also the same. It was found that the resultant force was under 6N and
could be ignored. Also the horizontal components will not contribute to vertical deflections
unless the package began to buckle. Given the short rigid structure it is unlikely that any
buckling took place and the horizontal components could be neglected, and only the vertical
components were used to calculate the deflection.
5.2. Dynamic Stacking Test
5.2.1.Condition 1, 5mm/min, Guided Compression, and no Stacking fixture
Condition 1 was performed at the slow speed of 5 mm/min, guided compression and no
stacking fixture. The Table below shows a summary of the results of the deflections at the
selected stacking loads for all 10 samples.
Minimum Load 1.54 kN Median Load 2.68 kN Max Load 3.82 kN
Max 19.584 mm 26.167 mm 38.500 mm
Average 17.983 mm 24.917 mm 37.450 mm
Minimum 16.833 mm 23.583 mm 35.334 mm
Range 2.751 mm 2.584 mm 3.167 mm
Standard Deviation 0.998 mm 0.945 mm 1.014 mm
The average deflections from test Condition 1 were compared to the average deflections from
all 80 samples. Table 7 shows the average deflections from all Conditions and the average
deflections of Condition 1. Condition 1 resulted in higher deflections at every stacking load; with
a convergence as it approached higher loads.
5.2.2.Condition 3, 20 mm/min, Guided Compression, no Stacking Fixture
Condition 3 was performed at the fast speed of 20 mm/min using guided compression and no
stacking fixture. Below is a Table of the summary of the ten samples.
Minimum Load 1.54 kN Median Load 2.68 kN Max Load 3.82 kN
Max 18.334 mm 24.000 mm 36.000 mm
Average 18.033 mm 23.733 mm 34.433 mm
Minimum 17.667 mm 23.333 mm 33.000 mm
Range 0.667 mm 0.667 mm 3.000 mm
Standard Deviation 0.292 mm 0.211 mm 0.982 mm
Table 8: Condition 3 summary
Loads All tests average Condition 3 Difference
1.54 kN 14.43 mm 18.03 mm -3.60 mm
2.68 kN 23.37 mm 23.73 mm -0.37 mm
3.83 kN 37.26 mm 34.43 mm 2.82 mm
Table 9: Condition 3 compared to all tests
As shown in Table 9 the average deflections of Condition 3 were greater at the low and
median load. However the deflection was significantly lower at that maximum loading value.
It’s important to notice the rate of change that applies to Condition 3. The deflections start out
much higher than the average from all testing Conditions and then fall much lower at high loads.
The standard deviation also increased at the higher loads showing that the deflection is more
sporadic at higher loads with this method. The distribution from this test is shown in Appendix
9.2,
Loads All tests average Condition 1 Difference
1.54 kN 14.43 mm 17.98 mm -3.55 mm
2.68 kN 23.37 mm 24.92 mm -1.55 mm
3.83 kN 37.26 mm 37.45 mm -0.19 mm
5.2.3.Condition 1 Compared to Condition 3
The variable between Condition 1 and 3 is the rate at which the weight is applied. Where
Condition 1 is loaded at the slow speed of 5 mm/min and Condition 3 is loaded at the fast rate of
20 mm/min. both tests were performed with guided compression and no stacking fixture. At the
minimum load the deflections are almost identical however at the median and maximum load
Condition 3 had lower deflections. The difference comes from the material not having as much
time to expand. At the first loading the fixed plate is pushing in on the handle, collapsing the
handle and the 2% of head space. Once the head space has collapsed the liquid is required to
support the load, Water can be considered an incompressible fluid so the liquid is able to support
the load. At the greater speeds the material yields less and thus the volume change isn’t has great
causing higher loads to occur at lower deflections. It was expected that the faster speed would be
a more extreme test and would cause lower loads, and faster failure. This did not occur, as the
package was given less time to expand and caused the deflections to decrease at the stacking
loads.
Load Condition 1 Condition 3 Difference
Minimum Load 1.54 kN 17.983 mm 18.033 mm -0.050 mm
Median Load 2.68 kN 24.917 mm 23.733 mm 1.184 mm
Maximum Load 3.82 kN 37.450 mm 34.433 mm 3.017 mm
Table 10: Condition 1 and 3
Given the standard deviations of the deflections at each loading and the non-parametric
distribution the Mann-Whitney U test have the results shown below. The Mann-Whitney U test
gave the following percentages as the likelyhood of these tests yielding the same results
Mann Whitney U test Condition 1 and Condition 3
Minimum Load 1.54 kN 76.24%
Median Load 2.68 kN .58%
Maximum Load 3.82 kN .02%
Table 11: Statistcal realtionship Condition 1 and 3
This shows that by changing the rate of loading with fixed plates and no stacking fixture
there is no difference for the minimum of loading. However as the load the increases the chance
of the test being related decreases to an insignificant amount, indicating the tests is non-similar
5.2.4.Condition 4, 5 mm/min, Guided Compression, Stacking fixture
Condition 4 was tested at the slow speed of 5 mm/min with guided compression and a
stacking fixture as shown in Figure 2 to simulate the nesting of the jerricans.
Minimum Load 1.54 kN Median Load 2.68 kN Max Load 3.82 kN
Max 14.001 mm 23.250 mm 38.751 mm
Average 12.855 mm 22.746 mm 38.396 mm
Minimum 11.750 mm 21.584 mm 37.917 mm
Range 2.251 mm 1.667 mm 0.834 mm
Standard Deviation 0.570 mm 0.516 mm 0.328 mm
Table 12: Summary of Condition 4
Loads All tests average Condition 4 Difference
1.54 kN 14.43 mm 12.86 mm 1.57 mm
2.68 kN 23.37 mm 22.75 mm 0.62 mm
3.83 kN 37.26 mm 38.4 mm -1.14 mm
Table 13: Condition 4 compared to all test.
As demonstrated in Table 13 the deflections were lower for the low loading with a slightly
lower deflection at the medium loading and higher deflection at the high loading value. The rate
of change is again different than the average; where lower deflections occur at the low loads and
greater deflections at the high loads. Initially the stacking fixture increases the load bearing area.
This will cause the loads to be reached faster resulting in lower deflections. Once the stacking
fixture is pressed into the package the area is the same as it would be without the stacking fixture
causing the load to drop slightly under the average.
5.2.5.Condition 1 Compared to Condition 4
The variable between Condition 1 and Condition 4 is the use of a stacking fixture. Both
Conditions were tested at 5 mm/min and guided compression.
Load Condition 1 Condition 4 Difference
Minimum Load 1.54 kN 17.983 mm 12.855 mm 5.129 mm
Median Load 2.68 kN 24.917 mm 22.746 mm 2.170 mm
Maximum Load 3.82 kN 37.450 mm 38.396 mm -0.946 mm
Table 14: Comparison Condition 1 and Condition 4
At the low and medium stacking loads a much lower deflection is needed to cause the same
load. This is due to the stacking fixture increasing the area in which the load is applied, for this
deflection due to low structural integrity. The use of the stacking fixture places the load where
the package is intended to support it. The stacking fixture better simulates actual products
stacked on top of each other. At the high loadings, once the compression has reached a point
under both Conditions where the compression plate is in full contact with the jerrican the
deflections are becoming more similar. Despite the two tests becoming more similar the stacked
fixture required more deflection at the high load opposite to having less deflection at the low and
medium load.
Mann Whitney U test Condition 1 and Condition 4
Minimum Load 1.54 kN .02%
Median Load 2.68 kN .02%
Maximum Load 3.82 kN 5.39%
Table 15: Statistcal realtionship 1 and 4
The U tests shows that there is no relationship at the low and medium loads and very little
relationship at the higher loads. This shows that the addition of the stacking fixture once again
changes the results and it is improbable that the tests will yield similar results.
5.2.6.Condition 6, 20 mm/min, Guided Compression, Stacking fixture
Condition 6 was run at the fast speed of 20 mm/min with guided compression and with the
use of a stacking fixture. All of the samples were able to reach the maximum load and all
samples were included in the evaluation.
Minimum Load 1.54 kN Median Load 2.68 kN Max Load 3.82 kN
Max 10.667 mm 18.666 mm 34.667 mm
Average 9.468 mm 17.534 mm 32.868 mm
Minimum 8.333 mm 16.010 mm 31.001 mm
Range 2.334 mm 2.656 mm 3.667 mm
Standard Deviation 0.849 mm 0.832 mm 1.187 mm
Table 16: Condition 6 summary
Loads All tests average Condition 6 Difference
1.54 kN 14.43 mm 9.47 mm 4.96 mm
2.68 kN 23.37 mm 17.53 mm 5.84 mm
3.83 kN 37.26 mm 32.87 mm 4.39 mm
Table 17: Condition 6 compared to all tests
Condition 6 resulted in lower deflections at each loading interval. The least amount of
deflection overall was observed in Condition. This shows that the load is reached much faster
under these Conditions than any other method.
5.2.7.Condition 4 Compared to Condition 6
Both Conditions were performed with guided compression and a stacking fixture. The
variable between these two tests was the rate at which the weights were loaded. Condition 4 was
loaded at 5 mm/min and Condition 6 was loaded at 20 mm/min. This is similar to section 5.2.3
where Conditions 1 and 3 were compared; as the speed is the variable between the two different
testing Conditions.
Load Condition 4 Condition 6 Difference
Minimum Load 1.54 kN 12.855 mm 9.468 mm 3.387 mm
Median Load 2.68 kN 22.746 mm 17.534 mm 5.212 mm
Maximum Load 3.82 kN 38.396 mm 32.868 mm 5.529 mm
Table 18: Condition 4 compared to Condition 6
Unlike Table 10 that compares Condition 1 to Condition 3 where the difference is almost
insignificant at low loads, the difference between Condition 4 and Condition 6 is significant at all
loads. Conditions 1 and 3 were similar due to the handle being crushed at low loads. The use of
the stacking fixture doesn’t compress the handle, eliminating the earlier similarity.
Mann Whitney U test Condition 4 and Condition 6
Minimum Load 1.54 kN .02%
Median Load 2.68 kN .02%
Maximum Load 3.82 kN .02%
Table 19: Statiscal realtionship 4 and 6
The U test shows no relationship between these two tests. Table 19 shows the U test results
from Condition 1 and 3. Contrary to the high relationship that occurred at the low loading, no
compression. It was expected that this comparison would be the same as the comparison between
Condition 1 and 3. The comparison of Conditions 4 and 6 showed no relation at any loads.
5.2.8.Condition 7, 5 mm/min, Unguided Compression, no Stacking Fixture
Condition 7 was performed at the slow speed of 5 mm/min on a swivel platen without the
usage of a stacking fixture. This test did not run as easily as the guided compression, as some of
the samples did not reach the 150 mm extension, requiring them to be disregarded from the
results. Additional samples were tested; Condition 7 had a total of nine samples that were able to
be used for comparison.
Minimum Load 1.54 kN Median Load 2.68 kN Max Load 3.82 kN
Max 21.167 mm 28.084 mm 41.584 mm
Average 19.398 mm 26.287 mm 39.972 mm
Minimum 18.167 mm 25.417 mm 38.250 mm
Range 3.000 mm 2.667 mm 3.334 mm
Standard Deviation 1.045 mm 0.956 mm 1.047 mm
Table 20: Condition 7 summary
Loads All tests average Condition 7 Difference
1.54 kN 14.43 mm 19.4 mm -4.97 mm
2.68 kN 23.37 mm 26.29 mm -2.92 mm
3.83 kN 37.26 mm 39.97 mm -2.71 mm
Table 21: Condition 7 compared to all tests
The average deflection of the Condition 7 results were greater than the average, meaning the
lesser load is required to cause failures, and that Condition 7 is more extreme than the average
test. It is expected the swivel plate will find the weakest part of a package so it is expected that
the deflections would be higher. Histograms of Condition 7 can be found in Section 9.2
5.2.9.Condition 1 Compared to Condition 7
Condition 1 and Condition 7 were both performed at the slow speed of 5 mm/min and with
no stacking fixture. The variable was the type of compression being performed, as either guided
Load Condition 1 Condition 7 Difference
Minimum Load 1.54 kN 17.983 mm 19.398 mm -1.415 mm
Median Load 2.68 kN 24.917 mm 26.287 mm -1.370 mm
[image:43.612.75.548.518.620.2]Maximum Load 3.82 kN 37.450 mm 39.972 mm -2.522 mm
Table 22: Condition 1 compared to Condition 7
As shown by Table 22 the swivel platen needed more deflection to reach the same loads,
suggesting that the swivel platen found the weakest part of the package
Mann Whitney U test Condition 1 and Condition 7
Minimum Load 1.54 kN 6.62%
Median Load 2.68 kN 4.12%
Maximum Load 3.82 kN .09%
Table 23: Statiscal realtionship 1 and 7
The U test also showed that there is little relationship between the two common tests with the
variable being the type of compression. At the lower stacking loads the swivel platen doesn’t
rotate significantly. If no rotation occurs, the test Conditions would be the same. It was expected
that the average deflection from the swivel plate would be greater than the deflection from the
guided compression plate, which was confirmed.
5.2.10. Condition 9, 20 mm/min, Unguided Compression, Stacking Fixture
Condition 9 was run at the fast speed of 20 mm/min and unguided compression without the
use a stacking fixture. A total of 10 samples were run with samples 4 and 9 being rejected due to
the specimen slipping out before the compression was able to reach 150 mm. The remaining
samples were analyzed and results are shown in the below Table.
Minimum Load 1.54 kN Median Load 2.68 kN Max Load 3.82 kN
Max 16.334 mm 22.669 mm 37.334 mm
Average 16.125 mm 22.417 mm 36.375 mm
Minimum 15.667 mm 22.000 mm 35.000 mm
Range 0.667 mm 0.669 mm 2.334 mm
Standard Deviation 0.248 mm 0.296 mm 0.677 mm
Loads All Tests average Condition 9 Difference
1.54 kN 14.43 mm 16.13 mm -1.70 mm
2.68 kN 23.37 mm 22.24 mm 1.13 mm
3.83 kN 37.26 mm 36.38 mm 0.88 mm
Table 25: Condition 9 compared to all tests
Condition 9 required more defection at the initial low loading than the All Test average.
5.2.11. Condition 7 Compared to Condition 9
The comparison of these two Conditions will be similar to the comparison of Condition 1 and
3 made in Section 5.2.3, as the variable between these two tests is the compression rate at which
the test was performed. In this case both tests were done using an unguided platen and no
stacking fixture.
Load Condition 7 Condition 9 Difference
Minimum Load 1.54 kN 19.398 mm 16.125 mm 3.273 mm
Median Load 2.68 kN 26.287 mm 22.417 mm 3.870 mm
Maximum Load 3.82 kN 39.972 mm 36.375 mm 3.597 mm
Table 26: Condition 7 compared to Condition 9
The faster speed once again required less deflection for the desired load to be reached and in
every case a higher deflection was needed with the slower speed.
Mann Whitney U test Condition 7 and Condition 9
Minimum Load 1.54 kN .06%
Median Load 2.68 kN .06%
Maximum Load 3.82 kN .06%
Table 27: Statitscal realtionship 7 and 9
The U test showed that these two tests are not comparable, at any of the stacking loads. Table
10 indicates the U test of Conditions 1 and 3 will most likely yield similar results at low loads.
However by varying the speed with a swivel platen there is no relationship even at the low loads.
This was unexpected since the rotation of the plate doesn’t depend on the speed and at low loads
there is little rotation. From those observations it was expected that the low load would have a
high relationship.
5.2.12. Condition 10, 5 mm/min Unguided Compression, Stacking Fixture
Condition 10 was performed at the slow compression rate of 5 mm/min with the use of the
observed that many of the samples slipped out from under plate and often times removing the
stacking fixture from the swivel platen. Ten samples were tested, Specimens 1,2,3,6,7,8,9,10
were all discarded as outliers or the samples slipped out from under the platen before the
minimum deflection of 150 mm was reached. Additional samples were tested as part of the
testing in Section 5.4. The corrected results are shown in Table 28
Minimum Load 1.54 kN Median Load 2.68 kN Max Load 3.82 kN
Max 13.417 mm 33.334 mm 43.417 mm
Average 11.680 mm 32.375 mm 41.180 mm
Minimum 11.167 mm 31.167 mm 39.916 mm
Range 2.250 mm 2.167 mm 3.501 mm
[image:45.612.68.548.188.301.2]Standard Deviation 0.864 mm 0.864 mm 1.332 mm
Table 28: Summary of Condition 10
It is observed that the median loading is where the results were the most inconstant and the
sample set had more repeatable values at the low and high loads. This was due to the fact that
the floating plate would tend to settle around this loading.
Loads All tests average Condition 10 Difference
1.54 kN 14.43 mm 11.68 mm 2.75 mm
2.68 kN 23.37 mm 32.37 mm -9.01 mm
3.83 kN 37.26 mm 41.18 mm -3.93 mm
Table 29: Condition 10 compared to all tests
Condition 10 had similar results to the average deflection at the low loads but had greater
defections at the medium and low loads. The maximum deflections came from Condition 10,
sample 8.
5.2.13. Condition 4 Compared to Condition 10
The difference between these was the type of compression used, similar to the comparison of
Condition 1 and Condition 7. Both Condition 4 and Condition 10 were performed at the slow
compression rate with the use of the stacking fixture. The variable is the type of compression that
was used.
Load Condition 4 Condition 10 Difference
Minimum Load 1.54 kN 12.855 mm 11.680 mm 1.174 mm