City, University of London Institutional Repository
Citation
:
Kovacevic, A. and Stosic, N. (2016). CFD Analysis of Oil Flooded Twin Screw
Compressors. Paper presented at the 23rd International Compressor Engineering
Conference, 11-14 Jul 2016, Indiana, USA.
This is the accepted version of the paper.
This version of the publication may differ from the final published
version.
Permanent repository link:
http://openaccess.city.ac.uk/15130/
Link to published version
:
Copyright and reuse:
City Research Online aims to make research
outputs of City, University of London available to a wider audience.
Copyright and Moral Rights remain with the author(s) and/or copyright
holders. URLs from City Research Online may be freely distributed and
linked to.
City Research Online:
http://openaccess.city.ac.uk/
publications@city.ac.uk
1023, Page 1
CFD Analysis of Oil Flooded Twin Screw Compressors
Sham RANE*, Ahmed KOVACEVIC, Nikola STOSIC
City University London, Centre for Compressor Technology,
London, EC1V 0HB, UK
sham.rane@city.ac.uk
* Corresponding Author
ABSTRACT
Modelling of screw compressors using Computational Fluid Dynamics (CFD) offers better insight into the working chamber of twin screw machines when compared with chamber models. As shown by authors in earlier publications, CFD models predict performance of dry gas and refrigeration compressors fairly accurately. However numerical flow models used for modelling of oil flooded twin screw compressors are still at the development stage. This is mainly due to the lack of understanding of the flow complexity and the techniques used for solving coupled equations that represent interactions between the gas and the oil in such machines.
This paper presents the modelling approach used for calculation of the performance of an oil flooded screw compressor. It requires a structured numerical mesh which can represent all moving parts of the compressor in a single numerical domain. Such mesh is generated by SCORGTM using novel boundary distribution technique called
casing-to-rotor conformal boundary mapping. A test oil injected twin screw compressor with rotor configuration 4/5 and 127 mm main rotor diameter was measured in the compressor rig of the Centre for Compressor Technology at City University London. Measurements of the chamber pressure history and integral parameters of the compressor such as mass flow rate of gas and oil, indicated power and temperatures are used for the comparison with CFD results. The analysis showed a close match in the prediction of the mass flow rates of gas. The indicated power obtained by CFD predictions matched well with the measured shaft power. The model provided an exceptional visualization of the interaction of gas and oil inside the compression chamber. The mixing of the phases, distribution of oil, heat transfer between gas and oil and also effects on sealing due to high oil concentration in leakage gaps were well captured.
1. INTRODUCTION
1023, Page 2
Figure 2 shows an example of the oil injection ports. It is possible to have oil injection systems where the compressor discharge pressure is utilized to inject the oil. In order to improve reliability or to account for high variations in loading many systems use an independent oil pumping system which often provides better control of oil injection but comes at the cost of additional power loss. It is essential to have a guideline for a compression system to vary the oil injection pressure for varying rotor speed or discharge pressure and a computational model can effectively provide this type of data. Additionally the oil temperature at the point of injection is important in achieving effective heat transfer.
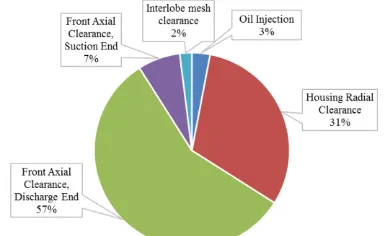
Figure 1: Oil power loss contributions in leakages (Reproduced from Deipenwisch and Kauder, 1999)
[image:3.612.72.541.308.460.2]If the oil temperature is very close to the gas temperature at injection point then there will be low convection; if the oil temperature is very low compared to gas temperature then due to a short residence time in the compression chamber, the heat transfer will continue in the discharge port thus increasing the load on the oil cooling heat exchanger downstream, without any benefit inside the compression chamber. It is required to develop a computational model that can provide a complete description of the flow process inside the oil flooded compression chamber for its design and optimisation.
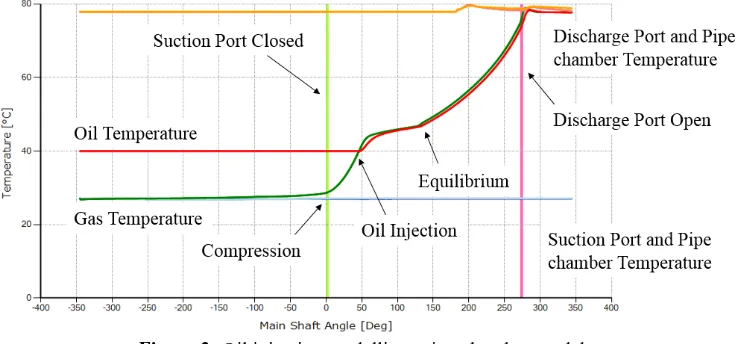
Figure 2: Oil injection ports and injection angle on a compression volume curve
1023, Page 3
2. APPROACHES FOR MODELLING OIL INJECTION IN SCREW COMPRESSORS
2.1 Thermodynamic chamber model approach
Stošić et al. (1992, 2005) have presented an oil injected twin screw compressor model by considering the working chamber, suction and discharge process as an open thermodynamic system; mass flow varying with time and gas defined via equation of state. In such type of lumped parameter models, oil droplets are assumed to have a mean Sauter diameter and the heat exchange between the spherical droplets and the gas via convection can be balanced with the droplet temperature rise. The differential form of this energy balance is given as Equation 1.
𝑑𝑇𝑜𝑖𝑙
𝑑𝜃 =
ℎ𝑜𝑖𝑙𝐴𝑜𝑖𝑙(𝑇𝑔𝑎𝑠− 𝑇𝑜𝑖𝑙)
𝜔𝑚𝑜𝑖𝑙𝑐𝑜𝑖𝑙
Using, 𝑁𝑢 = 2 + 0.6 𝑅𝑒0.6𝑃𝑟0.33 , heat transfer coefficient for Stokes flow. And integration of the equation gives the oil droplet temperature at each time step.
𝑇𝑜𝑖𝑙 =
𝑇𝑔𝑎𝑠− 𝑘 𝑇𝑜𝑖𝑙,𝑝
1 + 𝑘
𝑇𝑜𝑖𝑙,𝑝 is the oil droplet temperature at the previous time step.
𝑘 = ∆𝑡𝜏 = 𝜔𝜏∆𝜃 , with = 𝑚𝑜𝑖𝑙𝑐𝑜𝑖𝑙
ℎ𝑜𝑖𝑙𝐴𝑜𝑖𝑙 , being the non-dimensional time constant of the droplet.
For a given mean Sauter diameter 𝑑𝑠, the non-dimensional time constant 𝑘 is
𝑘 = 𝜔𝑚𝑜𝑖𝑙𝑐𝑜𝑖𝑙 ℎ𝑜𝑖𝑙𝐴𝑜𝑖𝑙∆𝜃=
𝜔𝑑𝑠𝑐𝑜𝑖𝑙
6ℎ𝑜𝑖𝑙∆𝜃
(1)
[image:4.612.123.493.405.577.2]If 𝑘 tends to zero, the oil and gas temperatures will be equal, while for finite values of 𝑘, the gas and oil temperatures will differ. The above described approach is based on the assumption that the oil-droplet time constant 𝜏 is smaller than the droplet travelling time through the gas before it hits the rotor or casing wall, or reaches the compressor discharge port.
Figure 3: Oil injection modelling using chamber models
This means that the heat exchange is completed within the droplet residence time through the gas during the compression process. This prerequisite can be fulfilled by appropriate atomization of the injected oil which produces sufficiently small droplet sizes producing sufficiently small droplet time constant, as well as by choosing adequate nozzle angle and to some extent the initial oil spray velocity. Figure 3 shows a representative result of the gas and oil temperature variation calculated using a multi-chamber thermodynamic model.
2.2 CFD approach using source term formulations
1023, Page 4
𝜕
𝜕𝑡∫ 𝜌𝜙𝑑𝛺𝛺 + ∫ 𝜌𝜙𝒗. 𝒏𝑑𝑆 =𝑆 ∫ 𝛤 𝑔𝑟𝑎𝑑 𝜙. 𝒏𝑑𝑆𝑆 + ∫ 𝑞𝛺 𝜙𝑑𝛺 (2)
where, 𝛺 is the volume of CV, S is the surface enclosing this CV, 𝒏 is the unit vector orthogonal to S and directed outwards, 𝒗 is the fluid velocity inside CV in a fixed coordinate system, 𝜌 is fluid density and 𝑡 is time. Here, the transient term represents rate of change of property 𝜙 in CV, the convection term accounts for the net advective transport of 𝜙 across surface S and diffusive transport is described by the gradient. 𝛤 is the diffusivity for the quantity
𝜙 while 𝑞𝜙 represents source or sink of 𝜙 in the CV. In the approach of modelling oil injection using source term
formulation, it is possible to model the thermal and sealing effects of the injected oil while still calculating the main flow field as a single gas phase. Even in conditions where the mass of injected oil is 10 times the mass of gas, the volume occupied by oil to that of gas is in the order of 1:100. Hence a passive scalar transport equation can be solved to model the distribution and mixing of oil in the gas. The numerical solver will solve for continuity of the gas, its x, y and z momentum components and total energy equation while the physical effects of oil injection will come from
𝑞𝜙 applied at the oil concentration regions calculated by passive scalar transport or at selected regions of the domain.
Thermal effect: The source term formulation for energy equation is such that if the gas temperature exceeds the injection oil temperature, an energy sink will become active. The assumption in this approach is that the heat transfer between gas and oil is instantaneous and the mass of oil is sufficient enough to completely get into thermal equilibrium with the gas. This energy source can be limited to the rotor domains and defined as in Equation 3.
𝑞𝑒= 𝜌𝐶𝑝
𝜕𝑡 (𝑇𝑔𝑎𝑠− 𝑇𝑜𝑖𝑙), 𝑞𝑒_𝑐= 𝜕 𝜕𝑇{
𝜌𝐶𝑝
𝜕𝑡 (𝑇𝑔𝑎𝑠− 𝑇𝑜𝑖𝑙)} (3)
𝑞𝑒_𝑐 is a source coefficient and is required in order to linearize the source in discretized equations. 𝑇𝑜𝑖𝑙 is set at the oil
[image:5.612.62.558.432.606.2]injection temperature. The source term is such that if the gas temperature exceeds oil injection temperature, heat is removed from the computational cell. In this case a lower temperature limit source is required to stabilize the solution process. Figure 4a presents the temperature field in the rotor domain produced by such an energy source formulation. As seen the gas temperature is almost clipped to the oil injection temperature everywhere in the domain after the compression process begins. A careful calibration of such formulation is required to get basic results such as pressure rise and indicated power from the analysis. The accurate prediction of gas temperature rise and oil losses is challenging and dependant on the calibration of the source term.
Figure 4: CFD approach for oil injection with source formulations
Sealing effect: A momentum source term in x, y, and z direction can be added to the momentum transport equations. The formulation is presented in Equation 4 and it can be applied in the leakage gaps to reduce the velocity of the gas.
𝑞𝑢= 12 𝜕𝑡𝜌(|𝑢| 𝑢), 𝑞𝑢_𝑐 = 𝜕𝑢𝜕 { 12 𝜕𝑡𝜌(|𝑢| 𝑢)}
𝑞𝑣= 12 𝜕𝑡𝜌(|𝑢| 𝑣), 𝑞𝑣_𝑐 = 𝜕𝑣𝜕 { 12 𝜕𝑡𝜌(|𝑢| 𝑣)}
𝑞𝑤= 12 𝜕𝑡𝜌(|𝑢| 𝑤), 𝑞𝑤_𝑐= 𝜕𝑤𝜕 { 12 𝜕𝑡𝜌(|𝑢| 𝑤)}
1023, Page 5
Cell volume parameter is utilized in order to mask the region that are in the leakage gaps using a dynamic masking function since the rotor domain is deforming and cell volumes move with time between the main domain and the leakage gaps. This method may make the solver unstable with the increase in the discharge pressure which results in the higher pressure gradients across the gaps. An alternative approach is to identify cells in the clearance gaps and modify the molecular viscosity of the gas such that it is close to that of the oil. The increase in viscosity results into the added flow resistance thus imitating the sealing effect of injected oil. This method has a limit to which the viscosity could be increased due to solver stability issues. Figure 4b shows the use of a local viscosity function. The resulting influence on the flow rate is shown in Figure 4c. The improvement in the air flow rate in comparison to a case without viscosity function was observed but it was not sufficient to match the measurements. Similar to the momentum source terms, the viscosity function affects solver stability when the increase in artificial viscosity exceeds 3-4 orders of the gas viscosity.
2.3 CFD approach using Multi-phase models
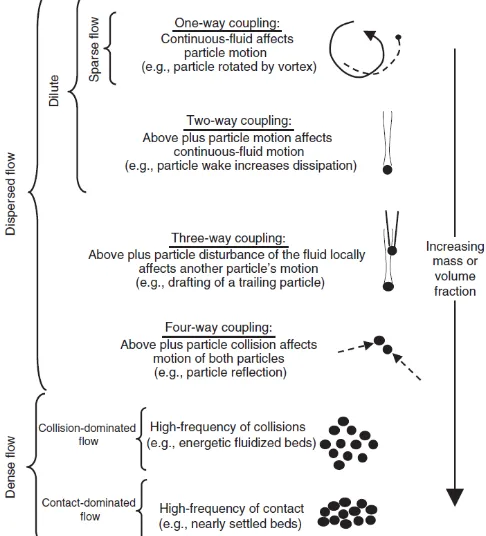
The complexity of the flow inside the compressor flow domain makes modelling challenging since variety of flow regimes can occur within the process. The oil injection itself starts as a spray formation. Before or after breakup the rotor surface is impinged with oil and oil film is formed. The film grows and spreads until the injection nozzle is cut-off from the compression chamber by the rotors trailing lobes. Further rotation causes flooding on the chamber whose volume is continuously reducing and squeezing the oil contained. In order to capture all these effects a top level model is required that can account for large changes in oil volume fraction. The applicable multiphase modelling treatment depends on the phase coupling effects that are necessary to be accounted for, as shown in Figure 5.
[image:6.612.76.319.320.588.2]Crowe et al. (2006) has presented a detailed characterization of multiphase flow regimes based on the various coupling effects between the continuous and the dispersed phases. If the dispersed phase quantity is very low and the phase particles are very fine with negligible momentum then the compressed gas is treated as the continuous phase and oil droplets as particles in the Lagrangian frame with just one way coupling, i.e. oil will move with the flow and heat transfer between phases will occur. Such a computational model has five transport equations for the gas phase and one momentum (motion kinematics) equation for the liquid phase that needs to be conserved. On the other end of the spectrum is the condition of heavily oil flooded operation. In addition to the oil droplets, oil film on the rotor and housing will occur resulting in oil being dragged along with the compressed gas. Under such conditions, Eulerian – Eulerian treatment for both the gas and oil phases is required; both can be continuous phases with energy, momentum interphase transfer effects. Such a computational model is the most expensive and has five transport equations for each of the gas and oil phases. The pressure field solution is shared by the two phases and the independent momentum equations can calculate relative slip and shear between the gas and oil.
Figure 5: Flow conditions based on interphase couplings
1023, Page 6
3. GRID GENERATION FOR OIL INJECTED SCREW ROTORS
[image:7.612.76.533.201.371.2]By applying the principles of analytical grid generation through transfinite interpolation with adaptive meshing, the authors have derived a general, fast and reliable algorithm for automatic numerical mapping of arbitrary twin screw machine geometries. The procedure of analytical grid generation of screw machine working domain is explained in Kovačević (2002). In order to achieve a conformal single domain mesh, a new approach of background blocking has been presented in Rane (2015). In this procedure, outer boundary in each background block is defined as a combination of the rack segment and the casing circle segment. The rack segment stretches between the lower and higher cusp points and is closed by the casing as shown in Figure 6. The distribution obtained on the outer boundaries of the two blocks is used as the reference for the rotor profile distribution.
Figure 6: Background blocking and distribution on the main and gate rotors
[image:7.612.103.510.512.647.2]Since the blocks of the main and gate rotors are obtained separately, the intersection points obtained on the common rack curve from the two blocks can be different. If different the resulting mesh has a non-conformal map between the two rotor blocks. Using the blocking approach it is possible to transform this boundary map into a conformal boundary map. The surface mesh on the interlobe surface mostly follows the axial grid lines with small transverse movements in the vicinity of the cusp points. The movements of points are along the surface of the interface and do not cause any irregularity of cells. This implementation allows for a fully conformal interface with the equal index around cusp points to ensure accurate capturing is the blow hole leakage area. The blocking approach is in more detail explained in Rane (2015). It allows both conformal and non-conformal boundary map to produce fully hexahedral 3D grid with both, the main and the gate rotor surfaces smoothly captured. The surface mesh on the casing is of the highest quality with the regular quadrilateral cells.
Figure 7: Grid generated with single domain for the main and gate rotors
1023, Page 7
4. CASE STUDY
The test compressor used for this study is an oil flooded twin screw compressor with a combined axial and radial suction and an axial discharge ports. The male rotor has four lobes and the female rotor has five lobes with ‘N’ profiles. The nominal interlobe, radial and axial leakage gaps are 60 µm. The built-in volume index Vi of the compressor is 3.6. The main rotor
diameter is 127.0mm and the wrap angle is 306°.
The operating speed of the machine is between 3000 rpm and 6000 rpm, discharge pressure can vary between 4.0 bar and 12.0 bar. Measurements at few operating points were carried out at the air compressor test rig at City University London and the results have been used in this paper for comparison with CFD model predictions. The compressor is driven by a 75kW motor with a variable frequency drive for speed control. The discharge pressure is controlled by a valve and gas flow is measured using an orifice in the discharge line. In the current setup oil is injected using the discharge line pressure and oil
temperature is controlled using a water cooled heat exchanger. Figure 8: CFD Model of the compressor
4.1 CFD model
Figure 8 shows the CFD model domain that consists of the suction port and discharge port. Both the ports have an extended pipe to provide boundary pressure conditions. The oil injection is through four injection holes that are connected to the rotor domain by fluid-fluid interfaces. The rotor domain itself is a deforming grid, generated using the procedure described in Section 3. Three operating conditions have been calculated, listed in Table 1.
Table 1: CFD model cases and operating conditions
Case Speed
(rpm) Suction Pressure (bar) Suction Gas Temperature (K) Discharge Pressure (bar) Oil injection Pressure (bar) Oil Injection Temperature (K)
1 3000 1.00 298.0 6.0 5.5 323.0
2 3000 1.00 298.0 8.0 7.5 323.0
[image:8.612.333.539.92.285.2]3 6000 1.00 298.0 8.0 7.5 323.0
Table 2: Mesh statistics and cell quality report
Domain Cell Structure Node Count Cell Count Orthogonality Angle (Min) Expansion Factor Aspect Ratio
Rotor Hexahedral 468677 406368 7.4 646 488
Suction Port Tetra + Hex 119058 203255 30.2 279 9
Discharge Port Tetra + Hex 98521 253095 19.6 53 28
Oil Injection Port Hexahedral 28340 25144 55.7 4 4
The axial end clearances are not included in the CFD model for simplification. Eulerian – Eulerian multiphase model as described in Section 2.3 has been used. Air phase is defined as an ideal gas state with molar mass of 28.96 kg/kmol, specific heat capacity 1.0044e03 J/kg K, dynamic viscosity 1.831e-05 kg/m s and thermal conductivity 2.61e-02 W/m K.
Oil phase is defined as constant density of 800 kg/m3, specific heat capacity 1800.0 J/kg K, dynamic viscosity 0.0088
[image:8.612.77.536.399.567.2]1023, Page 8
The discharge and oil injection pressure had to be gradually increased over more than 4 full rotations of the main rotor. Calculations were continued until the flow and pressure pulsations showed cyclic repetitions. Mass imbalance for air phase was below 9% and for oil phase was about 11% in all three cases. This imbalance could be due to the grid quality, lower order discretization schemes used and the convergence level achieved which was in the range of 5e-4.
On a 6 node parallel calculation with 3GHz processor and 32GB RAM, each computation took about 350 hours physical time for convergence. The flow time was equivalent of 15 rotations of the main rotor at full pressure.
4.2 Comparison of the flow and indicated power with measurements
Figure 9 shows a comparison of normalized mass flow rate of air and the normalized indicated power between measurements and CFD results for the three cases. Experimental flow and power at Case 1 conditions of 3000rpm, 6.0 bar discharge pressure have been used here for normalization.
Figure 9: Comparison of Flow and Indicated Power between experimental and CFD results
It can be noted that at 3000 rpm at both discharge pressures the gas flow prediction is within around 12% lower than the measured values, while at 6000 rpm and 8.0 bar discharge, the predicted flow is within 2% of measurements. From 3000 to 6000 rpm, the flow has increased by 85%. Indicated power at 3000rpm is calculated within 4% of the measurements while at 6000 rpm it is about 10% higher than the measured value. It has to be noted that, in order to compare with CFD results, the measured shaft power was multiplied by the estimated constant mechanical efficiency of 70%. This may not be the most accurate estimate which could be overcome by the addition of a mechanical and bearing loss model to include additional mechanical losses into the CFD model instead. Power at 3000 rpm, 8.0 bar is 20% more than that at 6.0 bar. From 3000 to 6000rpm, indicated power increased by more than twice.
4.3 Pressure distribution
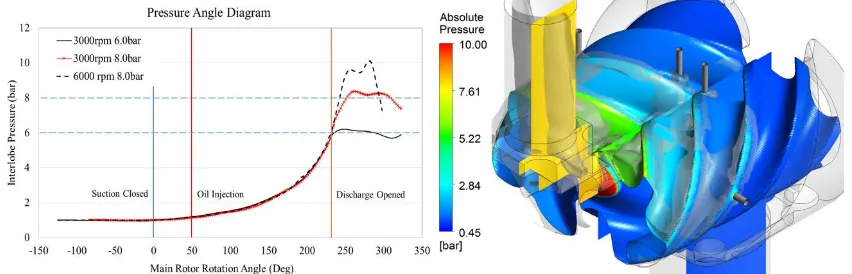
Figure 10 shows the variation of pressure in the compression chamber with the main rotor rotation angle. The distribution of pressure in rotors and the discharge with an iso-surface of oil volume fraction at 0.1 is also plotted. From the pressure angle plots it could be observed that the pressure during the compression part of the process aligns closely. At 3000 rpm when the discharge port opens, the flow pulsations in the port are low. These increase with the increase in pressure. Still for 3000 rpm pulsations and the maximum pressure are both lower that at the higher speed. At 8.0 bar discharge pressure and 6000 rpm the peak pressure reaches 10.0 bar visible in the contour plot in Figure 10. For the built-in volume ratio Vi=3.6, the 8.0 bar discharge pressure is in under-compression condition visible in
the pressure curve. The peak over-compression at higher speed is due to the throttling and dynamic losses in the port.
[image:9.612.92.516.199.337.2] [image:9.612.95.521.567.704.2]1023, Page 9
4.4 Oil distribution inside the compression chamber
[image:10.612.76.540.170.365.2]Figure 11(a – h) shows a close interaction of the injected oil with the gate rotor lobes over one complete interlobe rotation. At position ‘a’ the injection hole is just exposed to the compression chamber when the formation of oil spray begins. Its direction is influenced by the passing leading gate rotor lobe. The velocity of oil depends on the injection pressure. At ‘c’ oil film forms in the root the rotor. At positions ‘d’, ‘e’ and ‘f’ the film spreads, spray continues and finally the intersection with the trailing lobe starts. At ‘g’ the hole is completely blocked by the trailing lobe width and oil velocity vectors show that an oil flow pulse is formed. At ‘h’ the position of injection coincides with that at ‘a’ and the cycle repeats itself. A large vortex remains in the trailing working chamber.
Figure 11: Oil injection interaction with the gate rotor lobes during one cycle
The pulsating nature of the oil injection can also be seen in Figure 12. Quantity of oil injected at 8.0bar discharge is similar at both speeds 3000 rpm and 6000 rpm. In the analysis, the system loss from separator vessel to the injection hole is assumed to be 0.5 bar in all the three cases. For a more accurate model, an injection pressure measurement would be required that can be specified as boundary condition. The oil flow rate at 6.0 bar is lower than at 8.0 bar discharge. Figure 12 also shows the distribution of oil and its interaction in the discharge port. Iso-surface of oil volume fraction 0.1 shows an accumulation of oil in the rotor tips and also high concentration on the discharge port walls. Similarly oil accumulates in the interlobe gaps and is transported by the rotors. The oil distribution in the discharge port is unsteady but cyclically repeating.
Figure 12: Oil flow distribution near the discharge port and flow cycles for three cases.
4.5 Temperature distribution
[image:10.612.75.523.484.625.2]1023, Page 10
different rotational speeds is almost the same, as shown in Figure 12. This when combined with lower residence time of the oil at higher speed results in lower heat transfer from gas to oil and results in a higher discharge temperature. Similarly there is only a small difference in the gas temperature at the same speed and different discharge pressures because the quantity of oil injected at higher pressure increases, as shown in Figure 12. This higher amount of oil lowers the gas temperature and it is close to the injection temperature 323K. Figure 13 also shows the distribution of gas temperature at 8.0bar discharge pressure, 6000rpm with an iso-surface of oil volume fraction 0.1. It can be seen that the local maximum temperature reach 360 K. Also the gas temeperature is not uniformly distributed. This non-uniformity is due to the non-homogeneous distribution of oil in the compression chamber.
Figure 13: Discharge gas temperature cycles for three cases and distribution at 6000rpm, 8.0bar pressure.
5. CONCLUSIONS
This paper presents the CFD modelling approach used for the calculation of an oil flooded screw compressor. A single domain structured numerical mesh of the flow domain was generated by SCORGTM using recently developed
boundary blocking and analytical grid generation procedure. A test oil injected compressor was measured and integral parameters such as flow rate of gas and indicated power were used for the comparison with CFD results.
Test analysis showed a close match in the prediction of the mass flow rates of gas.
The indicated power obtained by CFD predictions matched well with the measured shaft power.
The mixing of the phases, distribution of oil, heat transfer between gas and oil and also effects on sealing due to high oil concentration in leakage gaps were well captured.
Interaction of oil injection with the rotors, deposition on the rotor surface, discharge port walls and heavy accumulation in the interlobe region was observed.
In order to improve the model further it will be necessary to investigate impact of grid quality on the results and to test for higher accuracy solver settings along with the development of techniques for improving solver robustness.
REFERENCES
Arjeneh M., Kovačević A., Gavaises M., Rane S., (2014). Study of Multiphase Flow at the Suction of Screw Compressor, Proc. Int. Compressor Conf. at Purdue, Paper 1353.
Crowe, T. C., (2006). Multiphase Flow Handbook. Taylor and Francis, ISBN 0-8493-1280-9, CRC Press.
Deipenwisch R and Kauder K., (1999). Oil as a design parameter in screw type compressors: oil distribution and power losses caused by oil in the working chamber of a screw type compressor. IMECHE Transactions; 6; 49-58; Int. Conf. on Compressors and their systems, London.
Kovačević A., (2002), Three-Dimensional Numerical Analysis for Flow Prediction in Positive Displacement Screw Machines, Thesis, City University London.
Kovačević A., (2005). Boundary Adaptation in Grid Generation for CFD Analysis of Screw Compressors, Int. J. Numer. Methods Eng., Vol. 64: 401-426. Kovačević A., Stošić N. and Smith I. K., (2007). Screw compressors - Three dimensional computational fluid dynamics and solid fluid interaction, ISBN
3-540-36302-5, Springer-Verlag Berlin Heidelberg New York.
Papes, I., Degroote, J. and Vierendeels, J., (2013), 3D CFD analysis of an oil injected twin screw expander. Pro of the ASME 2013 International Mechanical Engineering Congress and Exposition, San Diego, USA: ASME IMECE 2013.
Rane S., Kovačević A., Stošić N. and Kethidi M., (2014). Deforming grid generation and CFD analysis of variable geometry screw compressors, Computers and Fluids, 99, p. 124–141.
Rane, S., (2015). Grid Generation and CFD analysis of Variable Geometry Screw Machines, Thesis, City University London.
Stošić N., Milutinovic Lj., Hanjalić K. and Kovačević A., (1992). Investigation of the influence of oil injection upon the screw compressor working process. Int. J. Refrig. vol. 15(4), pp. 206-220.
Stošić N., Smith I.K. and Kovačević A., (2005). Screw Compressors: Mathematical Modeling and Performance Calculation, Monograph, Springer Verlag, Berlin, June 2005, ISBN: 3-540-24275-9.
Voorde Vande J. and Vierendeels J., (2005). A grid manipulation algorithm for ALE calculations in screw compressors. 17th AIAA Computational Fluid
[image:11.612.89.525.169.308.2]