City, University of London Institutional Repository
Citation
:
Dell’Amico, M., Hadjidimitriou, S. and Kaparias, I. (2014). A descriptive study on public transport user behaviour from Live Bus Arrivals. Paper presented at the 2ndConference on Sustainable Urban Mobility, 05-05-2014 - 06-05-2014, Volos, Greece.
This is the accepted version of the paper.
This version of the publication may differ from the final published
version.
Permanent repository link:
http://openaccess.city.ac.uk/6259/Link to published version
:
Copyright and reuse:
City Research Online aims to make research
outputs of City, University of London available to a wider audience.
Copyright and Moral Rights remain with the author(s) and/or copyright
holders. URLs from City Research Online may be freely distributed and
linked to.
A Descriptive Study on Public Transport User Behaviour from Live
Bus Arrivals
Mauro Dell’Amico1, Selini Hadjidimitriou1, Ioannis Kaparias2
1Department of Sciences and Methods for Engineering, University of Modena and Reggio
Emilia, Pad. Morselli, via Amendola 2, 42122 Reggio Emilia (IT) (E-mail: dellamico@unimore.it, selini@unimore.it)
2City University London, Northampton Square EC1V 0HB London (UK)
(E-mail: kaparias@city.ac.uk)
Abstract
In order to offer public transport that meet citizens’ needs for transport and further increase the use of bus services, Public Authorities need to analyse and understand travellers behaviour. Automatic Vehicle Location (AVL) data provide information on the observed time of arrival and departure of a bus at each stop. These data are fed into an algorithm to provide information to users on the expected time of arrival at the bus stop by an on-line service. In the city of London this service is called Live Bus Arrivals. This work describes the general behaviour of Live Bus Arrivals users by analysing the type of requests, localising them and compare them in different days of the week and time ranges. The objective is to identify some of the main passengers’ origin, destination and interchanges behaviour that could be of value to decision-makers and planners.
Keywords: public transport, real-time travellers information, travellers behavior.
1. INTRODUCTION
The Live Bus Arrivals relies on the iBus AVL system by Transport for London (TfL) and provides information on the real time arrival of a bus line at stop in the London network. The user accesses the TfL website, using a web browser on a PC or a dedicated app for smart phones.
Requests can be of four types:
The user types the bus number and, if there are two possible route directions, chooses one. The output is a list of stops’ names and the user needs to select one;
The user types the stop number and gets a list of buses approaching the stop with their corresponding time of arrival;
The user types the name of the stop and will get the same output as above;
The user writes the number of bus line and gets a map of the route.
routes. The analysis will focus on the description of the requests for departures, arrivals and for bus-to-bus interchange by identifying which type of data can provide information on passengers’ behaviour. The final objective is to identify a set of procedures that use Live Bus Arrivals data that can be developed in future works to provide information on transport flows or a description of the selection of different stops as alternatives.
2. LITERATURE REVIEW
There are many studies on the impact of real time information on public transport travellers behaviour and on the use of Intelligent Transport System (ITS) data to derive information on transport flows or users’ behaviour.
For instance Dziekan et al. [1] studied the effects of real time information displays at stops on waiting time, on easiness to use the system, on willingness-to-pay, on mode choice and on customer satisfaction. They found that the provision of real time information at stop has the capability to reducing perceived waiting time. Additionally, they found that it is five time cheaper to introduce real time information systems with the aim to reduce perceived waiting time than increasing the frequency of a public service. Finally, they discover that people react at real time information by running when they see there are only few minutes left until the train departs. Watkins et al. [2] carried out a study on waiting time perception for users with and without real-time information. They discovered that perceived waiting time was 30% less for users of real time information. Additionally they found that mobile real time information reduce the actual waiting time because users arrive at the stop closer to the bus arrival instead of being there well in advance. Tang et al. [3] analysed longitudinal data on bus ridership and related them to employment rate, gas prices, weather conditions and other socioeconomic characteristics to study the impact of real time information on public transport usage. They found variations over time on bus ridership due to the installation of real time information but they were not able to provide conclusion on geographical variations.
One of the first work on transit passengers and real time information was proposed by Hickman [4] who described a path choice model by incorporating real time information. Specifically, they introduced in the path choice model stochastic and time-dependent travel time. Their objective was to take into account the influence of a real time infor- mation system on alternative origin to destination choices. However the results showed that real time information does not provide significant benefits for transit passengers path choices in terms of reduction of travel time. In a recent work, Cats et al. [5] propose a dynamic transit path choice model and evidence that potential time savings are associated with the provision of real time information. Trozzi et al. [6] developed a time dependent route choice model to determine the impact of the count down system under overcrowding scenarios. They found that live information do not lead to a reduction of travel time but it changes travel behaviour of passengers who prefer less congested interchange stations.
on the destination, the alighting station has been estimated by looking at the passengers’ position and the time of the next boarding.
Other studies focus on the development of algorithms and interfaces for real time transit planner. For instance Jariya- sunant et al. [8] developed a mobile real time system that implements a K-shortest path algorithm using bus arrivals predictions. The user types the origin and the destination and obtains a personalised shortest path on a map. The results of performance analysis show only a marginal improvement of travel time. Finally, Hardy [9] analysed Live Bus Arrivals requests by time of the day, location and type of channel. The user requests information from home, using a PC, a smart phone or the SMS service. The study showed that the demand for real time information was higher during peak hours meaning that the service is mostly used when waiting time is longer.
In this study we will describe Live Bus Arrivals data by focusing on specific examples, without stating general as- sumptions on users behaviour. The description of the database will allow to determine its use in relation to the possibility to contribute to existing studies on the use of real time information to estimate waiting time, on the possibility to estimate public transport OD matrices and on the analysis of passengers route choices.
3. THE DATASET
The data analysed in this work refers to five days between the 16th and 20th July 2012. The week under examination covers the final stages of preparation for the Olympic Games that were held in London between the 27th July and 12th August 2012. The period corresponds also to the last week before most schools closed for summer holidays. Week-ends and night hours are not included in the analysis which focuses on working days (Mon-Fri).
The original file consists of about 4 million rows for each observed day. Each string includes the IP address which usually refers to one or a set of requests sent by the same user, the time and the day of the request, the bus and/or the stop number, the cellphone model and the browser installed. An example of string is shown in Figure 1. The format of the file includes univocal keywords and non structured system calls from which it is necessary to identify and extract the needed information such as stop codes and line buses.
Figure 1. Original data
To analyse bus passengers’ behaviour using Live Bus Arrivals data, the first step was to extract the number of stops and/or bus routes from each string. As a general rule, buses and stops are always preceded by one of the keywords listed in Table 1.
Table 1. Keywords
Type of string
1 /arrivals/
2 /stopsNearLocation/
3 stop=
4 /myStops/
5 searchTerm=
6 showJourneyPattern/
Figure 2. Extracted data
Figure 3. Cleaned data
Moreover, for each hourly range and for each user, repeated requests for a stop and/or for a bus have been counted. This information is included in an additional column named “count”.
4. CLASSIFICATION OF LIVE BUS ARRIVALS USERS BEHAVIOUR
4.1. Complete information
[image:7.595.211.381.255.407.2]In case of complete information, the most accurate data that a user can provide consists of the code number of boarding and alighting stops and the bus route. Some variants are also possible which provide complete information such as passengers asking information not only for bus arrivals at origin and destination but also at intermediate stops. Complete information can be obtained if a passenger specifies the stop of origin and destination and there is only one line passing by both stops. Figure 4 displays the table with the list of requests for real time arrivals of a bus route (496 to Harold Wood), two stops, Harold Wood Station (51285) and The Brewery (52277), and a graphical representation of the re- quests. These types of requests allow unambiguous interpretation and can be used as disaggregated data on passengers’ origin and destination.
Figure 4. Complete information
4.2. Partial information
Partial information on trips is obtained when a passenger asks about the time of arrival of a bus at the stop of boarding or indicates both the stop number and the bus route. This is the case in which a user accesses the Live Bus Arrivals system by typing the number of bus and selects one of the stops from the list. Although the destination is not known, these data can provide information on stop departures and/or on route’s flows.
Figure 5. Average repeated requests (7-8 a.m) Monday, 16/07/2012 - Friday, 20/07/2012
Requests for live arrivals of a bus route at a boarding stop. When passengers ask for live arrival of a bus at a specific stop, the information is partial because there are no data on the destination but only on the stop of departure, on the bus route and its direction. For instance Figure 6 shows that the user has asked for bus W8 arrivals at Browning stop (47051), the route direction is Herefield Close. In this example even if the destination is unknown, there are only five stops until the end of the line.
Figure 6. Request for live arrivals of a bus route at a stop
Requests of a bus route. Sometimes users request information on a bus line to know the route direction or to have an overview of the list of stops. In this case no real time information on arrivals at stop is requested so that no data are available on the trip. However this information can be used to know how popular a particular route may be.
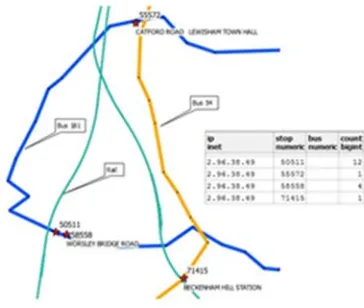
[image:8.595.217.373.368.557.2]is no information on the final destination. This data should be grouped together with the “Repeated requests” and should be handled accordingly to avoid misinterpretation (i.e. by considering the two stops as the origin and the destination).
Figure 7. Requests for near stops
Requests for same stop but opposite route direction. In some cases users look for Live Bus Arrivals at both directions of the same stop. Therefore it may be that the user cannot easily identify which is correct route direction. Bus route directions are usually identified with the stops at the end of the line. However public transport passengers probably know better about their stop of arrival instead of the end of the line. A new real time functionality could include the possibility to type the stop of arrival and, based on that indication, the system could provide some indication on which is the bus stop the user has to board. Indication of stops direction could consists in colours or letters applied at the stop, near the stop code. So that when a user types his origin and destination, the system could provide the indication on the correct stop to board.
Bus-to-Bus transfer. Passengers often use the Live Bus Arrivals service to get
information on arrivals at the bus stop they want to transfer. For instance, Figure 8 displays the set of requests of a passenger who has boarded at Kingsbury station (72740). Six bus routes by Kingsbury station but the user has most likely boarded bus route 183 to Pinner Station. This is in fact the only bus route that allows to arrive close to where the next two requested stops (72141 and 59160) are located. The interpretation of user behaviour in the second part of the trip is complex. The two stops for which the user has requested real time arrivals are in reality the same stop (Hunters Grove) where bus routes transit with opposite directions. From these stops several bus routes transit: the 114, H9, H19, H10, H18. All of them have transfer points along route 183. Possible explanations on why the user has asked arrivals information at Hunters Grove are: 1. the user did not know he could transfer along line 183 to one of the buses passing by Hunters Grove so that has caught the bus from another stop; 2. the user knew that there was an easier transfer point but, based on real time of arrivals, has decided to get off one stop earlier and to walk to the transfer stop. The first hypothesis is less probable because the passenger has on-line information. Furthermore this behaviour and other examples that will be described in the next paragraphs suggest that public transport passengers make use of real time information when boarding from one bus line to another. So that a specific functionality aimed to quick and easily provide such type of information could be well accepted by the users.
323 to Mill End firstly from Devons Road (DLR), then to a closer stop, St. Pauls Way School stop. Generally the interpretation of Live Bus Arrivals data becomes complex when users look at two or more travel options.
[image:10.595.222.375.299.433.2]Figure 8. Bus-to-Bus transfer: data interpretation
Figure 9. Bus-to-Bus transfer at near stops
Figure 10. Bus-to-Bus transfer: alternative routes
Figure 11 shows two types of requests for real time arrivals: the first at bus stop Leonard Avenue (51795), the second for bus route 174 at Reinham Road North (56184). In this case there are two optional bus routes that allow to arrive near to Reinham Road North from Leonard Avenue: bus routes 175 and 103. The most probable option is that the user has caught bus 103 to arrive close to Reinham Road North, walked a few hundred meters and transferred to the southbound bus 174.
Figure 11. Bus-to-Bus transfer: first route identification
Figure 12. Bus-to-Bus transfer
Finally Figure 13 shows the last example of bus-to-bus transfer. In this case the traveller has firstly asked for information on arrivals at Tottenham Court Road Station (51056). Since from that station is possible to board many bus lines, it is necessary to look at the location of the second request which is Ebury Bridge (47551). The only bus route from Tottenham Court to a stop closed to Ebury Bridge is bus route 73 to Victoria. From Ebury Bridge it is only possible to board bus route C10 to Canada Water. It has to be noticed that 73 to C10 transfer was already possible at Victoria. Therefore this is another example of a user who has boarded from another stop instead of the one located very close to the one of the previous bus line (bus 73). A possible explanation is that, using real time information, users prefer to walk instead of waiting at the stop for the bus.
Figure 13. Bus-to-Bus transfer
4.3. Outliers
Not all data can be used for the analysis of travel behaviour. For instance, some users ask for arrivals at two opposite direction stops. In this case is it not possible to define from which stop the passenger boards. Furthermore it is necessary to exclude users with behaviours that are not clearly defined for instance when many requests are sent during a hour for any stop around the city such as in Figure 14.
[image:12.595.189.398.412.494.2]Figure 14. Outliers
5. CONCLUSIONS AND FUTURE RESEARCH DIRECTIONS
The main conclusions on traveler behaviour as arising from the study of the Live Bus Arrivals data can be summarised as follows:
The 10% of users frequently update their request for live arrivals at a bus stop. A real time information system could include the possibility to keep the system updated, for instance with a clock which the user can activate or disactivate. Furthermore the information gathered from repeated requests could allow to develop an indicator of perceived waiting time that depends on the number of requests sent by each user. For instance if the time elapsed between the first and the last request is greater than 10/15 minutes and the user has updated the system every second, the time elapsed between the first and the last request could be used as an estimation of waiting time at stop. The value of the indicators can be then related to weather and traffic conditions or bus frequencies at stops to detect if there are variables that have an influence on perceived waiting time. To this aim two different time periods could be compared: a period of regular traffic and an overcrowding period such as the one during which the Olympic Games took place.
live information could influence equally attractive stops and lines upon departures. For instance given two equally attractive stops, the study will explore how users’ route choice change based on LiveBus Arrivals information.
Acknowledgements: This work was partially supported by the COST Action TU1004: Modelling Public Transport Passenger Flows in the Era of Intelligent Transport Systems. We would like to acknowledge networking support by Cost Action TU1004 and Transport for London Buses for providing the data.
References
Katrin Dziekan, Karl Kottenhoff, Dynamic at-stop real-time information displays for public transport: effects on customers, Transportation Re- search Part A, 41, 489501, (2007)
Kari Edison Watkins, Brian Ferris, Alan Borning, G. Scott Rutherford, David Layton, Where Is My Bus? Impact of mobile real-time information on the perceived and actual wait time of transit riders, Transportation Research Part A: Policy and Practice, Volume 45, Issue 8, Pages 839-848 (2011)
Mark D. Hickman, Nigel H.M. Wilson, Passenger travel time and path choice implications of real-time transit information, Transportation Research Part C: Emerging Technologies, 3, 4, 211226 (1995)
Oded Cats, Wilco Burghout, Tomer Toledo, Haris N. Koutsopoulos, Effect of Real-Time Transit Information on Dynamic Passenger Path Choice, Transportation Research Record, 2217, 46 54 (2011)
Valentina Trozzi, Guido Gentile, Michael G. H. Bell, Ioannis Kaparias, Effects of countdown displays in public transport route choice under severe overcrowding, Networks and Spatial Economics, 01 (2013)
Marcela A. Munizaga, Carolina Palma, Estimation of a disaggregate multimodal public transport OriginDestination matrix from passive smartcard data from Santiago, Chile, Transportation Research Part C: Emerging Technologies, 24, 9-18 (2012)
Lei Tang, Piyushimita (Vonu) Thakuriah, Ridership effects of real-time bus information system: A case study in the City of Chicago, Transportation Research Part C: Emerging Technologies, 22, 146-161 (2012)
Jerald Jariyasunant, Daniel B. Work, Raja Sengupta, Branko Kerkez, Steven Glaser, Alexandre Bayen, Mobile Transit Trip Planning with Real- Time Data, Transportation Research Board 89th Annual Meeting, Washington, D.C., Jan. 10–14 (2010)