Contents lists available atScienceDirect
Applied Energy
journal homepage:www.elsevier.com/locate/apenergy
Nano-enhanced Phase Change Material for thermal management of BICPV
S. Sharma
a,⁎, L. Micheli
a,d,⁎, W. Chang
b, A.A. Tahir
a, K.S. Reddy
c, T.K. Mallick
a,⁎aEnvironmental and Sustainability Institute, University of Exeter, Penryn, Cornwall TR10 9FE, UK bCentre for Precision Manufacturing, University of Strathclyde, Glasgow G1 1XQ, UK
cHeat Transfer and Thermal Power Laboratory, Department of Mechanical Engineering, Indian Institute of Technology Madras, Chennai 600036, India dCurrent address: Department of Chemistry, Colorado School of Mines, Golden, CO 80401, USA
H I G H L I G H T S
•
Novel solution for passive thermal management of BICPV with microfins, PCM, n-PCM.•
Average temperature reduction with PCM, 9.6 °C (13.9%); 11.2 °C (16.2%) with n-PCM.•
With microfins, PCM reduced temperature by 10.7 °C (15.9%); n-PCM by 12.5 °C (18.5%).•
Individual effectiveness of n-PCM was the highest followed by PCM and microfins.•
PV electricity output predicted to theoretically increase by 15.15 GW worldwide.A R T I C L E I N F O
Keywords:
Building-integrated concentrating photovoltaic (BICPV)
Phase Change Materials (PCM)
Nanomaterial enhanced PCM (NEPCM, n-PCM) Micro-fins
Passive cooling Thermal management
A B S T R A C T
Building-Integrated Concentrated Photovoltaics (BICPV) is based on Photovoltaic (PV) technology which ex-perience a loss in their electrical efficiency with an increase in temperature that may also lead to their permanent degradation over time. With a global PV installed capacity of 303 GW, a nominal 10 °C decrease in their average temperature could theoretically lead to 15 GW increase in electricity production worldwide. Currently, there is a gap in the research knowledge concerning the effectiveness of the available passive thermal regulation tech-niques for BICPV, both individually and working in tandem. This paper presents a novel combined passive cooling solution for BICPV incorporating micro-fins, Phase Change Material (PCM) and Nanomaterial Enhanced PCM (n-PCM). This work was undertaken with the aim to assess the unreported to date benefits of introducing these solutions into BICPV systems and to quantify their individual as well as combined effectiveness. The thermal performance of an un-finned metallic plate wasfirst compared to a micro-finned plate under naturally convective conditions and then compared with applied PCM and n-PCM. A designed and fabricated, scaled-down thermal system was attached to the electrical heaters to mimic the temperature profile of the BICPV. The results showed that the average temperature in the centre of the system was reduced by 10.7 °C using micro-fins with PCM and 12.5 °C using micro-fins with n-PCM as compared to using the micro-fins only. Similarly, the effect of using PCM and n-PCM with the un-finned surface demonstrated a temperature reduction of 9.6 °C and 11.2 °C respectively as compared to the case of natural convection. Further, the innovative 3-D printed PCM contain-ment, with no joined or screwed parts, showed significant improvements in leakage control. The important thermophysical properties of the PCM and the n-PCM were analysed and compared using a Differential Scanning Calorimeter. This research can contribute to bridging the existing gaps in research and development of thermal regulation of BICPV and it is envisaged that the realised incremental improvement can be a potential solution to (a) their performance improvement and (b) longer life, thereby contributing to the environmental benefits.
1. Introduction
To address the concerns related to environmental sustainability, increasing energy costs and depleting fossil fuel resources, renewable energy technologies have been at the forefronts of energy research. A
key objective of the EU’s 2020 targets is to increase the share of re-newable energy generation within its member states to 20%[1]. Solar energy, with its tremendous availability of 120 petajoules of energy incident on the Earth per second, possess immense potential in sup-plying the planet’s energy needs. With an annual solar energy
http://dx.doi.org/10.1016/j.apenergy.2017.09.076
Received 29 May 2017; Received in revised form 1 September 2017; Accepted 11 September 2017
⁎Corresponding authors at: Environmental and Sustainability Institute, University of Exeter, Penryn, Cornwall TR10 9FE, UK (S. Sharma, L. Micheli, T.K. Mallick).
E-mail addresses:ss664@exeter.ac.uk(S. Sharma),L.Micheli@exeter.ac.uk(L. Micheli),T.K.Mallick@exeter.ac.uk(T.K. Mallick).
0306-2619/ © 2017 The Authors. Published by Elsevier Ltd. This is an open access article under the CC BY-NC-ND license (http://creativecommons.org/licenses/BY-NC-ND/4.0/).
production increase by an average of 8.3% and a projected generation of 859 billion kWh[2], the contribution from Photovoltaic (PV) tech-nology is projected to have doubled its share between 2011 and 2018 [3]. Concentrator Photovoltaic (CPV) is afield of PV technology where the concentration of the sunlight is achieved by focusing irradiance onto smaller areas of the solar cells. The underpinning idea behind concentration by means of an optical assembly is to increase the elec-trical energy yield from the PV and reduce the space requirement. When PV and CPV panels are used in buildings for producing electricity at the point of use and replacing the conventional building materials, they are referred to as Building-Integrated Photovoltaic (BIPV) and Building-Integrated Concentrator Photovoltaic (BICPV) respectively. However, as a side-effect of this concentration achieved by mirrors or lenses, a high-temperature rise is observed within BICPV systems if the generated heat is not properly dissipated. Also, silicon based solar cells that are currently used for BICPV, convert only approximately 18–20% of the available solar irradiance into electrical energy while the rest is converted into heat[4]. This temperature rise poses a challenge for the efficient functioning of the cells within their safe operating tempera-tures and may be detrimental to their longevity. For instance, in mono and polycrystalline silicon solar cells, the increase in temperature leads to a slight increase in short circuit current (0.06–0.1%/°C), but in-troduces a much higher voltage drop (2–2.3 mV/°C), and fill factor reduction (0.1–0.2%/°C), causing the output electrical power to drop by 0.4–0.5%/°C[5,6]. This undesirable performance degradation is due to the negative temperature coefficient of the silicon solar cells (as high as −0.66%/°C between 25 °C and 60 °C[7]). Therefore, this challenge of the over-heating of solar cells above the manufacturer-specified oper-ating temperature needs to be addressed.
The available thermal management options for low concentration BICPV systems include: (a) active cooling mechanism, based on pumped water which requires mechanical or electrical power for operation, and (b) passive cooling mechanism, achieved by either changing the geo-metry (i.e. by introducing fins) or by using Phase Change Materials (PCMs). Due to the clear benefits of passive mechanisms such as silent and powerless operation, and lower associated costs, they are selected for the requirements of this research.
Fins are extended surfaces made of materials with high thermal conductivity and manufactured using welding, extrusion or milling[8] while micro-fins are extended surfaces with one or more micro-scaled dimensions and are generally produced by subtractive manufacturing processes such as dicing, etching or electrical discharge machining[9]. Another passive cooling technique is based on the use of PCMs; mate-rials with high latent heat and other desirable thermophysical proper-ties that undergo phase transformation during addition or removal of
heat[10–12]. Appropriately used PCMs can reduce the peak heating and cooling loads and may minimise the system bulk by reducing the dimensions of the heat transfer surface[13]. Commercially available paraffin wax based PCMs demonstrate no degradation in their thermal properties and remain stable even after 1000–2000 cycles of melting and solidification[14]. However, paraffin wax based PCMs which are most commonly employed in buildings and other applications possess very low thermal conductivity, which increases their charging and discharging time period. This issue could be addressed by adding ma-terials with a higher thermal conductivity, known as Thermal Con-ductivity Enhancers (TCEs)[15–17], such as nanomaterials. The term Nanoparticle-Enhanced Phase Change Materials (NEPCM), referred to as n-PCM within this paper, was coined by the authors of[18], about a decade ago, and they proposed the use of n-PCM for various thermal energy storage applications.
Over the past two decades, the passive thermal regulation of BIPV using PCMs as the primary media have been reported by[19–21]in combination with macro-fins[22]. However, there is still considerable scope for research in their application in BICPV, especially the com-bined use of micro-fins, PCMs and n-PCMs. In addition to this, the re-search on micro-fins itself is still limited, although there is wide knowledge available on the macro-scaledfins[23]. The question that needs to be addressed is whether these combined thermal management techniques, which are either proposed or adopted for BIPV and other PV applications will prove equally beneficial for BICPV and if so, what will be the quantified benefits. Through this study, we have attempted to provide some answers and bridge the existing knowledge gap by: (a) experimentally investigating the passive cooling of BICPV using micro-fins and PCM in tandem, and (b) exploring the potential advantages of replacing PCMs with n-PCMs. For thefirst time, the benefits of various combined thermal management techniques are quantified in terms of achieved temperature reduction. In addition, we have attempted to resolve the leakage of PCM in the liquid phase through the use of a single component, 3-D printed PCM containment with no joined parts. Leakage is a critical issue associated with the use of solid-liquid organic PCMs[24,25].
For the experimental work, a scaled down thermal system was de-signed and fabricated to emulate the BICPV temperature rise as obtained in[26]. An un-finned and a micro-finned aluminium plate were used as the heat sink that mounted the heat source (glued Kapton resistance heaters). The PCM containment was 3-D printed using ABS plastic and the aluminium plate was snug-fit with the micro-fins facing the PCM side. Paraffin wax based organic solid-liquid RT42 (fromRubitherm®, Germany) was selected as the PCM for the experiments. A metal oxide nanomaterial (nano-CuO, with 60 nm average particle size) was selected as the TCE to Nomenclature
Afins area of micro-fins (m2)
CP specific heat of PCM (J kg−1K−1) H height of micro-fins (m)
HL latent heat of PCM (J kg−1)
hfins heat transfer coefficient of micro-finned surface (W m−2K−1)
hflat heat transfer coefficient of un-finned surface (W m−2K−1) I applied direct current (A)
kp thermal conductivity of PCM (W m−1K−1) kn,PCM thermal conductivity of n-PCM (W m−1K−1) kn thermal conductivity, nano CuO (W m−1K−1) L length of micro-fin base (m)
m mass of the PCM (kg) n number of micro-fins ρ density (kg m−3)
Qin heat supplied by the DC supply (W)
Ql latent thermal energy (J)
Ql, overall overall thermal energy for phase change (J) spacing S between micro-fins (m)
ΔT change in PCM temperature (°C) Tm PCM melting peak temperature (°C) Tc module central temperature (°C) Tamb ambient temperature (°C) Tair steady state air temperature (°C) Tfins steady state micro-fin temperature (°C) tb thickness of the micro-fin array’s base (m) t thickness of micro-fins (m)
Uh prefix for uncertainty V applied direct voltage (V)
enhance the low thermal conductivity (0.2 W m−1K−1[27]) of the base PCM. The temperature defining current and voltage were experimentally determined for the DC power source as P = 0.8 W at V = 8.0 V; where P is the electrical input power in Watts and V is the corresponding voltage in Volts. These values corresponded to the temperature profile obtained by [26]using an un-finned back plate. However, the difference in the heat source was that, instead of the irradiance from a solar simulator causing the temperature rise, the insulatedflexible heaters were used. A detailed explanation for this is given in Section4.1. It was concluded from the experimental results in[26]that for a BICPV system, application of PCM alone led to a 4 °C reduction in the average system temperature and a considerable increase of 8% in the electrical efficiency. In this paper, however, we have further focussed on the individual as well as the com-bined thermal effectiveness of the various passive thermal regulation techniques. The temperature profiles obtained from the following six test cases were compared and their performances evaluated: (i) un-finned plate referred to as plate, (ii) plate with PCM, (iii) plate with n-PCM, (iv) micro-finned plate, (v) micro-finned plate with PCM, and (vi) micro-finned plate with n-PCM. The uncertainty analysis, based on experimental un-certainties, was also considered and a numerical model based onComsol Multiphysics® is also presented here. In order to compare the thermo-physical properties such as melting temperatures, latent heat of fusion and specific heat, thermograms were obtained for the PCM and n-PCM samples using a Differential Scanning Calorimeter (DSC). The underlying motiva-tions which drive this research are briefly discussed here.
•
The total global installed PV capacity was 303 GW by end of 2016 [28]. With the temperature dependence of the output electrical power as high as−0.5%/°C[5], every 10 °C decrease in tempera-ture could lead to an increase of 5% in power theoretically. There-fore, a 5% electrical efficiency improvement via effective thermal management could contribute to an increase of 15.15 GW in worldwide electricity production.•
It has been reported that the hot spot problems due to thermal disequilibrium in the PV have been a highly probable cause of high degradation rates for PV modules as well as losses in Iscat high temperatures[29], in addition to other unavoidable factors such as soiling, component failure and ineffective operation. In the long term, the use of PCMs for thermal regulation has the potential to extend the lifetime of the BICPV by reducing the hot spots[26,30] and maintaining a thermal equilibrium within the system. Con-sequentially, this may reduce the intensive energy required for the production of the PV cells and mitigate the associated environ-mental impacts.•
The proposed use of micro-finned surfaces for BICPV heat dissipa-tion and their combined use with PCM and n-PCM are the novelties reported within this paper. The results from the assessment of thermal regulation benefits achieved by introducing micro-finning, PCM and n-PCM into BICPV will provide pivotal information about their applicability in the future. It can also influence the prospects for low concentration BICPV systems will be manufactured in the future. This may have a significant impact on how these systems will be manufactured in the future.2. Literature review
A literature review summarises the available methods for thermal regulation of BICPV and recent developments in the use of PCMs, n-PCMs and micro-fin based heat sinks. This section further explores the importance of TCE for enhancing the thermal conductivity of PCMs and compares the benefits of n-PCM over PCM.
2.1. Thermal management of BICPV
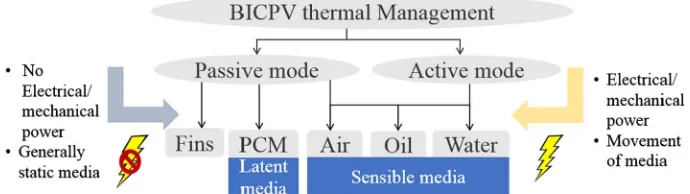
Enhancing the electrical efficiency of BICPV and/or improving their lifespan requires efficient thermal management via a process that en-tails limited investment and doesn’t increase the system bulk. The six main available PV thermal management techniques are[31]: (a) nat-ural and forced air circulation, (b) extensions orfins, (c) hydraulic means, (d) thermoelectric means, (e) heat pipes and (f) PCM. The two key modes of thermal management (active and passive) and the two fundamental mechanisms (sensible and latent) by which the selected cooling media (such as such as air, water and oil) are utilised have a certain degree of overlap (Fig. 1).
Active cooling has been established as an effective means for tem-perature control of PV applications by numerous authors, through both experimental and simulation works. To list a few, the authors of[32] achieved a temperature reduction of up to 22 °C by spraying water over the PV frontal surface using water pumping systems. In two separate studies, the PV array power increased in the range of 21%[33]and by 9–22% from the reference values[34]. The authors of[35] experi-mentally proved that using an air blower, the actively cooled PV cells showed an increase in electrical efficiency from 8–9% to 12–14%. By using a parallel array of ducts with inlet/outlet manifold for uniform airflow distribution at the rear side of the panel, the temperature dropped from 68 °C to 38 °C with active cooling. However, the addi-tional costs of operating the blower or pump for active cooling were not reported and could be higher than the electrical efficiency improvement produced.
[image:3.595.35.380.640.737.2]modes by the authors of [16,39–44] revealed that passively cooled systems showed better performance at high discharge rates, high op-erating temperatures and ambient temperatures of over 40 °C without expending significant fan power. With PCM, the cell temperature re-mained below the upper safety limit of 55 °C in high constant-rate discharge with an ambient temperature of up to 52 °C. This was not feasible using active cooling due to the high airflow rate demand close to the turbulent range that is beyond the practical range for vehicular applications. However, the authors suggest that in this case, the expense of electric power for running the fan was relatively small. Examples of passive cooling of PV using micro-channels[45], microfins[46]and with PCM[44]are commonplace and are discussed in the subsequent sections.
2.2. Introduction to PCM and n-PCM
PCMs are materials used for heat absorption, storage and recovery and are often employed in renewable energy systems due to the inter-mittent and unpredictable nature. They are analogous toheat batteries and contribute to the applied system for rationalising and uniformly spreading the use of energy over a period of time. As a latent media, PCMs are preferred where higher storage densities are required, en-tailing a smaller volume of material with high latent heat[47]. In real-life scenarios, the latent heat changes are accompanied by sensible heating before and after the phase change, hence the mathematical expression for phase change is given by Eq.(1). However, the sensible heat effect is often negligible compared to the latent heat during phase transformations, therefore to calculate purely the latent heat Eq.(2) [48]can be used.
= + +
Ql overall, mCpΔT mHL mCpΔT (1)
=
Ql mHL (2)
where Qlis the latent thermal energy (J), Ql, overallis the overall thermal energy during phase change (J), m is the mass of the PCM (kg), Cpis the specific heat of the PCM (J/kg K),ΔT is the change in temperature (K), and HLis the latent heat capacity of PCM (J/kg).
The use of PCM for the cooling of electronic devices is elaborated in [39]whereas PCM applications in PV and BIPV are further discussed in this section. The use of PCM in PV applicationsfirst emerged as a patent reported almost four decades ago by Stultz in 1978[49]. In their work, [50] evaluated the annual energy saving for a PV-PCM system in a geography with extremely high temperature. They reached the con-clusion that the use of PCM reduced the average PV peak temperature by 10.5 °C thus increasing the annual electrical energy yield by 5.9%. The authors of[30]produced a numerically simulated model for the electrical and thermal behaviour of a CPV-PCM system with con-centration ratios of 5 and 20, and PCM thickness of 0.05 and 0.2 m at various inclination angles (−45° to 90°). They found that at 45°, the system attained the minimum average temperature, highest electrical efficiency and reasonably uniform solar cell temperature. PCM also prevented the hot spot formation caused by the overheating of the PV cells, which may permanently damage the cells if the temperature reaches and maintains a critical value[51]. Not only do PCMs con-tribute to temperature reduction and increased electrical power yield of the PV/CPV, but they can also increase the life of a PV panel. This was proved by [52] through their experimental work using three 65 W polycrystalline PV panels with two types of solid-liquid PCM installed in two different climatic conditions. The cost-benefit analysis outcome of PV-PCM systems in the environment with higher solar radiation proved the technique to befinancially viable.
In order to overcome the inherent low thermal conductivity of paraffin wax based PCM, a metallic nanomaterial can be added to the base PCM as a TCE. The nanoscopic properties of materials differ sig-nificantly from their corresponding macroscopic properties[53]and the extremely minute particle size, along with the increased surface
area, display unique behaviour thereby creating vast potential for na-nomaterial applications[54].
oxide nanoparticles on the thermal performance of paraffin wax (dis-persed with 0.5%, 1%, 3%, 5% and 10% by volume of nanoparticles) and concluded that each TCE only marginally increased the thermal conductivity. However, alumina performed slightly better due to a smaller increase in the dynamic viscosity and because of higher thermal conductivity; an underlying reason for the ease in melting for conduc-tion dominated solidification process. The authors argued that the economic viability for the technology due to stability and cyclic dur-ability was still questionable [64]. The experimental work in [65] suggested that TCE were almost two times as effective in RT25 (lower melting temperature range) than in RT42 (higher melting temperature range) during the melting process, and five times in solidification. Further, studies using RT42 (the PCM used for the experiments within this publication) showed that the addition of metal based TCE, even in lower volume fractions (< 4%), greatly improved the heat transfer characteristics of the PCM. They also concluded that higher volume fractions of TCE do not always lead to better thermal regulation and that the distribution of the TCE within the PCM mix had a considerable effect on heat transfer.
2.3. Introduction to micro-fins
Micro-fins, intended as extended surfaces for improving heat transfer, have at least one micro-scaled dimension. Micro-fins have been effectively integrated with optoelectronic systems[66,67], with condensers or evaporators for cooling systems and air conditioning devices [68] and with tubes in brine coolers [69] to enhance heat transfer rate. Proven to offer better thermal performance as well as higher mass specific power, micro-fins have been found to provide up to 50% higher power to mass ratio in contrast with conventional heat sinks [46]. Fins also provide larger heat dissipation capability which means the size of heat exchangers could be more compact, entailing less refrigerant load in a cooling system. The use of micro-fins has been preferred to forced convection due to their noiseless operation and no external power requirement, thereby offering a less expensive alter-native[70]. Even though micro-fins may not always increase the heat transfer substantially, they prove beneficial in terms of material usage and can be considered useful for applications dependent on weight minimisation of heat sinks[71], a critical aspect in the design of BICPV systems.
The fundamental mode of heat transfer in a micro-fin is via con-vection but the contribution of radiation should not be neglected[72]. While numerous studies have been undertaken for natural convection aroundfins and micro-fins, the existing heat transfer correlations ap-pear insufficient for emerging technologies such as micro-fluidics and nanostructured devices etc.[70]. The authors of[73]have extensively analysed the correlation between thefin geometries and heat transfer coefficients, effects offin orientation, and influence offin thickness and proposed a modified correlation based on their experimental in-vestigations. The effect of micro-fin height (between 0.00025 and 0.0010 m) and micro-fin spacing (from 0.0005 to 0.0010 m) on heat transfer coefficient under steady state natural convection were pub-lished in [74]. The results showed that the convective heat transfer coefficient increased with the increase infin spacing and decrease in the fin height. The highest value was recorded for the lowestfin height at a spacing of 0.0010 m while the heat transfer coefficient reduced by 34.8% due to an increase in thefin height from 0.00025 m to 0.0010 m for a fin spacing of 0.0010 m. The computational fluid dynamics modelling results were found to agree with the experimentally obtained correlations. The authors of [75]reported the advantages of micro-structured roughness on heat transfer performance of heat sinks, cooled by forced air and showed that a 20% enhancement was observed for finned heat sinks compared to the milled ones. Applications of fins [4,76]and micro-fins[46]for the passive cooling of a CPV system have been successful. In [77], a micro-finned surface showed a reduced temperature compared to an un-finned flat silicon wafer in a high
concentration CPV module and they also enhanced the mass-specific power from about 60 We/kg to more than 300 We/kg compared to conventional CPV systems.
The introduction of a micro-finned back plate for low concentration BICPV has not been studied before. In this paper, the notion of in-troducing micro-fins to BICPV systems has been explored, along with the potential use of PCM/n-PCM for their thermal regulation. 2.4. Combined use of passive thermal regulation
The use of passive mechanisms in tandem for the thermal regulation of PV has been reported by several authors of late, thefindings from which are summarised in this section. In their review on the perfor-mance enhancement of the solar cells using various cooling methods, the authors of [78] summarised that the addition of a PCM layer alongsidefins on the back of the module was found to effectively in-crease the electrical efficiency of the PV cells. The authors of [60] performed a numerical investigation on melting, solidification and heat transfer rates of PCM (using n-eicosane) and studied the effect of mixing PCM with different volume fractions of 80 nm Copper (Cu) nano-particles. Results demonstrated that using 2% and 4% volume fractions of Cu nanoparticles led to a respective reduction in full melting time by 25% and 46% while full solidification time fell by 9% and 16%. Simi-larly, by mounting 4, 10, 15 and 20fins, the respective solidification time reduced by 28%, 62%, 75% and 85% while full melting time re-duced by 39%, 73%, 78% and 82% respectively. They concluded that adding nanoparticles accelerated the melting and solidification rate via enhanced heat conduction of the mixture and that the top section melting rate was higher than at the bottom owing to natural convec-tion. Having fins led to more significant improvements, especially during solidification, because of restrained natural convection during melting. The authors of[79]experimentally examined PCM-based heat sinks for electronic equipment cooling using PCM n-eicosane and 33, 72 and 120 pinfins as TCE. With 72 pinfins, the enhancement factor was found to be 21, which was the maximum since as the number offins increased beyond this, the heat transfer was reduced. Clearly, fins contributed to the enhanced operational duration for the electronic devices and heat transfer performance was determined by the PCM mass as well as thefin volume fraction.
To analyse the impact offin geometry (fin-length,fin-ratio and the angle between adjacentfins) and the thermal conductivity of the outer tube material on the PCM melting process, the authors of[80]carried out a detailed numerical study on a sleeve tube with internalfins. The numerical model mostly agreed with other published experimental and numerical results. The results indicated that the PCM melting time could be decreased by a smallfin-ratio to a certain extent. Although the angle between the adjacentfins had only a slight effect on the melting, the thermal conductivity of the outer tube material proved to greatly impact the melting process whether or not natural convection was taken into consideration. Further, reducing thefin-ratio to increase the melting speed did not show any notable effect while the presence of natural convection had a high influence on melting. Also, the angle of 60–90° between the neighbouringfins under natural convection showed the highest effectiveness. It has been reported in[81]that though na-nomaterials already possess high potential for use with PCM, the low number of existing patents on synthesis methods demonstrate the need for accelerated development in thisfield.
3. Design and manufacturing of the micro-finned–PCM system
3.1. Design
An internal step of 0.0005 m was cut tofit the aluminium plate of dimensions 0.030 m × 0.029 m × 0.002 m with 20 micro-fins on the back, each having 0.001 m thickness, 0.0005 m height and 0.0005 m spacing between thefins. An insulation of 0.015 m thickness was used to cover the assembly. This value was chosen considering the critical thickness for insulation. Macro-view and specific dimensions of the micro-finned plate are summarised inFig. 3.
3.2. Materials and manufacturing
The sub-sections below present an overview of the outsourced ma-terials used for fabricating parts of the micro-finned-PCM system in-cluding heating element, micro-finned plate, PCM containment, PCM, and nanomaterial. In addition, it outlines the processes involved in manufacturing and assembling the system.
3.2.1. Heating element and micro-finned plate
An aluminium plate was used as the heat sink as well as the mounting plate for Omegalux®Kaptonflexible heaters (Omega® KHLV-101/10-P). With a flexible nature and adhesive backing suitable for bothflat and curved surfaces, the heaters were rectangular 28 V units, with a thickness of 0.000254 m, Watt density of 105,500 W/m2and supplied with 0.30 m of Teflon insulated lead wire. Thefins at the back side of the aluminium plate were manufactured using the micro-milling machine at the University of Strathclyde (UK). Aluminium was selected to emulate the experiment performed in[26], however, a plate thick-ness of almost 1.5 times higher than in[26]was selected due to the practical challenges of down-scaling. The aspect ratio of 1.1 contributed to the robustness and durability of the component against bending. The design data for the system is given inTable 1.
3.2.2. PCM containment
This innovative PCM container was 3-D printed usingAcrylonitrile butadiene styrene(chemical formula (C8H8)x·(C4H6)y·(C3H3N)z thermo-plastic polymer), commonly known as ABS thermo-plastic as opposed to tra-ditional manufacturing methods. To date, the PCM containment have been fabricated using machining and manually assembled using gluing, screwing and adhesives. The key reasons for 3D printing were to: (a) avoid the leakage issues associated with paraffin wax based PCM in molten state, (b) enable light-weight construction with ABS plastic (720–800 kg/m3) as compared to acrylic (1160–1200 kg/m3) or PMMA (1190–1230 kg/m3), (c) reduce overall manufacturing time (less than a working day as compared to three working days for other routes), save material (no wastage in trimmings and cuttings) and manual costs, and (d) improve scalability and ease of batch production for future use on a commercial scale. For printing the PCM containment for the micro finned plate,uPrint SE3D Printer powered byStratasys’patented FDM® (Fused Deposition Modelling™) technology was used. The three-step process for model creation and printing prescribed by the manufacturer was followed.
3.2.3. PCM
Organic paraffin wax based commercially available PCM, Rubitherm RT42 (melting range: 38–43 °C), was selected for the ex-periment due to its use in previous exex-periments which were emulated within this work. This solid-liquid PCM has a high latent heat of fusion (174 kJ/kg), low super-cooling, chemical non-reactiveness, low vapour pressure, self-nucleating properties, non-toxicity, environmentally friendly attributes and relatively cheaper costs (US$ 6.5/kg). The other important PCM technical specifications could be referred to from Table 2. It should be noted that the PCM used for the experimental purpose was recycled.
3.2.4. Nano-CuO
Copper (Cupric) oxide nanoparticle or nano-CuO with average particle size of 60 nm was selected as a TCE for the organic PCM, the
properties for which are given inTable 3.
The rationales for selecting CuO are given below:
•
Appreciable thermal conductivity (33 W/m K) in comparison to Silica nanoparticles (0.02 W/m K) and TiO2nanoparticles (0.7 W/ m K) etc. which have comparable costs.•
Low cost (US$59/100 g) compared to copper nanoparticles (US $399/100 g), 60 nm silicon nanoparticles (US $399/100 g) and 30 nm silver nanoparticles etc. (US $450/100 g).•
Non-oxidising and non-reactive with paraffin wax based materials.•
Ease of availability.•
Safe for use, non-toxic[82], whereas Alumina (Al2O3) nanoparticles are known for their environmental toxicity[83].3.2.5. n-PCM
The n-PCM was synthesised by mixing 0.5% (by mass) nano-CuO with PCM RT42 at 60 °C to ensure the fully melted state of the PCM. The mixture was then ultra-sonicated using a Hilsonic®ultra-sonicator machine for 24 h. The possibility of agglomeration within the nano-PCM was minimised by using the ultrasonic vibrator[84]. A low mass fraction of CuO was selected for the initial testing as the lower con-centrations of TCE were found to show higher energy storage capacity with lesser costs involved[56]. It was envisaged to investigate the ef-fect of variation in mass fraction on performance in a future work, hence this consideration does not fall in the immediate scope of this paper.
3.3. Experimental set-up and procedure
[image:6.595.318.545.513.729.2]For these experiments, two rectangular aluminium plates were considered, one un-finned for benchmarking purpose and another with plate micro-finned geometry. The aluminium plates (either with or without the machined micro-fins) werefitted on the 3-D printed PCM containment which was insulated with a 0.002 m thick polystyrene layer (0.03 W/m K) on all sides. The Kapton heaters were glued on the topflat surfaces of the plates, acting as a resistive heat source. 8.0 W DC electrical power input was applied using Aim-TTi EX354RD dual DC power supply. Temperature defining voltage and current were set to emulate the temperature rise in the BICPV system as experimentally determined in[26]. As the maximum temperature attained within the aluminium back plate under the highest possible solar irradiance (1200 W/m2) achieved using the solar simulator was 60 °C[26], for the
tests within the present experiment, 70 °C was reached at the selected DC V, I (i.e. at P = 0.8 W). This is to account for the insulation effect applied in this case contrary to the BICPV system, which was open on all sides for natural convection and if it was insulated to avoid radiative and convective losses, the temperature rise would have been higher. The schematic of the experimental set-up is shown in Fig. 4. The thermocouples, as shown by the dots, were located above the insulation layer to record the nearest ambient temperature, above the plate, under the plate and in the mid-section of the PCM containment to record the
central PCM temperature for the different configurations.
The instantaneous input current and voltage were recorded using a Fluke® 115 service engineer’s digital multi-meter. Temperature mea-surements were recorded every 5 s for 2.5 h using an RDXL12SD 12-channel temperature recorder. All the four K-type thermocouples were calibrated before taking measurements. They were attached at the centre of the top and the bottom side of the aluminium plate, in the middle of the PCM containment and over the insulation layer on top of the system (Fig. 4). An additional thermocouple was placed on the outer side of the containment wall in few configurations to detect the heat escaping through side walls. The entire experimental set-up was then enclosed within 0.2 m × 0.2 m × 0.2 m insulated walls, covered on top with an open front, to shelter it from any mechanical or environmental damages. All the experiments were carried out indoors under ambient temperature conditions between 25.6 °C and 27.7 °C and relative hu-midity between 21% and 33%. Each stage of the experiment was re-peated three times to take the experimental variability into considera-tion and the average of the three values are presented here. The system acquired steady state after 100 min in most cases from the experiment start up time. The following test cases/configurations were selected with all possible combinations of micro-fins, PCM and n-PCM: (i)flat (un-finned) plate, (ii) plate with PCM, (iii) plate with n-PCM, (iv) micro-finned plate, (v) micro-finned plate with PCM, and (vi) micro-finned plate with n-PCM.
3.4. DSC procedure
To analyse the thermophysical properties of the PCM and the n-PCM,Netzsch DSC 214 PolymaDSC was used. For material character-isation, 0.00001 ± 0.0000015 kg of the samples were manually weighed and sealed in an aluminium crucible with > 99.5% purity. The crucibles were selected in such a way that the difference in their mass was less than 0.00000001 kg, for ensuring measurement precision[85]. Abbreviation
(units) t (m) tb (m) s (m) H (m) W(m) L (m) n
Nomenclature Micro-fin thickness
Plate thickness
Spacing between micro-fins
Micro-fin height
Plate width
Plate length
No. of fins
[image:7.595.40.419.60.196.2]Magnitude 0.001 0.002 0.0005 0.0005 0.03 0.029 20
[image:7.595.307.557.236.364.2]Fig. 3.Enlarged view of the micro-fins and the table with nomenclature used and actual dimensions of thefins.
Table 1
Design data for the micro-finned-PCM system.
Parameter Definition Value
V Voltage applied (V) 8.0
I Current applied (A) 0.101
v Volume of PCM (m3) 0.0000475
A Area of the PCM containment wall (m2) 0.087
Tm PCM melting peak temperature (°C) 41.0
Tamb Ambient temperature (°C) 26.0
σ Stephan-Boltzmann constant (W m−2K−4) 5.670367 × 10⁻⁸
F View factor 1.0
HL Latent heat of RT42 (J kg−1) 174000
kp Thermal conductivity of RT42 (W m−1K−1) 0.20 ρPCM Density of RT42 at 15 °C (kg m−3) 880
Density of RT42 at 80 °C (kg m−3) 760
Density of RT42 at operating temperature (kg m−3)–Assumed
800
ρCuO Bulk density of nano CuO (kg m−3) 300–450
True density of nano CuO (kg m−3) 6310
Approximated density assumed for calculations 3380
ρnano Density of RT42 + 0.5% nano-CuO; Calculated (kg m−3)
803.06
CP, PCM Specific heat of RT42 solid (J kg−1K−1) 2000
CP, CuO Specific heat of nano-CuO; From literature
(J kg−1K−1)
2400
CP, nano Specific heat of RT42 + 0.5% nano-CuO;
Calculated (J kg−1K−1)
2002
χPCM Mass percentage of RT42 (%) 99.5
χCuO Mass percentage of CuO (%) 0.5
α Volumetric expansion coefficient (%) of PCM RT42
12.50
Table 2
Manufacturer-supplied technical data for RT42 (source: Rubitherm®data sheet[27]).
Thermophysical properties for RT42
Parameter Definition Value
ρ Density of RT42 (kg m−3) at 15 °C 880
Density of RT42 (kg m−3) at 80 °C 760
CP Specific heat of RT42 (J kg−1K−1) solid 2000
HL Latent heat of RT42 (J kg−1) 174,000
k Thermal conductivity of RT42 (W m−1K−1) 0.20
[image:7.595.38.290.239.505.2]α Volumetric expansion coefficient (%) 12.50
Table 3
Manufacturer-supplied physical and chemical properties for Nano-CuO.
Property Value
Average particle size (nm) 60 Purity (ICP test) > 99.8% Specific surface area (m2/g) 13.08
Colour Black
Morphology Nearly spherical
Bulk density (g/cm3) 0.3–0.45
True density (g/cm3)a 6.31
Components (contents) (μg/g, %) Ba (0.79), Cd (2.37), Co (6.32), Fe (86.9), Mg (71.1), Mn (3.16), Sr (2.37)
Components (contents) (%) Ca (0.04), K (0.03), P (0.03), Pb (0.01), Zn (0.02)
Components (others) Al, Cr, Li, Mo, Ni, Ti not tested
aTrue density is based on the ratio of the particle mass and its volume, which excludes
[image:7.595.38.288.541.633.2]The lids were perforated using the standard perforation tool to avoid the building of vapour pressure during phase change. The pans were then covered with the pierced lids and were cold welded using a manual mechanical sealing press. Two samples were tested for each type of PCM in order to ensure accuracy and repeatability in the results as the sample was arbitrarily selected from the bulk. For calibrating the instrument, five standards (C10H16, Indium, Tin, Bismuth and Zinc) were heated throughout their melting temperature range based on the identical conditions (such as atmosphere and heating rate), which were to be used in subsequent measurement runs with the samples. A com-parison was drawn between the theoretically known and the observed melting points of the standard materials to determine the resulting difference. In order to run the measurements on the samples and deduce their melting temperature and heat of fusion, the following procedure was adopted (Fig. 5):
(i) Baseline run: with two empty crucibles of the same mass, out of which one was the reference crucible. Aflat baseline was obtained (theempty pancurve in black inFig. 5).
(ii) Standard run: also called the calibration substance run with the Sapphire disc (the blue curve inFig. 5). In this, one crucible was run empty and the other one with a standard material of known specific heat and mass (Sapphire disc) were used. The smallest Sapphire disc (Ø = 0.00025 m) supplied with the instrument with the mass of 12.707 ± 0.005 mg was selected for the standard run.
(iii) Sample run: also called thesamplerun with the real sample (red curve inFig. 5), in which one empty reference crucible and another with a known sample material and mass was used.
To ensure that the samples undergo the same thermal cycle of charging and discharging, a temperature program was created inExpert mode of the DSC program, which is summarised here. The samples were cooled down to 0 °C from room temperature to standardise the begin-ning of the process. After maintaibegin-ning a 5-min isotherm at 0 °C, re-commended for achieving a uniform temperature distribution across, the samples were heated dynamically at the same rate to 75 °C followed by another 5-min isothermal heating (Fig. 6). The samples were then subjected to the cooling cycle from 75 °C to 0 °C at the same rate and an emergency cut-offwas set at 95 °C to avoid any accidental superheating failure. In a real world, a BICPV panel experiences a rapid transition in the heating rate under the sun from 10 K/min at the start to 2 K/min after reaching the steady state. To replicate this, three heating rates of 2 K/min, 5 K/min and 10 K/min were selected to study the effect of heating rate on the resulting values of thermophysical properties. Each run was repeated three times and thefinal values were averaged for accuracy and precision.
3.5. Experimental uncertainty and setup validation
[image:8.595.38.355.54.286.2]The uncertainty of the experimental and the calculation processes Fig. 4.Schematic of the experimental system set-up with the highlighted thermocouple locations.
[image:8.595.36.403.582.739.2]was measured as described by the previous works in thisfield[73,74], by applying the formula on propagation of errors for independent variables[87]. In particular, the error occurring in determining the heat transfer coefficient of air in an un-finned configuration was calculated to determine the experimental uncertainty, where the heat transfer coefficient, h, is defined in Eq.(3) [8]:
=
−
h Q
A ·(T T ) in
fins fins air (3)
where Qinis the input power, Afinsis thefinned surface extension and Tfinsand Tairare the steady state temperatures of thefins and of the air inside the containment respectively. Therefore, the uncertainty (Uh) was determined in Eq.(4) [8]:
⎜ ⎟ ⎜ ⎟ ⎜ ⎟
⎜ ⎟
= ⎛ ⎝
⎞ ⎠
+ ⎛ ⎝
⎞
⎠ + ⎛
⎝ −
⎞
⎠ + ⎛
⎝ −
⎞
⎠
Uh h
UQ Q
UA A
UT
T T
UT
T T
in
in
fins
fins
fins
fins air
air
fins air
2 2 2 2
(4) where the prefix U indicates the absolute uncertainty for each variable. In accordance with[73], a conservative uncertainty of ± 4% was considered for the surface area of the micro-finned/un-finned plate. The applied electrical power was calculated from the supplied current and voltage measurements, which were measured in the proximity of the input connections to the heater. In accordance with the previous stu-dies, no voltage drop was considered to have taken place in the wires between the power supply and the heater. All the uncertainties used in this analysis are shown inTable 4. Furthermore, an average deviation of 1.0% was measured between the voltage readings and thus, taken into account for this calculation.
Taking into account the steady state conditions, (8.0 V and 0.101 A of input, fin temperature of 68 °C and air temperature of 42 °C), an uncertainty of 12.6% was found in the calculation of the heat transfer coefficient. This value agrees with those reported in previous experi-mental micro-fins investigations[71,73,74]and is below the 20% un-certainty span generally considered acceptable for natural convection correlations[88].
The quality of the experimental setup was then validated through a 2D model built in COMSOL Multiphysics®5.2. Considering the simplest case of an initial investigation into validation modelling, it was based on a sufficiently appropriate 2D geometry. The behaviour of theflat surface, when exposed to air within the containment, was modelled and then compared with the experimental results. Theflat aluminium plate was reproduced on top of the setup (Fig. 7a), the containment box (Fig. 7b) was modelled using the built-in properties of acrylic plastic (1470 J/kg K, 1190 kg/m3and 0.18 W/m2K) and the centre of the set-up is depicted in Fig. 7c. A 1.5 cm thick insulating layer made of polystyrene (1900 J/kg K, 930 kg/m3and 0.38 W/m2K) was placed on each side of the containment box. A heatflux of 0.8 W was applied to the aluminium plate and natural convection forces were simulated on the exterior surfaces of the polyethylene. The bottom surface of the setup was assumed to be mounted on a surface large enough to be at a constant temperature, such as a table. Under steady state conditions, the model returned the results as shown inFig. 7, with a peak plate temperature of 70.9 °C, against the 68.0 °C experienced during the ex-periment. The temperature of the air at the centre of the box was found
to be around 43.0 °C. The modelled setup returned a coefficient of heat transfer of 33 W/m2K, which was about 8% lower than that registered in the experimental case. This difference falls within the experimental uncertainty calculated before, proving the reliability of the setup.
4. Results and discussion
4.1. Thermal characterisation of the micro-finned–PCM system
To emulate the temperature profile of the BICPV in the designed thermal system, insulatedflexible heaters working on the principle of resistive heating, were used. In order to select the appropriate values of the input voltage and current (V, I) to produce the output power re-quired to produce similar thermal effects, the un-finned plate was characterised for various input V, I combinations without PCM. The corresponding values of power and temperature were recorded for the duration of the experiment, at an interval of 30 min each. The resulting data is presented inTable 5. It was found that out of P = 0.52 W (at V = 5.0 V), P = 0.62 W (at V = 6.5 V) and P = 0.80 W (at V = 8.0 V), P = 0.80 W yielded the closest electrical power input required for pro-ducing the same thermal effect as reported for the BICPV in[26]. As can be seen, the maximum temperature reached by the system (under the plate) with P = 0.52 W was less than 46 °C and with P = 0.62 W was less than 57 °C. However, with P = 0.80 W, the maximum temperature reached was over 70 °C and hence, it proved to be the ideal power setting for emulating the BICPV temperature profile.
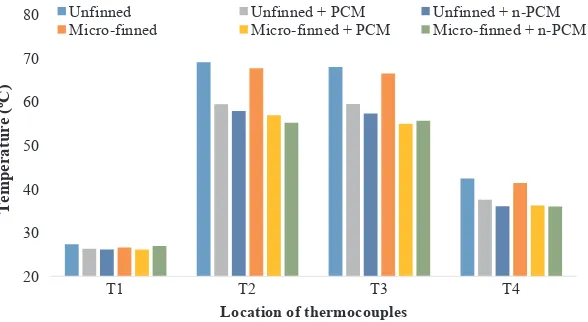
[image:9.595.38.347.53.166.2] [image:9.595.308.558.625.745.2]During the experimental run, the temperatures across the system were recorded at these points on a vertical section: (a) T1 or ambient temperature above the insulation layer, (b) T2 above the plate centre, (c) T3 below the plate centre, and (d) T4 at the centre of the PCM containment. A comparison of the average temperatures obtained across all the six configurations are given inFig. 8. The bar graph is plotted in such a way that the effect of introducing micro-fins on the un-finned surface can be easily compared for the three cases of using natural convection, PCM and n-PCM. As can be observed, the tem-peratures T2, T3 and T4 were recorded at their highest for the un-finned configuration, followed by the micro-finned configuration with only natural convection cooling. The same trend was followed for the con-figurations entailing the use of PCM and n-PCM respectively. It is to be Fig. 6.The temperature program for the thermal cycle with the dif-ferent temperature steps.
Table 4
Instruments’measurement uncertainties, as reported in the datasheets.
Instrument Datasheet’s uncertainty
Fluke®115 service engineers digital multi-meter
± (0.5% + 2 digits
DC voltage from 0.001 V to 600 V DC current from 0.001 A to 10 A
RDXL12SD 12-channel temperature recorder
± 0.4%Measurement range (K-type)
:−100 °C to 1300 °CMeasurement resolution (K-type)
: 0.1 °C below 538 °C, 1 °C above 538 °C
Aim-TTi EX354RD dual DC power supply
noted that the ambient temperature closest to the shielded set-up, T1, remained relatively unchanged for all the configurations, which was desirable for ensuring a constant ambient temperature throughout each run. The magnitude of the reduction in T4, the temperature at the centre of the PCM containment, was appreciable for the case with PCM and n-PCM. However, if either the experiment was run for a longer duration or the set-up used a greater amount of PCM/n-PCM, this value would be expected to change. For the cases (i), (ii), (iii), (iv), (v) and (vi), the maximum values of the temperature above the plate, T2, were registered as 72.1 °C, 66.1 °C, 63.5 °C, 71.7 °C, 63.8 °C, and 62.6 °C respectively. Similarly, the maximum values of the temperature below the plate, T3, were recorded as 70.2 °C, 65.6 °C, 60.8 °C, 63.3 °C, 63.0 °C, and 63.0 °C respectively. The maximum temperatures followed the same trend as the average temperature values.
The average temperatures across all the four locations have been shown in Fig. 9 to present an alternative visual perspective for the readers. As can be seen, T2, T3 and T4 were considerably higher in un-finned configurations compared to the micro-finned configurations. The use of both PCM and n-PCM, significantly reduced the average tem-perature. In the micro-finned systems, the average temperature at the plate centre was reduced by 10.7 °C (15.9%) with the use of PCM and by 12.5 °C (18.5%) with n-PCM. Similarly, in the un-finned system, PCM reduced the average temperature at the plate centre by 9.6 °C (13.9%), and n-PCM by 11.2 °C (16.2%). It was inferred from this data that micro-finned surfaces offered higher cooling potential compared to the un-finned surfaces, with at least 2% greater improvement with PCM and 2.3% with n-PCM. It can further be deduced that the sole use of micro-fins does little to reduce this temperature, while PCM provides a greater reduction in temperature for systems both with and without fins. Furthermore, enrichment of PCM with nanoparticles yields a small but noticeable decrease in temperature.
[image:10.595.47.280.55.320.2]On an average, the steady temperature at the centre of the plate measured below it, without any passive cooling provision, was reached within thefirst 100 min of the start-up. The temperature outside the PCM containment was measured to assess the extent of thermal in-sulation provided by the walls and for determining any radiative losses from the walls. It was observed that the walls were thermally insulated and only a small amount of heat could escape. The average tempera-tures below the plate, T3, for various configurations are plotted in Fig. 10. With natural convection, there was a rapid temperature rise in the beginning for both un-finned and micro-finned surfaces. The tem-perature reached 65 °C within thefirst 25 min of the start-up. However, with PCM, the temperature surpassed this value only for the un-finned configuration, after 120 min, thereby delaying the process by almost a factor of 5. For micro-finned surfaces with PCM, the temperature re-mained well below 64 °C for the entire duration of the experiment.
The temperature in the PCM containment centre was another area of interest, as this ascertains the extent of PCM phase transformation. The average temperature inside the centre of the PCM containment, T4, for all the configurations are plotted inFig. 11. As can be seen, both the surfaces, with and without micro-fins under natural convection, (a)
(b) (c) T1
T2
T3
T4
[image:10.595.38.325.406.741.2](b)
[image:10.595.39.289.413.568.2]Fig. 7.Results of the COMSOL model for an un-finned plate exposed to air under steady state conditions. Theflat aluminium plate, containment and air are marked as (a), (b) and (c) respectively; the polyethylene layer is not reported. The temperature scale is in °C, the dimensions are in mm. The locations of the thermocouples (T1, T2, T3 and T4) are re-presented as well.
Table 5
Temperature profile data for the un-finned aluminium plate under various V, I combi-nations for the duration of the experiment.
Temperature profile for various voltage settings
V (V) 6.5 5.0
P = V * I (W) 0.62 0.52
Under plate (T3) (°C) 0th hour 25.6 26.6
0.5th hour 54.8 44.2
1st hour 56.2 45.2
1.5th hour 56.3 45.5
2nd hour 56.7 45.8
2.5th hour 56.7 45.9
Centre of containment (T4) (°C) 0th hour 25.6 26.6
0.5th hour 36.7 33.1
1st hour 38.3 34.2
1.5th hour 38.5 34.4
2nd hour 38.8 34.8
2.5th hour 38.9 34.9
20 30 40 50 60 70
Unfinned Micro-finned Unfinned +
PCM Micro-finned + PCM Unfinned + n-PCM Micro-finned + n-PCM
Temperature (ºC)
Configurations
[image:10.595.39.338.599.733.2]experienced a much higher temperature rise during thefirst 40 min and exceeded 45 °C before 140 min. With the use of PCM, the un-finned surface reached its peak at 43.6 °C and the micro-finned surface re-corded 41.7 °C towards the end of the experiment. With the use of n-PCM, both the un-finned and the micro-finned surfaces remained below 41.5 °C throughout but there was very little difference in the tem-peratures for both the surfaces. The effect of nanomaterial addition seem more pronounced with the un-finned surface as compared to the micro-finned surface because the difference between the two curves was greater than for un-finned surfaces. The reason behind this is un-explored so far, and may require further detailed analysis to confirm.
The results from these experiments as discussed above are presented below in terms of four key parameters for understanding the eff ec-tiveness of each individual passive cooling media in isolation as well as in combination. Their respective contribution to the thermal regulation of the system was defined in terms of the difference in the average temperature reduction (ΔT in °C) achieved by the system in their pre-sence as compared to their abpre-sence. The two configurations were the un-finned and the micro-finned surfaces.
(i)PCM effectiveness – quantitatively determines the efficacy of PCM within the two configurations w.r.t. natural convection. Results showed that with the use of PCM, average temperature reduced by,ΔT = 9.6 °C (un-finned surface) versusΔT = 10.7 °C (micro-finned surface).
(ii)n-PCM effectiveness–quantitatively determines the efficacy of n-PCM in the system versus natural convection employed within the two configurations. n-PCM usage led to slightly higher temperature drop in the micro-finned surface, withΔT = 12.5 °C compared to the un-finned surface, withΔT = 11.2 °C.
(iii)n-PCM effectiveness (versus PCM) –compares the relative ef-fectiveness of n-PCM to that of PCM in the two configurations. It was found that configurations with n-PCM achievedΔT = 1.5 °C
(un-finned surface) versusΔT = 1.7 °C (micro-finned surface). (iv)Micro-fin effectiveness – quantitatively determines the eff
ec-tiveness of micro-finned surface w.r.t. the un-finned (flat plate) with the three temperature regulation media (natural convection, PCM and n-PCM). Comparing the results, it was found that the micro-fins were capable of achievingΔT = 1.3 °C (natural con-vection),ΔT = 2.5 °C (with PCM) andΔT = 2.7 °C (with n-PCM) as compared to the un-finned plate under the similar conditions respectively.
As can be noticed, the micro-finned systems exhibited more eff ec-tive thermal regulation as compared to the un-finned systems. In ad-dition, the configurations using PCM demonstrated higher temperature reduction in comparison to non-PCM systems and consequently n-PCM performed better than PCM in thermal regulation. Another interesting theoretical aspect of this attained temperature reduction can be its correlation with the increase in the output electrical power. Based on an analytical method, the achieved temperature reduction could be con-verted to the increase in electrical efficiency and consequently power production for a BICPV. Assuming the temperature coefficient of max-imum power point as−0.5%/°C[5], which is a ball parked value for the BICPV panel, 12.5 °C decrease in its average operating temperature using n-PCM with micro-fins will theoretically lead to an increase of as high as 6.25% in output power. Similarly, with the use of PCM and micro-fins, an 11.2 °C reduction in average temperature could increase the maximum output power by 5.60%. Even in the worst cases sce-narios of either using PCM with un-finned plate or PCM with micro-fins, a reduction of 10.7 °C and 9.6 °C will also result in 5.35% and 4.80% of electrical power gain respectively. It is worth noting the effect of each configuration on the heat transfer (Fig. 12).
Indeed, both for the un-finned and thefinned surfaces, replacing air with PCM led to an increase in heat transfer coefficient between 16% and 35%. These results further confirm the advantages of using PCM in 20
30 40 50 60 70 80
T1 T2 T3 T4
Temperature (ºC)
Location of thermocouples
[image:11.595.40.334.55.216.2]Unfinned Unfinned + PCM Unfinned + n-PCM Micro-finned Micro-finned + PCM Micro-finned + n-PCM
Fig. 9.Comparison of average temperatures depending on the location of the thermocouple. (Locations described inFigs. 4 and 7).
25 35 45 55 65 75
0 20 40 60 80 100 120 140 160
Tem
perature (ºC)
Time (Min)
Unfinned Micro-finned Unfinned + PCM Micro-finned + PCM Unfinned + n-PCM Micro-finned + n-PCM
[image:11.595.39.334.491.732.2]heat transfer applications and its potential as an effective coolant in BICPV systems. On the other hand, in accordance with the previous literature[70,74], the introduction offins causes a reduction in the heat transfer coefficient. A lower heat transfer coefficient should not be implied as a cause for reduction in thermal performance since it was mainly due to the fact that the heat transfer coefficient was calculated on the total surface area, which was larger whenfins were added. In-deed, by analysing the overallfin effectiveness, defined as the ratio of the heat transfer rate for each configuration to that of the natural convection based un-finned case, it can be seen that a combination of micro-fins and PCM can lead to an enhancement as high as 32%.
The thermal performance of the un-finned plate under the naturally convective condition was found to be superseded by the one with micro-fins, PCM, and n-PCM in increasing orders of effectiveness. From an initial visual inspection, the 3-D printed PCM containment, without joined, screwed or glued parts, showed significant improvement in leakage control in contrast to the issues faced during previous similar works. Another important observation during the course of the ex-periment was the limitation of mixing nano-CuO with paraffin wax; namely the segregation, agglomeration and deposition of the metal
oxide nanoparticles due to the difference in their densities. However, it could be concluded that the research problem of determining the ef-fectiveness of introducing micro-finned back-plate, PCM and n-PCM into BICPV systems has been answered but further questions are raised concerning the long term stability of these systems. The experimental
results presented within this paper provide promising foundations on which to build the next stage of the work. By introducing micro-finned back-plate and n-PCM into a utility-scale BICPV system, it would be possible to test their effectiveness not only through temperature reg-ulation, but also in terms of enhancing the output electrical efficiency of the BICPV systems.
4.2. Material characterisation of PCM and n-PCM
DSC was used for determining the thermal characteristics of both the PCM and n-PCM, qualitatively and quantitatively, with good ac-curacy and repeatability. The results from the analysis of thermo-physical properties are presented inTable 6(a) and (b). The melting/ solidification enthalpies were based on the tallest peak area on the DSC curve and the melting/solidification temperatures were the summit temperatures of the respective peaks. The values were determined for three heating rates of 10 K/min, 5 K/min and 2 K/min. The standard deviation based on a sample, for each DSC run were calculated using the standard formula. The relative percentage change (%Δ) in the value of n-PCM from the value of base PCM was calculated as per Eq.(5).
As is evident fromTable 6(a), the addition of nanomaterials led to a slight decrease in the melting enthalpy in the range of 2–4%, shown by the positive value for the relative change, %Δ, from the value of the base PCM. The melting temperature nominally increased in the range of 0.5–1.5% for the lower heating rates, as shown by the negative values 25
27 29 31 33 35 37 39 41 43 45 47
0 20 40 60 80 100 120 140 160
Tem
pera
ture (º
C)
Time (Min)
[image:12.595.40.337.56.210.2]Unfinned Micro-finned Unfinned + PCM Micro-finned + PCM Unfinned + n-PCM Micro-finned + n-PCM
Fig. 11.Temperature (average) profiles inside the PCM containment centre (T4) for six different configurations.
= Mean value of the property for PCM−Mean value of the property for n−PCM ∗ Mean value of the property for PCM
%Δ {( ) ( )} 100
(5)
0.9 1.0 1.1 1.2 1.3 1.4 1.5
0 10 20 30 40 50
Unfinned Unfinned +
PCM Unfinned + n-PCM Micro-finned Micro-finned + PCM Micro-finned + n-PCM
Fin effectiveness
Heat transfer coefficient (W/m
2K)
Heat transfer coefficient for all six configurations
Heat transfer coefficient Fin effectiveness
[image:12.595.38.337.595.739.2]of %Δand decreased for a higher heating rate. The results exhibited similar trends as[63,65]in that they show no specific correlation be-tween nanoparticle addition/increase in concentration, heating rate and melting temperature. However, heat capacity values followed a definite decrease with increasing concentration or mass ratio. For the solidification process (Table 6(b)), the absolute values for enthalpy showed about a 2% increase in n-PCM for lower heating rates while a slight increase was observed at a higher heating rate. The solidification temperature showed an increase for n-PCM albeit the variation in the values were very high, the reason behind this is yet to be determined. For determining the thermal conductivity of the n-PCM, theMaxwell GarnettEquation, Eq.(6) [89]was used.
= + + −
+ − −
k k k k k k
k k k k
{ 2 2( )Φ}.
2 ( )Φ
n PCM
n p n p p
n p n p
,
(6) where kn,PCMis the thermal conductivity of the resulting PCM, knis the thermal conductivity of the dispersed nanomaterial (for nano-CuO, knis 33 W/m K), kpis the thermal conductivity of the dispersion medium (for PCM RT42 kp is 0.20 W/m K) and Φ is the particle volumetric concentration (corresponding to a mass fraction of 0.5%). The effective thermal conductivity of the n-PCM using this analytical method was calculated as 0.2007 W/m K; an increase of 0.35% from the thermal conductivity value for the base PCM.
5. Conclusions
Efficient operation of BIPCV at elevated temperatures is a challenge that needs to be addressed to meet our growing demands for clean electricity. While the total installed PV capacity exceeds 303 GW globally, it has become more crucial to explore effective thermal reg-ulation mechanisms. It is estimated that a 10 °C decrease in the average PV temperature could correspond to a 15.15 GW increase in output electrical power worldwide. In this work, experiments were conducted to quantify and assess the suitability of combined passive mechanisms for the thermal regulation of BICPV. An un-finned and a micro-finned aluminium plate emulating the temperature profile of a BICPV back plate were cooled using PCM and n-PCM. Micro-fins have extensively been used within electronic devices, however, their application with PCM/n-PCM for thermal regulation of low concentration BICPV systems is a novel idea with no record found in the literature to date. These six configurations were tested: (i) un-finned plate, (ii) un-finned plate with
PCM, (iii) un-finned plate with n-PCM, (iv) micro-finned plate, (v) micro-finned plate with PCM and (vi) micro-finned plate with n-PCM. Both PCM and n-PCM samples were characterised for examining and comparing their thermophysical properties such as melting/solidifi ca-tion temperature and the associated latent heats. The important ob-servations are summarised below.
•
In the un-finned system, PCM reduced the average temperature at the centre by 9.6 °C (13.9%) and n-PCM by 11.2 °C (16.2%).•
The micro-fins reduced the temperature by 10.7 °C (15.9%) withPCM and by 12.5 °C (18.5%) with n-PCM, suggesting higher cooling potential in micro-finned surfaces compared to the un-finned sur-faces.
•
Baseline comparisons were performed for the un-finned and the micro-finned heat sinks and it was found that thefin effectiveness in natural convection, with PCM and with n-PCM, was demonstrated by the decrease in average central plate temperature by 1.3 °C, 2.5 °C and 2.7 °C respectively.•
Quantifying the effectiveness of individual elements led to the conclusion that the effectiveness of n-PCM in isolation was the highest followed by PCM. Micro-fins were not as effective when used in isolation.•
The use of PCM produced a clear enhancement in heat transfer for each configuration. Indeed, enhancements as high as 35% in heat transfer coefficient were registered when air was replaced with PCM. Moreover, it was demonstrated that a combination of PCM and micro-fins can result in afin effectiveness as high as 1.32.•
Producing micro-fins on the back plate of the BICPV module couldprove beneficial in terms of material usage and by providing light-weight constructions.
•
To address PCM leakage, high manufacturing turnaround time, and associated costs, the PCM containment was fabricated using 3-D print technology. This approach for manufacturing PCM contain-ments using additive layer manufacturing technology has not been reported elsewhere and could pave the way for its future use.•
After successive heating and melting cycles, the n-PCM showedvi-sual signs of agglomeration and deposition of nano-CuO due to the difference in their densities. In future work, other forms of TCE or nano-particles with a density of the similar order as the base PCM could be used to overcome this.
[image:13.595.37.559.79.298.2]•
From the DSC investigation, the melting/solidification temperatures Table 6Thermophysical properties of PCM and n-PCM: (a) Melting enthalpy and Melting point, and (b) Solidification enthalpy and Solidification point.
Melting enthalpy (J/g) Melting temperature (peak) (°C)
Material Rate (K/min) Run 1.1 Run 1.2 Run 1.3 Mean Std. Dev. %Δ Run 1.1 Run 1.2 Run 1.3 Mean Std. Dev. %Δ
(a)
PCM 10 150.7 150.6 146.4 149.2 2.45 46.3 46.0 46.0 46.1 0.17
5 150.7 153.3 152.6 152.2 1.35 43.7 43.7 43.5 43.6 0.12
2 142.4 142.4 142.8 142.5 0.23 42.2 42.3 42.3 42.3 0.06
n-PCM 10 144.9 143.8 146.7 145.1 1.46 2.7 45.4 45.4 45.7 45.5 0.17 1.3
5 145.9 146.3 148.4 146.9 1.34 3.5 43.9 44.4 44.3 44.2 0.26 −1.3
2 137.4 136.6 137.9 137.3 0.66 3.7 42.4 42.5 42.7 42.5 0.15 −0.6
Solidification enthalpy (J/g) Solidification temperature (peak) (°C)
Material Rate (K/min) Run 1.1 Run 1.2 Run 1.3 Mean Std. Dev. %Δ Run 1.1 Run 1.2 Run 1.3 Mean Std. Dev. %Δ
(b)
PCM 10 −142.1 −147.6 −146.3 −145.3 2.87 32.8 32.8 32.7 32.8 0.06
5 −158.1 −157.4 −157.5 −157.7 0.38 36.1 36.1 36.2 36.1 0.06
2 −160.3 −160.5 −159.8 −160.2 0.36 25.1 25.1 25.0 25.1 0.06
n-PCM 10 −142.9 −147.8 −147.0 −145.9 2.63 −0.4 34.4 34.4 34.1 34.3 0.17 −4.7
5 −153.0 −153.7 −155.5 −154.1 1.29 2.3 36.5 36.2 36.2 36.3 0.17 −0.5