Pharmaceutics, Drug Delivery and Pharmaceutical Technology
Characterization of the Pore Structure of Functionalized Calcium
Carbonate Tablets by Terahertz Time-Domain Spectroscopy and X-Ray
Computed Microtomography
Daniel Markl
1, Parry Wang
1, Cathy Ridgway
2, Anssi-Pekka Karttunen
3,
Mousumi Chakraborty
4, Prince Bawuah
4, Pertti P€
a€
akk€
onen
4, Patrick Gane
2,5,
Jarkko Ketolainen
3, Kai-Erik Peiponen
4, J. Axel Zeitler
1,*1Department of Chemical Engineering and Biotechnology, University of Cambridge, Cambridge, UK 2Omya International AG, Oftringen, Switzerland
3School of Pharmacy, Promis Centre, University of Eastern Finland, Kuopio, Finland 4Institute of Photonics, University of Eastern Finland, Joensuu, Finland
5Department of Bioproducts and Biosystems, School of Chemical Engineering, Aalto University, Aalto, Helsinki, Finland
a r t i c l e i n f o
Article history:
Received 19 January 2017 Revised 23 February 2017 Accepted 24 February 2017 Available online 4 March 2017
Keywords:
refractive index spectroscopy
physical characterization solid dosage form imaging methods mechanical properties mathematical models
a b s t r a c t
Novel excipients are entering the market to enhance the bioavailability of drug particles by having a high porosity and, thus, providing a rapid liquid uptake and disintegration to accelerate subsequent drug dissolution. One example of such a novel excipient is functionalized calcium carbonate, which enables the manufacture of compacts with a bimodal pore size distribution consisting of larger interparticle and
fine intraparticle pores. Five sets of functionalized calcium carbonate tablets with a target porosity of 45%-65% were prepared in 5% steps and characterized using terahertz time-domain spectroscopy and X-ray computed microtomography. Terahertz time-domain spectroscopy was used to derive the porosity using effective medium approximations, that is, the traditional and an anisotropic Bruggeman model. The anisotropic Bruggeman model yields the better correlation with the nominal porosity (R2¼0.995) and it provided additional information about the shape and orientation of the pores within the powder compact. The spheroidal (ellipsoids of revolution) shaped pores have a preferred orientation perpen-dicular to the compaction direction causing an anisotropic behavior of the dielectric porous medium. The results from X-ray computed microtomography confirmed the nonspherical shape and the orientation of the pores, and it further revealed that the anisotropic behavior is mainly caused by the interparticle pores. The information from both techniques provides a detailed insight into the pore structure of pharmaceutical tablets. This is of great interest to study the impact of tablet microstructure on the disintegration and dissolution performance.
©2017 The Authors. Published by Elsevier Inc. on behalf of the American Pharmacists Association®. This is an open access article under the CC BY license (http://creativecommons.org/licenses/by/4.0/).
Introduction
Overall in the pharmaceutical market, tablets continue to be the most convenient way to deliver an active pharmaceutical ingredient (API) to the patient. In industrial practice, the
tableting and delivery functionality of a formulation are domi-nated by the physical and chemical properties of the excipients and API particles, and in most cases, the excipients represent by far the greater quantity in a tablet compared with API. Therefore, it is not surprising that they play a crucial role in defining the ease of tableting and in improving the disintegration and disso-lution performance of the dosage form.1,2The design of targeted drug release requires specialist development of functional ex-cipients, for example, to provide rapid oral dispersibility or to prolong the drug release.
Due to its goodflowability and excellent compressibility, one of the most commonly used of such excipients is microcrystalline cellulose (MCC). Additionally, and very importantly for its Additional data related with this publication are available at the Cambridge
University repository (https://dx.doi.org/10.17863/CAM.8476).
This article contains supplementary material available from the authors by request or via the Internet athttp://dx.doi.org/10.1016/j.xphs.2017.02.028.
*Correspondence to:J. Axel Zeitler (Telephone:þ44 (0) 1223 334783; Fax:þ44 (0) 1223 334796).
E-mail address:[email protected](J.A. Zeitler).
Contents lists available atScienceDirect
Journal of Pharmaceutical Sciences
j o u r n a l h o me p a g e : www .j phar m sci .o rg
http://dx.doi.org/10.1016/j.xphs.2017.02.028
functionality, MCC absorbs water, both into the interparticulate pore structure3,4and by diffusion into the cellulose intraparticle space.5Together with the excellent surface wetting properties by water, this makes MCC an excipient for a broad spectrum of ap-plications ranging from orally dispersible tablets6 to controlled drug delivery.7 However, its use in orally dispersible tablets is constrained due to its limited capability of achieving tablet poros-ities>40%. High porosities are desirable as the pore structure of a tablet have strong impact on the liquid penetration in a tablet, which is in the majority of cases the limiting step during disinte-gration. Furthermore, poor solubility in gastricfluids is a common problem for newly developed drug candidates. Effective disinte-gration of a tablet is, thus, critical in maximizing the exposure time of the API to gastric and intestinalfluids so that the API can be absorbed at higher rates, leading to increased bioavailability and a faster onset of the desired pharmacologic effect.
To overcome the limitation in terms of the maximum achievable porosity, porous particle excipients are being developed to enhance liquid imbibition and, hence, the disintegration and dissolution performance. Such a novel excipient is functionalized calcium carbonate (FCC), which has a very high intraparticle porosity to facilitate rapid liquid uptake. Compacts of this excipient, therefore, display a discretely separable bimodal pore size distribution, composed of larger interparticle andfine intraparticle pores.8If the formulation or tableting process requires it, the particles can be agglomerated or granulated providing an additional even larger pore size region associated with intergranulate pores. This new generation of excipient was shown to be particularly effective in forming resilient tablets at low density and in vitro ultra-rapid tablet dissolution, exceeding the rate seen with MCC by typically a factor of 10.9 The performance of such tablets, thus, strongly depends on the pore structure, which is commonly characterized by the porosity, that is, the ratio between the void volume and the bulk volume.
Terahertz time-domain spectroscopy (THz-TDS) has recently emerged as a promising analytical tool for the characterization of pharmaceutical materials to analyze the pore structure and quan-tify its porosity. The terahertz domain (100 GHz to 3 THz) lies in between the infrared and microwave regions within the electro-magnetic spectrum. Compared with NIR, mid-IR, and Raman spectroscopy, THz-TDS is inherently less vulnerable to scattering effects due to its longer wavelength (100
m
m to 3 mm) and it is, therefore, a very attractive technique to characterize porous phar-maceutical tablets, such as FCC powder compacts.In THz-TDS, pharmaceutical tablets are characterized on the basis of their effective refractive index,neff, which is then used to calculate the porosity of the powder compacts in combination with effective medium theory. Effective medium approximations (EMAs) were developed extensively during the last century to model the effective permittivity,εeff, of porous media based on the Maxwell-Garnett10and the Bruggeman11formalisms. The Maxwell-Garnett approximation is only valid for a low-volume fraction of in-clusions, whereas the Bruggeman formalism can be applied to approximate the effective medium for highly porous systems.
In previous studies, the traditional Bruggeman model was used to predict the porosity (up to approximately 40%) of MCC powder compacts,12and it was assumed that the pore shape can be approximated by a spherical geometry. These assumptions, however, may not be valid for all pharmaceutical powder com-pacts as discussed in this study. We applied a modification of the traditional Bruggeman model13to account for nonspherical pore shapes and compared this with the traditional approach. Furthermore, the terahertz measurements can provide additional information about the pore arrangement by calculating the so-called S parameter, which considers the pore network as a
combination of pore components in series and parallel assem-bly.14 The results from the terahertz measurements are com-plemented and compared with characteristic pore structure parameters extracted from X-ray computed microtomography (X
m
CT). The Xm
CT analysis specifically focused on characterizing the orientation and shape of the pores, which were compared with the results from the terahertz measurements. These meth-odologies were studied for 5 different sets of tablets with porosity levels ranging from 45% to 65%.Materials and Methods
Materials
The powder compacts used in this study consisted of FCC (Omyapharm®; Omya International AG, Oftringen, Switzerland) particles. FCC is a shell-core structure of lamellar hydroxyapatite surrounding agglomerated ultrafine calcium carbonate particu-lates, respectively. This is formed in a process whereby the surfaces of calcium carbonate particles are etched and then re-precipitated to create a highly porous plate-like, nanometre thick lamellar structure of high surface area. A typical pharmaceutical FCC particle consists of a calcium carbonate/hydroxyapatite ratio of 15%-20% calcium carbonate to 80%-85% hydroxyapatite.
The FCC powder was directly compressed into flat-faced, cylindrical tablets with target thicknesses of 1.5 mm and target diameters of 10 mm using a compaction simulator (PuuMan Ltd, Kuopio, Finland). Given the highly porous nature of the FCC parti-cles, it was possible to manufacture tablets with target total porosities of 45%-60% with 5% increments. The batches were labeled as B01-B05 (low to high porosity) as listed inTable 1and each batch consisted of 15 tablets.
Mass (m), thickness (H), and diameter (D) of each tablet were measured using a precision balance (Ohaus Corp., Parsippany, NJ) and a micrometer (Expert Metric External Micrometer 0-25 mm; Draper Expert, Hampshire, UK) with measurement uncertainties of ±0.1 mg and±1
m
m, respectively. The porosity (henceforth referred to as the nominal porosity) can be calculated byfnominal¼
1 4m
pD2H9 true
(1)
with9true¼2:958±0:062 g cm3(5 repeats) as the true density of FCC. The true density of FCC powder was measured with a helium pycnometer (Multipycnometer MVP-1; Quantachrome Corporation, New York, NY). Before the measurement, volatile contaminants were removed by degassing the sample by a helium purge.
Terahertz Time-Domain Spectroscopy
Terahertz time-domain (TD) measurements were acquired using a Terapulse 4000 spectrometer (Teraview Ltd., Cambridge, Table 1
List of Batches Characterized in This Study
Code Mass Thickness Diameter Porosity
m, mg H, mm D, mm fnominal, %
B01 217±2 1.67 10.04 45.50±0.52
B02 190±2 1.64 10.03 50.27±0.50
B03 168±2 1.63 10.02 55.72±0.40
B04 147±3 1.62 10.02 61.02±0.93
B05 122±3 1.61 10.00 67.35±0.79
UK) in a transmission setup. The transmission chamber was purged with dry nitrogen gas throughout the measurement and the noise reduced by co-averaging 60 measurements. Each TD waveform covered a range of 150 ps using a resolution of 0.1 ps, and the total measurement time of the co-averaged waveforms was 1.5 min.
The effective refractive index,neff, of a sample can be calculated from terahertz TD measurements either by simply comparing a reference waveform (i.e., no sample present in the measurement chamber) and the sample waveform in the TD or by transforming the waveforms in the frequency-domain (FD) and applying Beer-Lambert’s law. In case of the TD analysis, the effective refractive index (neff) of the tablet is related to the pulse delay (Dt) by
Dt¼H
neffn0
c ; (2)
where c is the speed of light in vacuo and n0¼0 is taken to approximate the refractive index of ambient air (n¼1:0003).
neff and the effective absorption coefficient,aeff, of each tablet can also be determined in the FD. The terahertz waveforms of the reference and the sample are transformed to the FD by a fast Fourier transform. The frequency-dependentneff andaeff are then calcu-lated by assuming the tablet as a homogeneous medium. Theneff evaluated at one specific frequency can then be used to calculate the tablet porosity as discussed in the next section.
Pore Structure Analysis Using THz-TDS
The porosity of a sample can be determined fromneff, which was calculated either in TD or in FD. This can be performed by applying the zero porosity approximation (ZPA) or using models from the effective medium theory, where the pores and the solid matrix, that is, skeletal material forming the pore walls in the FCC powder are considered as the dispersed and the continuous phase, respectively. In general, the porosity determined by THz-TDS cap-tures the intraparticle pores and the interparticle pores, where both void spaces include open and closed pores, if the latter also exists.
Zero Porsosity Approximation
ZPA is a linear extrapolation technique, which relatesneff and the porosity of the tablet by assuming a linear relationship between the 2 variables. For tablets with only 1 component, FCC, the following equation applies12,15
neffðfÞ ¼nFCCþ ð1nFCCÞf; (3)
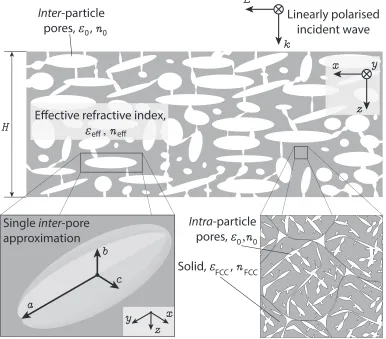
[image:3.594.94.480.72.411.2]nFCC is the intrinsic refractive index of FCC, which can be deter-mined using theneffof samples with known porosity. We want to stress here thatnFCCrefers to the skeletal material of the FCC par-ticle, that is, without the intraparticle pores, as illustrated in the inset ofFigure 1. The porosity can be calculated from different in-formation, the method of which is given in the subscript of Figure 1.Schematic of the tablet exposed to a linearly polarized terahertz wave.kis the unit vector in the direction of propagation of the horizontally (parallel to they-axis) linear-polarized incident terahertz wave. The tablet which consists of intra- and interparticle pores with the permittivity of ambient air (ε0¼n20¼1). The intrinsic permittivity and
f throughout this article. ZPA can also be used to predict the porosity for a knownneffby rearrangingEquation 3.
Bruggeman Model
Polder and van Santen13introduced the concept of a depolari-zation factor,L, to consider the effect of a nonspherical shape of the inclusions. They approximated inclusions as spheroids (ellipsoids of revolution), which have a unique major axisaand 2 common minor axesbandc, as illustrated inFigure 1. The terahertz measurements were conducted by focusing the linearly polarized terahertz radi-ation onto the tablet face, and therefore,εeff was only measured when the electricfield,E, was aligned in parallel with thex-axis. In general, the anisotropic Bruggeman model, AB-EMA, for a 2-component system can be expressed as16
0
@ εaεeff εeffþLεaεeff
1 Afaþ
0
@ εbεeff εeffþLεbεeff
1
Afb¼0: (4)
faandfbare the volume fractions of componenta(skeletal fraction of the FCC material in the particulate powder) andb(air), which are substituted byfa¼1f(solid fraction) andfb¼f(porosity) in this study. The intrinsic permittivities are substituted byεa¼εFCCand εb¼1.εFCC andnFCC correspond to the optical properties of the skeletal material of an FCC particle, and this definition is used throughout this study whenever we refer to the intrinsic permit-tivity, intrinsic refractive index, an FCC particle, or FCC powder. SettingL¼1/3 yields the traditional Bruggeman model (henceforth referred to as TB-EMA) as it was used in the past to model phar-maceutical tablets.17
Determination of a Structural Parameter
Recently, Bawuah et al.14 proposed a structural parameter (S parameter), which is based on Wiener bounds and theneff of a porous medium. The Wiener bounds forεeff of a porous medium are determined by considering the constituents within the tablet as equivalent to different dielectrics in parallel and series connection within a capacitor and dealing with the total capacitance. The up-per and lower Wiener bounds,nUandnL, are the 2 extreme cases when both constituents (FCC powder and air) are either in series or in parallel connection. Assuming the absence or presence of only weak absorption of terahertz waves by the material under inves-tigation, the Wiener bounds can be expressed as
nU¼
ffiffiffiffiffiffiffiffiffiffiffiffiffiffiffiffiffiffiffiffiffiffiffiffiffiffiffiffiffiffiffiffi
fþ ð1fÞn2 FCC q
; (5)
nL¼
ffiffiffiffiffiffiffiffiffiffiffiffiffiffiffiffiffiffiffiffi 1 f þ
1f n2
FCC s
: (6)
By making no assumptions about the shape of the microstruc-tures in the porous medium and treating the problem analogous to heat conduction,Scan be expressed as
S¼ 1
n2
Un2L
n2
Un2L
n2 eff n2 L ! : (7)
Pore Structure Analysis Using X-Ray Computed Microtomography
The pore structure was analyzed by acquiring high-resolution 3D data of 4 FCC tablets using X
m
CT. A SkyScan 1172 (Bruker, Antwerp, Belgium) was used to image the samples with an isotropic voxel sizeof 0.47
m
m. This instrument uses a cone beam geometry and a 2-dimensional array detector. The object is rotated through 180 with steps of 0.25. The actual 3-dimensional (3D) data were reconstructed using NRecon (v1.6.8.0; Bruker) and further pro-cessed with Avizo Fire as proposed in Markl et al.18for the analysis of 3D printed tablets. The pore network is extracted from the Xm
CT data by thresholding and a marker-controlled watershed algorithm using defined foreground and background regions. The watershed algorithm generates a topographical map from the image gradient and so detects catchment basins and watershed ridge lines. These data are then used to separate touching pores and to assign each voxel in the pore space to the relevant specific pore. The pore vol-ume is, thus, always a multiple of the voxel volvol-ume (0.473mm3).Pore Structure Analysis Using Mercury Porosimetry
An Autopore V mercury porosimeter (Micromeritics Instrument Corporation, Norcross, GA) was used to perform mercury intrusion measurements. Mercury porosimetry measurements were con-ducted for the FCC powder to determine the intraparticle porosity and for 1 compacted tablet per batch to analyze the pore size distributions.
Roughness Analysis
Several studies have already demonstrated the characterization of the surface roughness of pharmaceutical tablets with the aid of a laser stylus.17,19-21A noncontact optical interference profilometer (WYKO NT9300; Veeco, Plainview, NY) was used to quantify the average surface roughness,Ra, of the FCC tablets. The principle of the profilometer was presented in detail in Bawuah et al.17
Results
Terahertz Time-Domain Spectroscopy
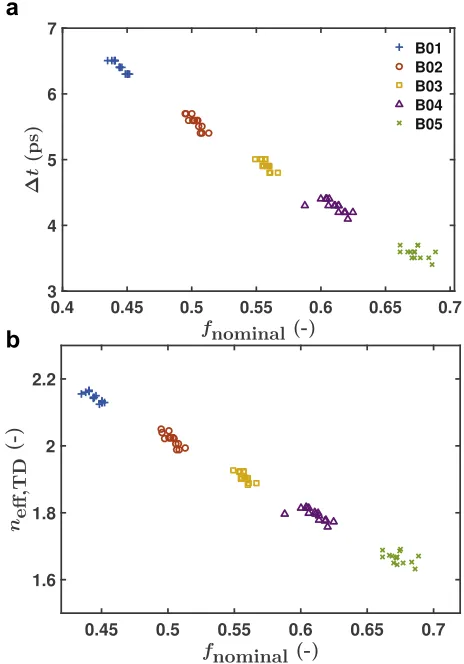
Since all tablets were compacted to the same target thickness, the measured pulse delay difference,
D
t, between the terahertz sample and reference waveforms and the effective refractive index depend linearly on the nominal porosity,fnominal (Fig. 2). Therefore, bothD
tandneffdecrease with increasing porosity.The frequency-dependentneff is shown inFigure 3andaeff is presented in theSupporting Information. No peaks are observed in aeff indicating the absence of phonon vibrations in FCC at terahertz frequencies. Moreover, the long wavelength (100
m
m-3 mm) of the terahertz radiation obviates the need to consider Mie scattering because the particulate material size (5m
m), in its primary form, lies below the scattering limit for this wavelength region.L¼ 1
1þ1:6ða:bÞ þ0:4ða:bÞ2: (8)
L¼0.21, thus, yields an aspect ratio, a:b, of 1.7. Although the pore shape derived from the depolarization factor is only a rough approximation of the actual geometry, it evidences a nonspherical pore shape with a preferred major axis perpendicular to the compaction direction. It is important to note that the assignment of the axesxandy(seeFig. 1) is arbitrary, and therefore, we cannot analyze the orientation of irregularly shaped pores around the z-axis using the current concept. However, the absence of bire-fringence and, thus, absence of any anisotropic behavior in thex-y plane, was experimentally verified by rotating 1 FCC tablet of each batch over 315at 45increments aroundz-axis and performing a terahertz measurement at every step. The changes between the 8 measurements of every tablet were below the resolution of the used terahertz setup, and therefore, no anisotropic effect in thex-y plane could be observed. The results of X
m
CT also support this finding by revealing that there is no preferred orientation of the pores around thez-axis (seeFig. S5 in the Supporting Information). The statistical analysis of the different models as summarized in Table 2emphasizes that the AB-EMA using from the FD analysis is more favorable compared with the other approaches. The ZPA (data are provided in the Supporting Information) is also highly appli-cable for the tablets used in this study due to the fact that it does not make any assumption of a specific shape of the pores. There-fore, the porosity calculations from both methods are highlyaccurate, but ZPA does not provide any information about the pore shape. The high correlation of the porosity calculations from both methods confirms the assumption made for the AB-EMA on the shape of the pores, and it particularly highlights the high level of confidence of the depolarization factor from the AB-EMA. More-over, thenFCC¼2:97 (AB-EMA and FD) is in good agreement with the refractive index at terahertz frequencies for calcium carbonate as determined by Peiponen et al.23We want to remind the reader once again at this point that the intrinsic refractive index,nFCC, refers to that of the skeletal material of an FCC particle, and thus, it does not include the intraparticle pores.
Furthermore, we assume for the interpretation of the results of the TB-EMA and AB-EMA that compacted FCC powder is not bire-fringent. Although calcium carbonate is birefringent in the form of a single crystal, we support thefinding above of no linked measur-able anisotropy about the rotationalz-axis between structural and optical response by the assumption that the calcium carbonate crystallite domains are randomly oriented throughout the FCC structure due to the reconstituting process derived from many reacted original calcium carbonate microparticle building blocks. The very small size (z10 nm) and the randomized orientation of the remaining calcium carbonate domains within each FCC particle, and the further randomization of the FCC particles in the compact, should, therefore, render birefringence of the powder compact immeasurably small.
[image:5.594.309.542.64.380.2]The change of the structural arrangement of pores can also be studied on the basis of theSparameter (Eq. 7). Although the pores are nonspherical, the S parameter can be used to analyze such samples as it is based on the Wiener bounds, which again do not Figure 3.Effective refractive as a function of (a) frequency and (b) the nominal porosity. In (a), the solid lines are the average for each batch and the shaded area corresponds to the SD within each batch. In (b), the effective refractive index was evaluated at 1 THz.
a
b
Figure 2.(a) Pulse delay difference,Dt, and (b) effective refractive index,neff, as a
function of the nominal porosity (Eq. 1).neffis calculated by usingEquation 2under
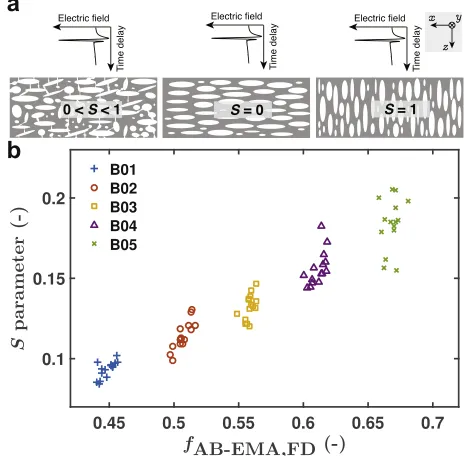
[image:5.594.41.273.70.402.2]make any assumptions regarding the geometry and degree of isot-ropy.24,25The samples in this study only consist of one excipient, and thus, we can be sure that changes in theSparameter are purely related to structural variations of the pores. In general, the S parameter reflects changes in the structural arrangement of pores, where the extreme case ofS¼0 corresponds to a series arrangement with respect to the compaction direction, as schematically illus-trated inFigure 5a. The Sparameter additionally depends on the porosity (Fig. 5b), which makes the interpretation of the structural changes on the basis of the S parameter more difficult. Further research is required to separate the influence from the porosity and from the structural arrangement of the pores on theSparameter.
The variance in theSparameter of each batch is significantly higher than that of the porosity, and it also increases with
increasing porosity, which clearly indicates that theSparameter reflects changes of the interparticle pore structure. Since all batches were manufactured from the same batch of FCC powder, the intraparticle pore structure is assumed to be very similar for all tablets and batches. The FCC particles have an inherent porosity of about 25%, and the intraparticle porosity, thus, strongly contributes to the total porosity of the powder compact. The porosity associated with the intraparticle pores was derived from mercury porosimetry measurements of the FCC powder. Therefore, the inherent porosity was calculated by multiplying the specific intraparticle pore vol-ume with the bulk density of the measured powder (seeSupporting Informationfor more details).
The porosity of tablets from batch B01 is particularly affected by the intraparticle pores, which also feature a very consistent arrangement of the pores as revealed by the small variations in the Sparameter of these tablets. Therefore, the observed changes of the pore structure are primarily variations of the interparticle pores as the intraparticle pores were not affected by the compaction. The assumption that the intraparticle pores remain unchanged is sup-ported by the mercury porosimetry data as discussed below.
Pore Structural Characterization by X
m
CTCharacteristic pore structural parameters from X
m
CT measure-ments are summarized inTable 3. Because the measured tablets from the same batch show almost identical values across the different parameters, we present in the following only the data of one tablet per batch. Unsurprisingly, the average porosity, equiva-lent diameter, pore volume, and pore length are larger for the tablets from B05 compared with those from B02. The porosity from the Xm
CT measurements is significantly lower than the nominal porosity (50% and 65% for B02 and B05, respectively). [image:6.594.320.553.72.300.2]Due to the intraparticle pores having a pore size distribution with its mean at 200 nm, a large portion of the intraparticle pores cannot be resolved using the X
m
CT technique given the resolution limit of 0.47m
m for the instrument in our laboratory. However, the Table 2Comparison of the Results of ZPA (Eq. 3), TB-EMA (Eq. 4WithL¼1/3), and AB-EMA (Eq. 4)
Variable TB-EMA AB-EMA ZPA
TD FD TD FD TD FD
R2 0.935 0.936 0.993 0.995 0.995 0.995
RMSE 103 21.5 21.3 6.8 5.5 5.9 5.9
nFCC 3.35 3.37 2.96 2.97 3.08 3.09
R2and the RMSE were calculated for the porosity predicted by the respective model
and the nominal porosity.neffwas determined for each model using nefffrom the TD
and from the FD analysis. RMSE¼root mean squared error.
a
b
Figure 5.(a) Schematic for the interpretation of theSparameter. (b)Sparameter as a function of porosity. The porosity was predicted from the AB-EMA usingnefffrom the
FD analysis.nFCC(required for the calculation of the Wiener bounds inEqs. 5and6)
was calculated using AB-EMA and is given inTable 2.
a
b
Figure 4.Comparison of the results from TB-EMA and AB-EMA. (a) The predicted porosity,fFD, usingneffdetermined by the FD analysis and (b) the intrinsic refractive
indices,nFCC;FD, calculated for each tablet separately are plotted as a function of the
[image:6.594.43.293.651.708.2]deviation from the actual porosity is only 15%, and thus, the X
m
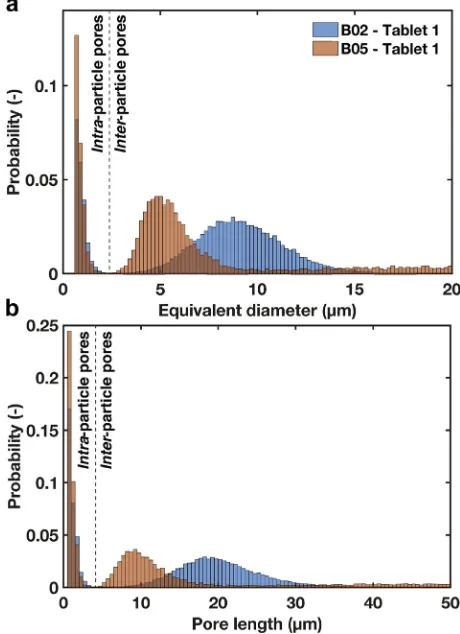
CT measurement was able to capture a surprisingly large number of intraparticle pores. Moreover, the relative porosity difference be-tween the 2 batches is in a very good agreement with the actual porosity difference of 15%.The frequency distributions of the equivalent diameter and the pore length clearly show a bimodal pore size distribution caused by the intra- and interparticle pores (Fig. 6). Thefirst mode of the pore size distributions is related to the intraparticle pores and is very similar between the different batches. The second mode corre-sponds to the interparticle pores, which was affected by the powder compaction. Although the second mode of both distributions is larger for the tablet with a lower porosity (B02), the higher porosity batch (B05) has a high number of very large and long interparticle pores. This analysis, thus, indicates that lower compaction pressure retains a combination of small interparticle pores and very large and long interparticle pores, both of which provide the greater overall porosity.
Because the size of the intra- and small interparticle pores is below or very close to the resolution limit of the used X
m
CT system, the level of confidence of pore-specific parameters for these pores is low. Therefore, we only considered interparticle pores (equiva-lent diameter>2.5m
m) in the following analysis of the anisotropy and orientation of the pores.The X
m
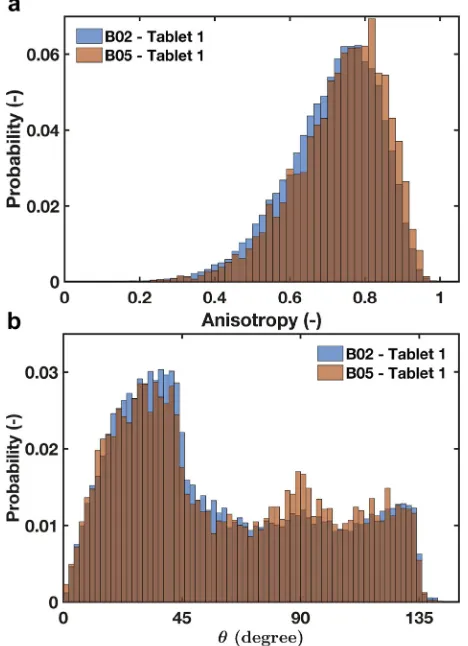
CT data can also be analyzed to reveal the orientation and shape of the interparticle pores. The principal orientation is given by the eigenvector with the largest eigenvalue, and the ratios be-tween the eigenvalues provide a shape descriptor of the pore. This analysis further confirms the nonspherical shape of the pores as reflected in the anisotropy (Table 3, Fig. 7, and Fig. 8a). The anisotropy value ranges from 0 (fully isotropic) to 1 (fully aniso-tropic), and the average value slightly increases for increasing porosity. Analyzing the orientation of the principal direction of a pore (Fig. 8b) reveals that a second mode is forming at 90, which indicates the main axis is perpendicular to the compaction direc-tion. This is in agreement with the results from the THz-TDS using AB-EMA which considers the anisotropy of the powder compact.Our results confirm previous reports that found that the tablet compaction process may cause anisotropy in the mechanical properties when measured in parallel (axial) or perpendicular (radial) to the compaction direction.26-29The compaction process is well known to result in a heterogeneous internal tablet structure due to confining the powder radially by a rigid die while com-pressing the tablet axially by the punch. Wu et al.29investigated the anisotropy in pore structure and the mechanical strength of cubic starch compacts. The results from this work already presented evidence that the pores were primarily oriented perpendicular to the direction of compression, which is in excellent agreement with our measurements on a different type of excipient using indepen-dent measurement techniques.
Pore Structure Analysis Using Mercury Porosimetry
Mercury porosimetry facilitates the determination of the pore size distribution of a pharmaceutical tablet (Fig. 9). Cumulative
pore intrusion volumes for the different tablets are presented in the Supporting Information. The results clearly reveal a bimodal pore size distribution as already discussed on the basis of the X
m
CT data. Although the results are qualitatively in good agreement, the pore sizes from mercury porosimetry are significantly smaller than those from Xm
CT. On the one hand, this discrepancy is due to the limited resolution and the applied procedure to separate pores in Xm
CT. The separation of pores depends on the selection of thresholds by the operator and on the actual distance between small pores. The in-fluence of the operator was minimized by iteratively optimizing the thresholds with respect to reducing the sensitivity of the thresholds on the porosity and number of pores. A stronger effect, thus, might be due to pores that are arranged closer to each other than the resolution limit of Xm
CT (<0.5m
m). Therefore, a cluster offine pores may be seen as one large pore in Xm
CT, whereas mercury poros-imetry may register every single pore separately. This will result in an overestimation of the larger pores by Xm
CT. [image:7.594.35.557.85.138.2]On the other hand, in mercury porosimetry, a pore-shielding effect may cause an overestimation of fine pores. The need to Table 3
Pore Structure Characteristics From XmCT Measurements
Variable Porosity, % Equivalent Diameter,mm Pore Volume, 107mm3 Pore Length,mm Anisotropy
B02 - tablet 1 35.7 6.5±4.3 3.2±3.7 14.1±10.0 0.71±0.12
B02 - tablet 2 35.8 6.5±4.3 3.2±3.7 14.1±10.0 0.71±0.12
B05 - tablet 1 51.5 7.7±9.0 17.5±43.5 16.4±20.5 0.73±0.12
B05 - tablet 2 51.3 7.7±9.0 17.9±43.8 16.4±20.7 0.73±0.12
All parameters are given as the average values±SD of all pores. The pore length is the maximum feret length measured in 3D. The anisotropy is calculated for each pore by 1lmin=lmaxwithlminandlmaxas the minimum and maximum eigenvalue, respectively. More details about the eigenvalues and eigenvectors are provided inFigure 7.
[image:7.594.310.540.393.710.2]force the nonwetting mercury to break through fine connecting features (throats) between larger pores causes an underestimation of the pore volume associated with the large pores and at the same
time an overestimation of the intrusion volume of the small pores.30Although this effect leads to an overestimate of thefine pore sizes, it does not affect the overall porosity.
The mercury porosimetry reveals that the very fine pores remain unchanged as a result of compaction, that is, the specific pore volumes of all batches for pores with a diameter<0.014
m
m strongly overlap. This supports our earlier assumption that the intraparticle porosity is not affected by the compaction. Moreover, the compaction of the powder under high pressure also leads to extremely close contact between particles and outer structural elements on the surface of the particles, so it is inevitable that such close contact might lead to pores on a length scale of the intra-particle pores. Consequently, the separable bimodality between inter- and intraparticle pores becomes more questionable under extremely high pressure compaction. [image:8.594.57.283.66.255.2]The porosities from mercury porosimetry were compared with the porosity calculated from the density and to that from THz-TDS (Table 4). The porosities from mercury porosimetry are based on the measurement of the bulk density and the true density (skeletal density). The true density was determined for every measurement yielding an averaged value of 2.744 ± 0.126 g cm3 (5 repeats), which was used for the porosity calculations. This true density is slightly lower than that from helium pycnometery (2.958±0.062 g cm-3), which was used to calculate the nominal porosities. Replacing the true density inEquation 1by the value from mercury porosimetry and using the updated nominal porosities to calibrate the different models (TB-EMA, AB-EMA, and ZPA) for THz-TDS, yields marginally better correlation results for every model than presented in Table 2 (the results are given in the Supporting Information). This suggests that helium pycnometry Figure 7.Schematic of a single nonspherical pore described by the eigenvectors. The 3
eigenvectors (only 2 are visualized) are mutually orthogonal to each other and ordered according to its eigenvalue, where the largest eigenvalue corresponds to eigenvector 1 and the smallest to eigenvector 3. The polar angle,q, and the azimuthal angle,F, were calculated for eigenvector 1 and further used to analyze the orientation of the pores. The minimum and maximum eigenvalue, that is, eigenvalue 3 (lmin) and 1 (lmax) were
[image:8.594.324.554.71.230.2]required to calculate the anisotropy as given inTable 3.
Figure 8.Analysis of the anisotropy and orientation of the interparticle pores. Fre-quency distributions of (a) the anisotropy and (b) the polar angleQ(calculated from eigenvector 1) for all pores. More details are provided inFigure 7.
10-2 10-1 100
Diameter (µm)
00.2 0.4 0.6 0.8
Pore volume, dV/d(logd) (cm
3
g
-1)
[image:8.594.52.286.386.709.2]B01 B02 B03 B04 B05
Figure 9.Specific pore volume as a function of pore diameter from mercury poros-imetry. One tablet per batch was measured.
Table 4
Comparison of Porosities of the Same Tablets From Mercury Porosimetry, Density Calculations, and THz-TDS (UsingneffFrom the FD Analysis and the Anisotropic
Bruggeman Model)
Batch Mercury Porosimetry Porosity via Density Calculations THz-TDS
fnominal fABEMA;FD
B01 0.37 0.45 0.44
B02 0.46 0.50 0.50
B03 0.52 0.56 0.56
B04 0.57 0.61 0.60
B05 0.66 0.69 0.68
The density calculations were performed as given inEquation 1and using the true density from Helium pycnometry (9true ¼2:958 g cm3). The porosities from
[image:8.594.312.562.643.716.2]overestimates the true density and the estimation from mercury porosimetry may be closer to the real value. An overestimation of the helium pycnometry may be caused by the presence of water molecules in the pore space, which could not be removed before the measurement. The release of the water during the measure-ment affects the calculation of the skeletal volume, which assumes a constant number of gas molecules, and thus causes an over-estimation of the true density.31
Roughness Analysis
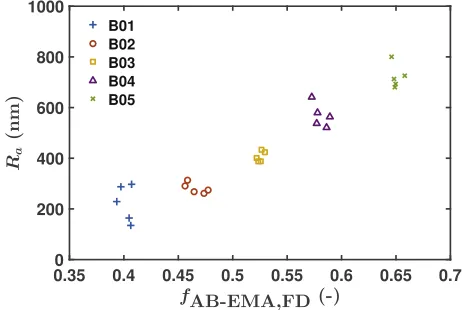
The roughness was measured for 5 tablets per batch (in total 25 samples).Figure 10reveals that it linearly depends on the porosity of the tablets, which is in line with previously published studies about MCC tablets.17This linear dependence between roughness and porosity is, thus, also valid for such highly porous powder compacts. However, the SD of the measured roughness of B01 is slightly larger than for the other batches, which is not the case for all the other parameters analyzed in this study. Some of the tablets of B01 are even above the averageRaof B02. This may be due to the low interparticle porosity of B01 and B02 leading to the hypothesis that the surface roughness strongly correlates with the interparticle porosity, and it is less affected by the intraparticle porosity.
The linear correlation ofRa andneff with the porosity provides the scientific basis for future research to analyze the pore structure of a tablet using terahertz technology in a reflection setting. This would be particularly important for cases of strongly absorbing and/or very thick tablets, which cause a low signal-to-noise ratio of the transmitted terahertz pulse leading to an inaccurate effective refractive index. Moreover, determining pore structural properties from reflection measurements may be more practical in an indus-trial setting as it facilitates an easy process integration.
Conclusion
This work demonstrated the characterization of the pore structure of highly porous FCC tablets by means of THz-TDS and X
m
CT. Xm
CT provides highly detailed data about the microstructure of pharmaceutical tablets facilitating the analysis of orientation and shape of every single pore. However, the long acquisition times (several hours) and safety concerns limit the application of this technology for quality control purposes. These limitations can be overcome by terahertz technology, which is a fast, nonionizing, contactless, and nondestructive method. The high potential of this technology to analyze the pore structure was emphasized by anR2>0.99 from the correlation between the porosity predicted from terahertz measurements and the nominal porosity.
Additional information about the pore structure can be extrac-ted on the basis of theSparameter and the depolarization factor. We showed for thefirst time how this depolarization factor can be used to analyze the shape of pores from terahertz measurement. The results, thus, indicate an anisotropic behavior of the FCC sam-ples which may have impact on critical quality attributes of the solid dosage form. In particular, the high aspect ratio of 1.7 of pores as determined by THz-TDS may have impact on the disintegration of the powder compact by affecting the wicking mechanisms. However, more research is necessary to gain insight into the impact these highly porous tablets with an anisotropic interparticle pore structure have on the disintegration and dissolution performance. The potential of the terahertz technique to study the dissolution and disintegration performance of immediate release tablets was recently demonstrated by Markl et al.32The authors reported a high correlation between the effective refractive index calculated from terahertz measurements and the disintegration time and the API dissolved during the early stage of tablet dissolution. Such a tech-nique is particularly important for tablets containing an API from BCS class II or IV (low solubility), where the dissolution rate can be significantly enhanced by accelerating the liquid penetration using highly porous excipients. However, using models such as TB-EMA or AB-EMA to analyze terahertz data of complex formulations re-quires a further development of these concepts.
Acknowledgments
The authors would like to thank Omya International AG for providing the FCC powder and sharing their valuable experience and advice. Drs Markl and Zeitler would like to acknowledge the U.K. Engineering and Physical Sciences Research Council for funding (EP/L019922/1). Additional data related to this publication are available at the Cambridge University repository (https://doi. org/10.17863/CAM.8476). Supporting information is provided electronically with this article online.
References
1. Desai PM, Liew CV, Heng PWS. Review of disintegrants and the disintegration phenomena.J Pharm Sci. 2016;105(9):1-11.
2. Quodbach J, Kleinebudde P. A critical review on tablet disintegration.Pharm Dev Technol. 2016;21(6):763-774.
3. Lerk CF, Bolhuis GK, de Boer AH. Effect of microcrystalline cellulose on liquid penetration in and disintegration of directly compressed tablets.J Pharm Sci. 1979;68(2):205-211.
4. Yassin S, Goodwin DJ, Anderson A, et al. The disintegration process in micro-crystalline cellulose based tablets, Part 1: influence of temperature, porosity and superdisintegrants.J Pharm Sci. 2015;104(10):3440-3450.
5. Westermarck S, Juppo AM, Kervinen L, Yliruusi J. Microcrystalline cellulose and its microstructure in pharmaceutical processing. Eur J Pharm Biopharm. 1999;48(3):199-206.
6. Bi Y, Sunada H, Yonezawa Y, Danjo K, Otsuka A, Iida K. Preparation and eval-uation of a compressed tablet rapidly disintegrating in the oral cavity.Chem Pharm Bull. 1996;44(11):2121-2127.
7. Sungthongjeen S, Puttipipatkhachorn S, Paeratakul O, Dashevsky A, Bodmeier R. Development of pulsatile release tablets with swelling and rup-turable layers.J Control Release. 2004;95(2):147-159.
8. Stirnimann T, Atria S, Schoelkopf J, et al. Compaction of functionalized calcium carbonate, a porous and crystalline microparticulate material with a lamellar surface.Int J Pharm. 2014;466(1-2):266-275.
9. Stirnimann T, Di Maiuta N, Gerard DE, Alles R, Huwyler J, Puchkov M. Func-tionalized calcium carbonate as a novel pharmaceutical excipient for the preparation of orally dispersible Tablets.Pharm Res. 2013;30(7):1915-1925. 10. Garnett JCM. Colours in metal glasses and in metallicfilms.Philos Trans R Soc A
Math Phys Eng Sci. 1904;203(359-371):385-420.
11. Bruggeman DAG. Berechnung verschiedener physikalischer Konstanten von heterogenen Substanzen.Annalen der Physik. 1935;5(24):636-664.
[image:9.594.41.272.67.222.2]12. Bawuah P, Silfsten P, Ervasti T, Ketolainen J, Zeitler JA, Peiponen KE. Non-contact weight measurement of flat-faced pharmaceutical tablets using terahertz transmission pulse delay measurements.Int J Pharm. 2014;476(1-2):16-22. Figure 10.Roughness analysis of 5 tablets per batch as a function of the porosity. The
13.Polder D, Van Santeen JH. The effective permeability of mixtures of solids.
Physica. 1946;12(5):257-271.
14.Bawuah P, Chakraborty M, Ervasti T, et al. A structure parameter for porous pharmaceutical tablets obtained with the aid of Wiener bounds for effective permittivity and terahertz time-delay measurement.Int J Pharm. 2016;506(1-2):87-92.
15.Bawuah P, Tan N, Tweneboah SNA, et al. Terahertz study on porosity and mass fraction of active pharmaceutical ingredient of pharmaceutical tablets.Eur J Pharm Biopharm. 2016;105(C):122-133.
16.Spanier JE, Herman IP. Use of hybrid phenomenological and statistical effective-medium theories of dielectric functions to model the infrared reflectance of porous sicfilms.Phys Rev B. 2000;61(15):10437-10450. 17.Bawuah P, Mendia AP, Silfsten P, et al. Detection of porosity of pharmaceutical
compacts by terahertz radiation transmission and light reflection measure-ment techniques.Int J Pharm. 2014;465(1-2):70-76.
18. Markl D, Zeitler JA, Rasch C, et al. Analysis of 3D prints by x-ray computed microtomography and terahertz pulsed imaging.Pharm Res. 2017 [Epub ahead of print].http://dx.doi.org/10.1007/s11095-016-2083-1.
19.Seitavuopio P, Rantanen J, Yliruusi J. Tablet surface characterisation by various imaging techniques.Int J Pharm. 2003;254(2):281-286.
20.Seitavuopio P, Rantanen J, Yliruusi J. Use of roughness maps in visualisation of surfaces.Eur J Pharm Biopharm. 2005;59(2):351-358.
21.Seitavuopio P, Hein€am€aki J, Rantanen J, Yliruusi J. Monitoring tablet surface roughness during thefilm coating process.AAPS Pharm Sci Tech. 2006;7(2):E1-E6.
22.Jones SB, Friedman SP. Particle shape effects on the effective permittivity of anisotropic or isotropic media consisting of aligned or randomly oriented ellipsoidal particles.Water Resour Res. 2000;36(10):2821-2833.
23. Peiponen KE, Vartiainen EM, Unuma T, et al. Dispersion relations for evaluating the complex refractive index of medium without the information of its thickness.Appl Phys Lett. 2013;102(18):181110.
24. Hale DK. The physical properties of composite materials.J Mater Sci. 1976;11: 2105-2141.
25. Tuononen H, Fukunaga K, Kuosmanen M, Ketolainen J, Peiponen KE. Wiener bounds for complex permittivity in terahertz spectroscopy: case study of two-phase pharmaceutical tablets.Appl Spectrosc. 2010;64(1):127-131.
26. Akseli I, Hancock BC, Cetinkaya C. Non-destructive determination of aniso-tropic mechanical properties of pharmaceutical solid dosage forms.Int J Pharm. 2009;377(1-2):35-44.
27. Edge S, Steele DF, Tobyn MJ, Staniforth JN, Chen A. Directional bonding in com-pacted microcrystalline cellulose.Drug Dev Ind Pharm. 2001;27(7):613-621. 28. Mullarney MP, Hancock BC. Mechanical property anisotropy of pharmaceutical
excipient compacts.Int J Pharm. 2006;314(1):9-14.
29. Wu YS, van Vliet LJ, Frijlink HW, Stokroos I, van der Voort Maarschalk K. Pore direction in relation to anisotropy of mechanical strength in a cubic starch compact.AAPS Pharm Sci Tech. 2008;9(2):528-535.
30. Gane PAC, Ridgway CJ, Lehtinen E, et al. Comparison of NMR cryoporometry, mercury intrusion porosimetry, and DSC thermoporosimetry in characterizing pore size distributions of compressedfinely ground calcium carbonate struc-tures.Ind Eng Chem Res. 2004;43(24):7920-7927.
31. Sun CC. A Novel method for deriving true density of pharmaceutical solids including hydrates and water-containing powders.J Pharm Sci. 2004;93(3):646-653. 32. Markl D, Sauerwein J, Goodwin DJ, van den Ban S, Zeitler JA. Non-destructive