2016-01-0072
Analysis tool for initial high level assessment of candidate MEA architectures
Rory Telford, Catherine Jones, Patrick Norman and Graeme Burt
University of Strathclyde, Glasgow, UK
This is a pre-print of SAE technical paper 2016-01-2015 DOI:10.4271/2016-01-2015
Abstract
Mass and efficiency are key performance indicators for the development and design of future electric power systems (EPS) for more-electric aircraft (MEA). However, to enable consideration of high-level EPS architecture design trades, there is a requirement for modelling and simulation based analysis to support this activity. The predominant focus to date has been towards the more detailed aspects of analysis, however there is also a significant requirement to be able to perform rapid high-level trades of candidate architectures and technologies.
Such a capability facilitates a better appreciation of the conflicting desires to maximize availability and efficiency in candidate MEA architectures, whilst minimizing the overall system mass. It also provides a highly valuable and quantitative assessment of the systemic impact of new enabling technologies being considered for MEA applications. Without this capability, predesign assessments are often time consuming and of a qualitative manner.
Accordingly, this paper will present a steady state pre-design analysis tool for MEA architectures, which enables analysis of the architecture performance at different stages of the flight profile. By providing drag and drop models of key MEA electrical power system components configured for common voltage and power levels, the tool facilitates the rapid construction of candidate architectures which then enables the subsequent quantitative assessment of overall system mass and efficiency. Key to the credibility and usefulness of this tool, is the appropriate marrying of validated fundamental mathematical models (for example in the evaluation of system losses), up-to-date data driven models (for example, relating to component masses or power densities) and the flexibility to incorporate new models of technologies under consideration. The paper will describe these core elements and present selected case studies demonstrating potential uses of the tool in architecture assessment and down-selection, technology impact, and design-point sensitivity analysis.
1.
Introduction
Realizing the MEA concept [1] has resulted in EPS with increased generation capacity, power demand, and a higher overall number of interdependent components and sub-systems. These system advances have placed significant design criticality on the EPS in terms of optimizing the efficiency, and reducing the total mass, of the secondary power system. Future MEA EPS design proposals will become
increasingly novel to cater for both the increasing voltage distribution levels and the shift to variable frequency (VF) generation. It would, therefore, be beneficial for system designers to have the means of rapidly assessing candidate architectures in terms of mass and efficiency so as to address at a first stage these design criticalities. This paper proposes the development of an analysis tool that enables such high-level design analyses. The basis of the analysis tool is a library of component models covering the main EPS sub-systems - these component models can be combined to form user-defined architectures, which can be quantitatively assessed with regards to both mass and efficiency throughout various operating modes, or flight cycles, of the aircraft.
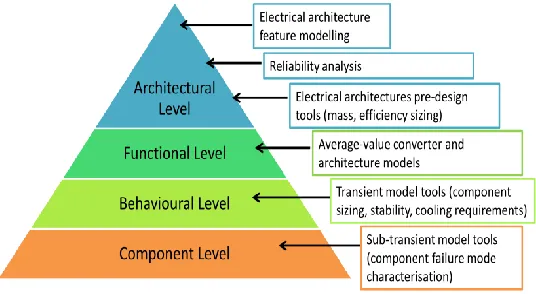
Fig. 1 summarizes different modelling fidelity levels and their use toward EPS design and analysis [2]. To date, modelling and simulation has predominantly been used for detailed aspects of system analysis, whereby high-fidelity behavioral level models are used to analyze low-level system effects, such as switching behavior and thermal stressing. However, the analysis tool proposed within this paper resides within the architectural level, and uses a combination of fundamental mathematical models, and up-to-date data driven models, to facilitate rapid, high-level, system appraisal. The tool also has the capability of assessing system wide impact of emerging technologies.
[image:1.612.306.574.554.701.2]The paper is laid out as follows. Section 2 outlines an example MEA architecture and introduces the various sub-systems and components. Efficiency and mass component models on which the analysis tool are based are presented in Section 3. A case study, highlighting application
of the tool and its attributes is provided in Section 4 and conclusions are discussed in Section 5.
2.
MEA Example Architecture
An example MEA EPS architecture is illustrated in Fig. 2 [3, 4]. Within this architecture, the main engine driven generators output 230Vac for distribution to large rated loads (ice protection, galleys and fuel pumps) and to power electronic (PE) converters, which further condition the voltage to ±270Vdc, 115Vac and 28Vdc. These conditioned voltage levels are used for secondary distribution to respective load centers: ±270Vdc distributes power to large motor loads, such as environmental control systems compressors and fans; 115Vac distributes to equipment cooling and galley fans; and 28Vdc distributes to flight deck displays and fuel pumps. Furthermore, 115Vac and 28Vdc distribute to modular remote power distribution units (RPDU) located throughout the aircraft. These units power lower rated and avionic loads.
Conventional aircraft EPS voltage distribution levels were generally limited to 115Vac and 28Vdc; the inclusion of 230Vac and ±270Vdc levels indicates the increased capacity and demand placed on MEA EPS. To place this in context, the B787 MEA has a total generation capacity of 1.45MW [5] (4×250kVA main generators and 2×225kVA APU generators), whereas the B777 total capacity is 360kVA [6] (3×120kVA main generators): roughly a fourfold capacity increase. The tool proposed in this paper aims to analyze how MEA EPS design solutions impact both mass and efficiency. Aircraft EPS sub-systems are generally classified as follows:
Electrical Machines. Power Electronics. Protection and Switching. Energy Storage.
[image:2.612.47.293.373.688.2] Cables and Wiring.
Figure 2: Example MEA EPS architecture – derived from [4].
Accordingly, development of the tool follows this general classification to form relevant sub-libraries of component models which can be combined to form user defined architectures. The following sections discuss each sub-library and their constituent mass and efficiency component models.
3.
Tool Development – Component
Libraries
The models described in this section form the first version of the tool and have been designed to comprise current/near future MEA technologies. The modular design of the tool sub-libraries allows future versions to readily include models of emerging components and technologies. An associated caveat that must be emphasized at this point is that, with the tool residing at this early stage of development, the models described in this section have yet to be fully validated.
3.1 Power Electronics
There is a critical requirement for power conversion within the EPS; this requirement has progressed within MEA, where higher voltage distribution levels and variable frequency output from the main generators have increased the number of conversion stages [7]. The role of PE within MEA is to:
Convert higher voltage distribution levels to conventional levels for supply to legacy loads.
Convert generated ac voltage to ±270Vdc and 28Vdc. Control frequency and voltage supply to accessory ac
electrical motor loads using dc/ac inverters.
Convert power to/from battery and energy storage systems. Various mass and efficiency models of components that perform these functions are included within the PE sub-library. These component models are described in the following.
3.1.1 Auto-Transformer Rectifier Unit
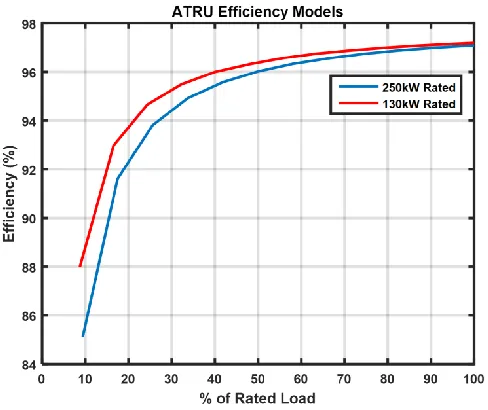
The multi-pulse auto-transformer rectifier unit (ATRU) [8] functions to convert 3-phase 230/400Vac to ±270Vdc. The ATRU is composed of N 6-pulse diode bridges, each of which is fed from a multi-phase shifting auto-transformer unit (ATU). Development of the efficiency model for the ATRU involves derivation of diode bridge, ATU and dc side filter losses under various loading scenarios. Diode bridge losses are dominated by conduction losses, as the low switching frequency means reverse-recovery losses are negligible; diode conduction losses are calculated using diode forward voltage drop and resistance (available in manufacturer datasheets) and calculated RMS current. ATU efficiency is determined using a data model which is dependent on percentage loading and device rating. DC filter loss calculation is determined using the equivalent series resistance (ESR) of the capacitor and the 𝐼2𝑅 losses of the inductor. Sizing of the filter components, which is dependent on voltage, current and frequency ripple, enable these parameters to be determined. Fig. 3 illustrates derived efficiency models for 18-pulse 250kW and 130kW rated ATRUs. Each device has a peak efficiency of approximately 97%, which is similar to peak ATRU efficiencies quoted in [9].
the heat sink. Filter components are sized according to power quality requirements of 5.9% maximum voltage ripple and 2.8% maximum current ripple [30]. ATU mass is determined using a power density ratio of 6.39 kVA/kg [29] and filter and diode component masses are determined from manufacturer datasheets. It is assumed [10] that the ATRU is liquid cooled and mass of the cooling plate and pipes is derived using the method outlined in [11]. The total mass of the 250kW and 130kW rated devices are provided in Table 1. Mass and efficiency sensitivity parameters for the ATRU component model are summarized in Table 2.
Figure 3: ATRU efficiency models.
3.1.2 Transformer Rectifier Unit
The transformer rectifier unit (TRU) functions to convert 3-phase ac generated power to 28Vdc and interface various loads including: adjustable speed ac motor drives; uninterruptible power supply (UPS) systems; and variable-speed constant frequency systems. N 6-pulse Diode bridges convert the available ac voltage into a direct voltage, where the direct output voltage required can be obtained by varying the turns ratio of the transformer. Similar to the ATRU, described in
Section (3.1.1), derivation of the TRU efficiency model follows a similar methodology of determining diode-bridge, transformer, and DC side filter losses. Fig.4 illustrates the derived efficiency models for
12-pulse 6.7 and 3.3kW rated TRUs. The 6.7kW device has a peak efficiency of ≈ 89% and the 3.3kW device peaks at roughly 80% efficiency. References [12] and [13] validate the accuracy of these peak efficiency values.
The mass model of the TRU is derived through the accumulative mass of the transformer, diodes, dc side filter components and heatsink. Diode and filter component masses are determined through manufacturer datasheets, while transformer mass is determined using a power density value of 1.08 kVA/kg [9]. TRU cooling is either forced or passive air cooled, although passive cooling is reserved for lower rated devices. The mass of the heatsink is determined through calculation of diode bridge losses and with the assumption that junction temperature should not exceed 125° within a maximum ambient temperature of 30°. Total mass of the 6.7kW and 3.3kW rated TRUs are provided in Table 1.
Mass and efficiency sensitivity parameters for the TRU component model are summarized in Table 2.
3.1.3 Active Converters
The increasing requirement for power conversion within MEA has given significant impetus for the deployment of active power converter technologies [14]. Active converters use gate driven semiconductor devices, as opposed to passive diode devices, to achieve voltage commutation. This enhanced controllability eliminates the need for front-end transformers/autotransformers, and thus has the potential to vastly improve device power density. The increased switching frequency will also further improve power density through reduction in the size of passive filter devices.
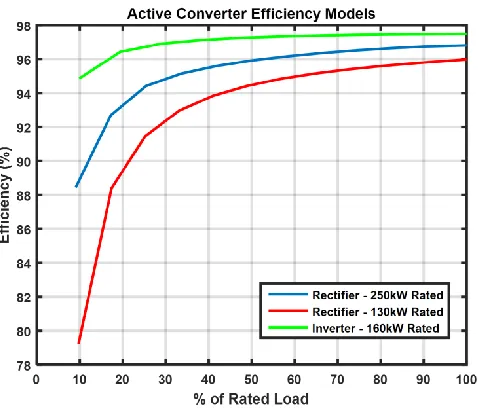
The basic active converter topology is the two-level [15],where six semiconductor devices (typically IGBTs for medium frequency applications) are configured in a similar manner to the passive diode bridges of the ATRU and TRU. Determining the switching and conduction losses of the active two-level converter is not as simplistic as the passive case as losses in both the active device and its associated anti-parallel diode must be considered. Consequently, derivation of bridge losses as part of the active converter component efficiency model follows the methodology described in [15]. DC filter losses also form part of the efficiency model. Filter components are sized in correspondence with switching frequency, and associated 𝐼2𝑅 losses of the inductor and equivalent series resistance (ESR) losses of the capacitor are then determined. Efficiency models for both rectification and inversion modes of operation of the active converter are illustrated in Fig.5. The efficiency of the active converter model operating in rectification mode (where power flows from 230Vac side to the ±270Vdc side) peaks at roughly 95-97%. For the inverting mode of operation (where power flows from the ±270Vdc side to the 230Vac side), maximum efficiency increases to roughly 97.5%.
Again, the mass model is derived through a combination of the 6-pulse bridge components, dc side filter components and the heatsink. Liquid cooling is assumed, and sizing of the associated cooling plates and pipes follows the methodology outlined in [6]. Masses of various ratings of active converters are provided in Table 1. Note the increased power density that can be achieved through elimination of the transformer.
Mass and efficiency sensitivity parameters for the active converter model are summarized in Table 2.
[image:3.612.48.283.489.682.2]Figure 5: Active converter efficiency models.
3.1.4 Dual Active Bridge Converters
It is anticipated that placing greater emphasis on dc distribution within MEA EPS will capitalize on efficiency, flexibility and power density benefits [16]. This shift in emphasis will result in the requirement for high power density dc-dc converters for a variety of applications. The dual active bridge (DAB) topology for dc-dc conversion is a strong candidate for aerospace applications as it provides high performance and efficiency, bidirectional power flow, and galvanic isolation. The topology [17] consists of two full-bridge circuits connected through an isolation transformer, where power flow is controlled through phase shifting square waves at the transformer terminals.
[image:4.612.48.280.489.681.2]The efficiency model of the DAB is derived through calculation of transistor losses within each full bridge, isolation transformer losses, and passive losses. Bridge losses are determined using a combination of RMS current derivations provided in [17] and transistor/anti-parallel diode on-state resistances and switching energies which are obtained from relevant manufacturer datasheets.
Figure 6: DAB efficiency models
Similarly, isolation transformer losses are determined with RMS current derivations and winding resistances, and passive filter components through output current ripple and ESR values. Efficiency models for 5kW and 2.5kW rated DABs are illustrated in Fig. 6. Sizing the high-frequency isolation transformer was a significant challenge throughout development of the DAB mass model. The method described in [18] is used for sizing the core and winding weights. Necessary core dimensions required for sizing are interpolated using available HF transformer data [19]. Mass of the full bridges and filter capacitor follows a similar methodology described in previous sections. Cooling for the DAB can be achieved using either forced or passive air, and heatsinks are sized in a similar manner to the TRUs (Section (3.1.2)). Total Mass of the 5kW and 2.5kW rated DABs are provided in Table 1.
Mass and efficiency sensitivity parameters for the DAB component model are summarized in Table 2.
3.1.5 DC/DC Converters
There are a range of DC/DC converters available to designers of aerospace EPS [20] that, in comparison to the DAB, condition DC voltage at lower power levels. Component models of these alternative low-power modules are included within the analysis tool. Relevant data is readily available in manufacturing datasheets and is used for developing mass and efficiency models. Guidelines on typical design set-up, including sizing of passive filter components and module paralleling for increased power ratings are also provided in the extensive manufacturer’s documentation [21]. Fig. 7 illustrates efficiency models developed for 0.5kW and 0.3kW rated DC/DC converters and Table 1 provides the associated mass for these device ratings.
Mass and efficiency sensitivity parameters for the DC/DC component model are summarized in Table 2.
[image:4.612.328.566.497.695.2]Table 1: Quantitative mass derived for various power electronic device models and associated power densities.
PE Device Rating (kW) Mass (kg) (lbs) Density Power (kW/kg)
ATRU 250 100.2 (220.9) 2.49
ATRU 130 67.33 (148.4) 1.93
TRU (Forced
cooling) 6.7 13.61 (30) 0.49
TRU (Forced
cooling) 3.3 9.407 (20.7) 0.35
Active Rectifier 250 28.7 (63.27) 8.71
Active Rectifier 130 28.53 (62.90) 4.55
DAB 5 5.60 (12.35) 0.89
DAB 2.5 1.71 (3.77) 1.46
DC/DC 0.5 0.289 (0.637) 1.73
DC/DC 0.32 0.222 (0.485) 1.44
ATU >10 - 6.39
ATU <10 - 1.08
Table 2: Mass and efficiency sensitivity parameter for PE component models
PE Device Mass & Efficiency Sensitivity Parameters
ATRU Power rating, No. of diode pulses, AC frequency
TRU Power rating, No. of diode pulses, AC frequency, type of cooling
Active Converter
Power rating, operating mode, switching frequency, modulation index, power factor
DAB
Power rating, operating mode, low voltage side magnitude, switching frequency, type of cooling
DC/DC Power rating/module, No. of parallel modules used to increase power rating
3.2 Protection and Switching
Control of the EPS throughout normal periods of operation is necessary for ensuring that power demand for each sub-system and load is met. Similarly, control of the network through periods of fault conditions is vital for ensuring the safe and reliable operation of the network. Contactors and circuit breakers (CB) are utilized to perform these control functions within MEA and are an integral element of system design. Contactors are a class of electrical relay designed to switch high currents and voltage and are used to control different power sources and delivery of power to loads. Contactors have high switching cycles and are used multiple times throughout a single flight. Conversely, CBs are used solely for the interruption of high (fault) currents, and are primarily used for circuit protection. As such, CBs have significantly less switching cycles than contactors. Development of remote control circuit breaker (RCCB) [28] technology is beneficial for the design of distributed EPS architectures, such as those illustrated in Fig. 2, and is expected to be increasingly adopted within future systems.
[image:5.612.326.591.385.689.2]Mass and efficiency models for these devices are developed using relevant data available in manufacturer datasheets. Device 𝐼2𝑅 losses are a consequence of on-state whereas mass is a function of current and voltage ratings. Table 3 outlines data for selected devices provided within the tool. The mass of these devices constitutes only main switching and relaying components – interconnecting and ancillary elements (such as cabinets and sensors) are not currently included in the models.
Table 3: Selected protection and switching♣ device data. Device Voltage Rating
Current Rating
(A)
Mass (kg) (lbs)
Power Density (kW/kg)
On-state Resistance
(mΩ)
Contactor 270Vdc 100 0.35 (0.77) 77 0.75
Contactor 28Vdc 400 1.18 (2.60) 9.48 0.25
Contactor 230Vac 150 5 (11.02) 6.8 1
Contactor 115Vac 150 2.5 (5.51) 6.9 1
CB 270Vdc 630 3.23 (7.12) 52.6 0.001
CB 28Vdc 200 0.13 (0.29) 43 0.8
CB 115Vac 200 0.38 (0.86) 59.2 1.5
CB 230Vac 200 0.78 (1.71) 59.2 1.5
3.3 Electrical Machines
Electrical machines provide the means of electrical to mechanical power transformation (and vice versa) that is required for both electrical generation and to service various loads throughout the aircraft. The increasing generation capacity, accompanied by the replacement of hydraulic flight control actuators with electromechanical actuators, will result in electrical machines significantly impacting global MEA EPS mass and efficiency. As with all aircraft EPS components, electrical machines with maximum power density, efficiency, and reliability are desirable. Several types of machine topologies have been proposed due to their lightweight and robust nature, including: brushless dc, switched reluctance and permanent magnet synchronous (PMS). Advances in permanent magnet technology have resulted in the PMS topology becoming a popular candidate for application within MEA.
It is the purpose of this work to develop up-to-date and advanced mass and efficiency models for various candidate machine topologies. However, at this point, the electrical machine sub-library is limited to a basic power density and efficiency value for the PMS machine. These include a power density of 2kW/kg and efficiency of 85% [22]. Electrical machines are a particular area of the proposed analysis tool where development is at a preliminary stage.
3.4 Cables and Wiring
Electrical cables and wiring form the vital interconnections between components and facilitate the transfer of power throughout the EPS. Cables and wires are categorized with respect to current carrying capacity as well as the functions they fulfil; for example, power cables will be heavy with large diameters to deal with large current ratings, while lighter weight wires are used for databus connections and general electronic circuitry e.g. in-flight entertainment systems. The analysis tool presented in this paper focuses solely on larger power cables that transfer significant levels of power.
Both cable efficiency and mass are a function of physical length and current rating. This is summarized as follows:
Cables that are physically longer and carry larger ratings of current are intuitively heavier.
Physically longer cables are less efficient as higher electrical resistance increases heat dissipation losses.
Cables with higher current ratings are more efficient per unit length than cables with lower current ratings.
Efficiency and mass models for the power cables are based upon nominal weights [23] and maximum resistances per unit length [24] for various American Wire Gauge stranded conductor sizes. The developed data models, in concurrence with various user defined cable parameters, enable the mass and efficiency of each cable within a candidate EPS design to be calculated. Required cable parameters include:
Maximum cable power rating.
Current magnitude at particular operational point. Physical length.
3.5 Energy Storage
Batteries and energy storage systems serve multiple functions within aircraft. Modern aircraft typically contain two primary battery systems – the main battery and the APU battery. Generally, the main battery provides:
Power throughout ground operation and prior to main engine start-up.
Backup power for critical systems in the event of power failure.
The APU battery is primarily used to start the APU that, in turn, can be used for main engine start-up. Advances in battery technology have been important for realizing power density objectives required within MEA EPS. Earlier commercial aircraft used nickel cadmium (NiCd) batteries, which offer poorer power density benefits. However, relatively recent advances in lithium-ion batteries have resulted in them being the prime candidate for replacing NiCd devices [25]. Mass and efficiency models for energy storage system sub-library focus on three forms of battery technology: NiCd, lithium-ion and lead acid. The mass models are based upon data obtained from relevant datasheets [26] and efficiency models use typical charge-discharge efficiency characteristics for each technology. The data used for these battery models is summarized in Table 4.
4.
Tool Application – Case Study
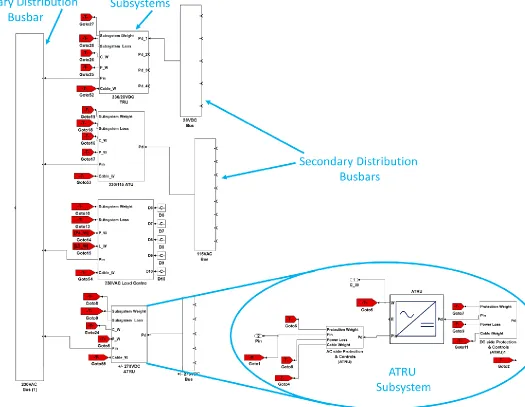
This section uses a case study to demonstrate application of the proposed analysis tool. The basis of the case study was to model the high-level design of the MEA EPS, outlined in Section 2, to enable mass and efficiency analysis of the representative architecture. Drag and drop models of the various components, described in Section 3, were used to model the complete EPS architecture. Note that, as the case study models a specific representative architecture, not all component models described in Section 3 are utilized. A subset of the complete model architecture developed as part of the case study is provided in Fig.8.This illustrates the drag and drop component models and how they are combined to form the different subsystems that constitute the high-level EPS design.
Table 4: Data used for development of battery models
Technology Capacity (Ah) Mass (kg) Efficiency (%)
NiCd 40 34.8 75
NiCd 53 43.5 75
Lithium-ion 10 3.92 92
Lithium-ion 65 22 92
Lead acid 10.5 12.88 80
Figure 8: Subset of the EPS model developed using proposed analysis tool
Editing parameters of each component model allows a unique design solution to be evaluated across various operating conditions. Accordingly, cable lengths, load ratings, converter ratings etc. were configured to values that may be typical within MEA.
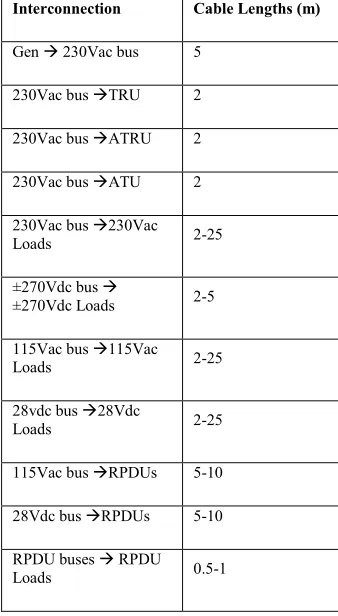
Mass distribution of the developed model architecture, as determined by the tool, is outlined in Fig.9. Length of the cable interconnections in the model are outlined in the appendix. Total EPS mass was determined to be approximately 2490kg – this calculated mass of the EPS model represents 2.1% of the B787s 118,000kg [27] unloaded, no fuel weight. Electrical machines are the largest contributor at 1221.8kg, while cables and converters contributed 677.2kg and 356.2kg respectively. Table 5 presents system efficiency results across two separate hypothetical model operating conditions. The first operating condition is with a total electrical loading of 206 kW. Table 5 summarizes how this load is split across each voltage distribution level. Within said operating condition, overall efficiency was determined to be 83.87%. The second operating condition involved a significantly higher total electrical loading of 1012 kW – this condition resulted in an overall system efficiency increase of 0.85% to 84.72%. At this stage it is difficult to assess the effect that advanced electrical
Figure 9: Mass distribution for representative MEA architecture model
Table 5: Calculated system efficiency for different model conditions where electrical system load is changed
Total Load (kW)
±270Vdc Load (kW)
230Vac Load (kW)
115Vac Load (kW)
28Vdc Load (kW)
RPDU Loads (kW)
Overall System Efficiency (%)
206 100 60 20 6 20 83.87
1012 600 240 120 24 80 84.72
In general this case study has given an insight to the capabilities of the proposed tool, whereby user defined architectures can be both readily developed and rapidly evaluated in terms of mass and efficiency. Having a tool with such capabilities will allow system designers to analyze how novel design solutions and technologies may impact global weight and efficiency.
5.
Summary/Conclusions
This paper presents an analysis tool that can quantitatively evaluate the mass and efficiency of candidate MEA EPS architectures. Mass and efficiency are key design parameters, and the paper emphasized the importance of high-level system modelling during this initial phase. Particular benefits of possessing this capability include rapid system appraisal, and analysis of the impact that novel design solutions and technologies may have across the system. The main portion of the paper was dedicated to describing the development of the mass and efficiency models that constitute the tool. Ideally component models would be developed using data provided by relevant manufacturers. Unfortunately, data that describes component behavior across a variety of operating conditions is not publically available. Thus, various EPS component models have been developd using a range of mathematical and data driven approaches. Components have then been grouped into relevant systems, and it is from these systems that tool sub-libraries are based. A particular contribution of this paper was the description and validation of the PE component mass and efficiency models. It is expected that future EPS are going to be ever reliant on PE for conversion functionality, and the authors feel that development of these models are significant. The paper also described other sub-libraries of components, including: electrical machines, protection and switching devices, cables and wiring and energy storage devices. Tool development is relatively advanced, although further work is required on the design, implementation and testing of various sub-libraries. A case study was used to demonstrate application and functionality of the proposed tool. Within the case study, the tool was used to develop a representative MEA architecture, which was then analyzed in terms of mass and efficiency. Analysis results were presented, with various capabilities of initial deployment of the tool highlighted and discussed.
6.
References
[1] B. Sarlioglu and C. T. Morris, ‘More Electric Aircraft: Review, Challenges, and Opportunities for Commercial
Transport Aircraft’, IEEE Trans. Transp. Electrification, vol. 1, no. 1, pp. 54–64, Jun. 2015.
[2] ‘AIR6326 (WIP) Aircraft Electrical Power Systems, Modeling and Simulation, Definitions - SAE International’. [Online]. Available: http://standards.sae.org/wip/air6326/. [Accessed: 10-May-2016].
[3] G. A. Whyatt and L. . Chick, ‘Electrical Generation for More-Electric Aircraft Using Solid Oxide Fuel Cells’. Pacific Northwest National Laboratory, 2012.
[4] ‘System and performance (Boeing)’, B787 technical site. [Online]. Available: http://about787.weebly.com/system-and-performance-boeing.html. [Accessed: 10-May-2016]. [5] ‘Future aircraft power systems - Integration Challenges’.
[Online]. Available:
https://www.ece.cmu.edu/~electriconf/2008/PDFs/Karimi.pdf. [Accessed: 10-May-2016]
[6] J. Burns and C. Tenning, ‘Electric power generating system for the Boeing 777 airplane’, SAE Technical Paper, 1991. [7] R. Bojoi, M. G. Neacsu, and A. Tenconi, ‘Analysis and survey
of multi-phase power electronic converter topologies for the more electric aircraft applications’, in 2012 International Symposium on Power Electronics, Electrical Drives, Automation and Motion (SPEEDAM), 2012, pp. 440–445. [8] T. Yang, S. Bozhko, and G. Asher, ‘Functional Modeling of
Symmetrical Multipulse Autotransformer Rectifier Units for Aerospace Applications’, IEEE Trans. Power Electron., vol. 30, no. 9, pp. 4704–4713, Sep. 2015.
[9] ‘Thales Avionics Electrical Systems Catalog’. [Online] Available:
https://www.thalesgroup.com/sites/default/files/asset/documen t/thales_avionics_electrical_systems_catalog.pdf. [Accessed: 03-May-2016].
[10] J. Valenzuela, T. Jasinski, and Z. Sheikh, ‘Liquid cooling for high-power electronics’, Power Electron. Technol., vol. 31, no. 2, pp. 50–56, 2005.
[11] A. Nawawi, C. F. Tong, Y. Liu, A. Sakanova, S. Yin, Y. Liu, K. Men, K. Y. See, K. J. Tseng, R. Simanjorang, C. J. Gajanayake, and A. K. Gupta, ‘Design of high power density converter for aircraft applications’, in 2015 International Conference on Electrical Systems for Aircraft, Railway, Ship Propulsion and Road Vehicles (ESARS), 2015, pp. 1–6. [12] ‘Transformer Rectifier Units - Crane Aerospace &
Electronics’. [Online]. Available:
[13] K. W. E. Cheng, ‘Comparative study of AC/DC converters for More Electric Aircraft’, in Power Electronics and Variable Speed Drives, 1998. Seventh International Conference on (Conf. Publ. No. 456), 1998, pp. 299–304.
[14] V. M. Nguyen, ‘Roles of Active Rectifiers in the Future Aircraft Power Systems’, SAE Technical Paper , 2008. [15] S. Dieckerhoff, S. Bernet, and D. Krug, ‘Power loss-oriented
evaluation of high voltage IGBTs and multilevel converters in transformerless traction applications’, IEEE Trans. Power Electron., vol. 20, no. 6, pp. 1328–1336, Nov. 2005. [16] S. D. A. Fletcher, P. J. Norman, S. J. Galloway, and G. M.
Burt, ‘Determination of protection system requirements for dc unmanned aerial vehicle electrical power networks for enhanced capability and survivability’, IET Electr. Syst. Transp., vol. 1, no. 4, pp. 137–147, Dec. 2011.
[17] R. T. Naayagi, A. J. Forsyth, and R. Shuttleworth, ‘High-Power Bidirectional DC #x2013;DC Converter for Aerospace Applications’, IEEE Trans. Power Electron., vol. 27, no. 11, pp. 4366–4379, Nov. 2012.
[18] K. D. Hoang and J. Wang, ‘Design optimization of high frequency transformer for dual active bridge DC-DC converter’, in 2012 XXth International Conference on Electrical Machines (ICEM), 2012, pp. 2311–2317. [19] ‘High frequency fly-back transformer’. [Online]. Available:
http://magnetic-components.mpsind.com/item/flyback-
transformers/p3800-series-isolated-flyback-transformers/p3800-5. [Accessed: 28-Apr-2016]. [20] ‘Mil Power DC-DC Converter | Military Standards | Vicor
Corporation’. [Online]. Available:
http://www.vicorpower.com/mil-cots-dc-dc. [Accessed: 28-Apr-2016].
[21] ‘MIL-COTS DCM DC-DC Converter Module | Vicor Corporation’. [Online]. Available:
http://www.vicorpower.com/mil-cots-dc-dc/mil-cots-dcm. [Accessed: 10-May-2016].
[22] P. H. Mellor, S. G. Burrow, T. Sawata, and M. Holme, ‘A wide-speed-range hybrid variable-reluctance/permanent-magnet generator for future embedded aircraft generation systems’, IEEE Trans. Ind. Appl., vol. 41, no. 2, pp. 551–556, Mar. 2005.
[23] ‘Power Cables in Wire & Cable | TE Connectivity’. [Online]. Available:
http://www.te.com/usa-en/products/wire-cable/copper-wire-cable/power-cable.html. [Accessed: 29-Apr-2016].
[24] ‘American Wire Gauge (AWG) Cable Conductor Size Chart / Table’. [Online]. Available:
http://diyaudioprojects.com/Technical/American-Wire-Gauge/. [Accessed: 29-Apr-2016].
[25] ‘Batteries and Advanced Airplanes - Boeing 787 Updates’, Boeing Mobilizes Resources. [Online]. Available: http://787updates.newairplane.com/787-Electrical-Systems/Batteries-and-Advanced-Airplanes. [Accessed: 06-May-2016].
[26] ‘Li-ion cells for space applications’. [Online]. Available:
http://www.gs-yuasa.com/en/technic/vol12/pdf/012_01_015.pdf. [Accessed: 10-May-2016]. .
[27] ‘Boeing 787 Specs, what makes a Dreamliner? - Modern Airliners’. [Online]. Available:
http://modernairliners.com/boeing-787-dreamliner/boeing-787-dreamliner-specs. [Accessed: 10-May-2016]. [28] 'Remote control circuit breakers'. [Online]. Available:
http://www.aeroelectric.com/Mfgr_Data/Breakers/Eaton/SM6 00.pdf. [Accessed: 21-June-2016]
[29] Furmanczyk, K. and Stefanich, M., "Demonstration of Very High Power Airborne AC to DC Converter," SAE Technical Paper 2004-01-3210, 2004, doi:10.4271/2004-01-3210. [30] 'Environmental conditions and test procedures for airborne
equipment', RTCA DO-160F standard, Mar. 2010
Contact Information
The authors are with the Institute for Energy and Environment, Department of Electronics and Electrical Engineering, University of Strathclyde, Level 4, Technology and Innovation Centre, 99 George Street, Glasgow, UK G1 1RD. Email: [email protected].
Definitions/Abbreviations
EPS electrical power system
MEA more-electric aircraft
PE power electronics
ATRU auto transformer rectifier unit
TRU transformer rectifier unit
ATU auto transformer unit
DAB dual active bridge
ESR equivalent series resistance
RPDU remote power distribution unit
NiCd nickel cadmium
APU auxiliary power unit
PMS permanent magnet synchronous
CB circuit breaker
RCCB remote control circuit breaker
[image:9.612.36.562.41.710.2]Appendix
Table A: Length of cable interconnections in the case study model.
Interconnection Cable Lengths (m)
Gen 230Vac bus 5
230Vac bus TRU 2
230Vac bus ATRU 2
230Vac bus ATU 2
230Vac bus 230Vac
Loads 2-25
±270Vdc bus
±270Vdc Loads 2-5
115Vac bus 115Vac
Loads 2-25
28vdc bus 28Vdc
Loads 2-25
115Vac bus RPDUs 5-10
28Vdc bus RPDUs 5-10
RPDU buses RPDU
![Figure 2: Example MEA EPS architecture – derived from [4].](https://thumb-us.123doks.com/thumbv2/123dok_us/1562061.108815/2.612.47.293.373.688/figure-example-mea-eps-architecture-derived-from.webp)


![Table’. [Online]. Available:](https://thumb-us.123doks.com/thumbv2/123dok_us/1562061.108815/9.612.36.562.41.710/table-online-available.webp)