Rochester Institute of Technology
RIT Scholar Works
Theses
Thesis/Dissertation Collections
6-1-2011
Warranty prediction during product development:
Developing an event generation engine in an
engineer-to-order environment
Hee-Rak Kang
Follow this and additional works at:
http://scholarworks.rit.edu/theses
This Thesis is brought to you for free and open access by the Thesis/Dissertation Collections at RIT Scholar Works. It has been accepted for inclusion in Theses by an authorized administrator of RIT Scholar Works. For more information, please [email protected].
Recommended Citation
Warranty Prediction During Product Development:
Developing an Event Generation Engine in an
Engineer-To-Order Environment
By
Hee-Rak Kang
A Thesis Submitted in Partial Fulfillment of the Requirements
for the Degree of Master of Science
in Industrial Engineering
Supervised by
Professor Dr. Marcos Esterman
Department of Industrial and Systems Engineering
Kate Gleason College of Engineering
Rochester Institute of Technology
Rochester, New York
COMMITTEE MEMBERS:
Dr. Marcos Esterman
Associate Professor, Industrial and Systems Engineering Department Rochester Institute of Technology
Dr. Brian Thorn
Associate Professor, Industrial and Systems Engineering Department Rochester Institute of Technology
Dr. Carol Romanowski
Associate Professor, Center for Multidisciplinary Studies Rochester Institute of Technology
Approved By:
____________________________________________________
Dr. Marcos Esterman Date
____________________________________________________
Dr. Brian Thorn Date
____________________________________________________
Thesis Release Permission Form
Rochester Institute of Technology
Kate Gleason College of Engineering
Title:
Warranty Prediction During Product Development: Developing an Event Generation Engine in an
Engineer-To-Order Environment
I, Hee-Rak Kang, hereby grant permission to theWallace Memorial Library to reproduce my thesis in whole or part.
________________________________________________________________________________
DEDICATION
ACKNOWLEGMENTS
I must profusely thank my thesis advisors, Dr. Esterman and Dr. Romanowski. You guys spent many hours helping me figure out what to do! This work would not have been possible without both of you. Thanks to Dr. Thorn for helping me improve the readability of my thesis. It’s one thing to do the research, an entirely different thing to put it down on paper. Professor Esterman, I always knew I was a little bit weird and slightly off center. I didn’t realize I had company.
ABSTRACT
In order for manufacturing companies to stay competitive, it is necessary to drive warranty system improvements in terms of improved product reliability, improved service delivery efficiency and properly designed warranty policies. However, traditional methods for assessing warranty performance are not always sufficient to alert product development teams of the impending warranty issues.
Furthermore, improved assessment methods are needed to aid product development teams make decisions related to the warranty performance of the product.
TABLE OF CONTENTS
1. Introduction 1
2. Problem Statement 3
3. Review of Relevant Literature 5
3.1 Background 5
3.2 Current Reliability Prediction Tools 10
3.3 Related Research 15
3.4 Literature Review Summary 29
4. Research Methodology 30
4.1 Platform Concept in an Engineer-to-Order (ETO) Environment 31
4.2 Warranty Scenario 33
4.3 Data Exploration Approach 35
4.4 Initial Probability Model 38
4.5 Assess Results 41
4.6 Methodology Summary 41
5. Results 42
5.1 Platform Concept in an Engineered to Order (ETO) environment 42
5.2 Warranty Scenarios 44
5.3 Data Exploration 45
5.4 Initial Probability Model 58
6. Discussion 63
7. Appendix 69
1. INTRODUCTION
Competition between manufacturers in a global marketplace has resulted in companies looking for ways to lower product cost and increase profit margins. With total warranty costs approaching $8 billion in the computer and related high tech US based companies (Mueller, 2007), controlling warranty costs during product development is one promising method for companies to gain an edge over their competition.
In order to understand how to control warranty costs, one must understand that a warranty is a contractual obligation between a consumer and manufacturer that protects the consumer should the product fail to perform its intended function within a given time period (Esterman, Gerst, Stiebitz, & Ishii, 2005). Warranty is frequently used as a marketing tool and showcases the willingness of a company to stand behind its products and services. A good example of this is Hyundai’s car advertisements
showcasing its “100,000 mile power train warranty” as “America’s best warranty”. But warranty costs are not limited to product failure in the field. They can be a result of inefficient system delivery methods or poorly designed warranty policies (Esterman, et al., 2005). One major contributor to warranty costs is getting the concept right early on in the development phase (Wilson, 1993).
Therefore, it is in the company’s best interest to make any necessary design changes early on in the development process. This is because changes made later on in the development phase not only add costs but time to the product development life cycle. A delayed launch date negatively affects the total amount of revenue that can be generated during the product’s life cycle. The challenge is that it is difficult to utilize incomplete and disparate data at the beginning phases of the product development.
In order to better understand this opportunity, this research looked at how companies may be able to better manage the information that they already have, such as prior distribution/historical data,
quantitative data, and engineering, by utilizing a Bayesian approach. Using this type of approach allows companies to be able to handle data with small sample sizes as well as data that changes or grows over time (Campbell, 2006). This type of data integration may become helpful in assessing product reliability in the future. Current research looks at failure data at various test stages during product development in order to predict reliability growth (Mazzuchi & Soyer, 1993). This type of research focuses on reducing component or product failure modes but does not address other possible warranty events that may occur such as misaligned customer expectations.
techniques to create a warranty event generation framework. This was done in an engineer-to-order product development environment. Engineering to Order (ETO) firms face different challenges than that of firms that respond to consumer demand. Products that are made in ETO environments tend to be complex, technologically intensive, highly specialized, capital intensive and high value (Rahim, et. al, 2003). The variety of customers that they have to cater to results in products that are at different stages of development which makes development a difficult task. Further complicating this task is that customers tend to impose their own product development process on the ETO firm (Kumar, et. al, 2009).
2. PROBLEM STATEMENT
In order to address many of the challenges faced by companies to manage warranty performance during product development in an ETO environment, the main focus of this thesis was to develop methods to condition the available data streams for use in a Bayesian framework. Characteristics of ETO systems such as increased system complexity and long product life-cycle increase the likelihood of warranty issues that makes it a good candidate for testing the feasibility of this type of framework.
Traditional (non-Bayes approaches) reliability tools vary in their degree and effectiveness of predicting warranty events, and are generally used to characterize product reliability at a particular development stage. By the time field data has been collected and reviewed, the product development team is already at work on the next product revision. In order to close the gap between the time data is
available to the time when this data is needed, the Bayesian framework was used to integrate field data and any available product development data. This enabled warranty performance data to be available at the any stage of the product development.
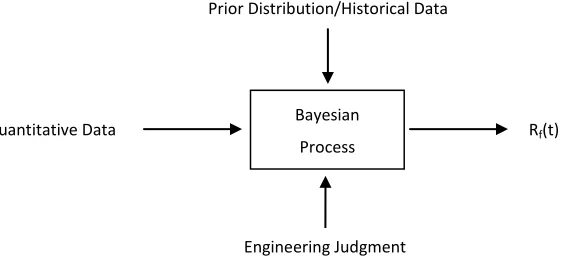
[image:11.612.160.442.525.654.2]There are many challenges to this approach. One problem is the conditioning of datasets into probabilities for a Bayesian framework: prior probability, conditional probability and marginal probability. Since valuable information can be lost when data is preprocessed to fit to a distribution, combining different sources has been seen as a solution to avoid making too many assumptions and create an accurate representation of the data. Another issue with combining multiple data streams is the variety of ways sources can vary in form from point estimates, probability distributions, ratios, to qualitative. An input-output model has been provided below as a conceptual and mathematical framework (Yadav, et al., 2002).
Figure 1. Bayesian Input-Output Model (Yadav & Prakash, 2002)
While information about warranty performance would be highly valuable and informative by Prior Distribution/Historical Data
Engineering Judgment
Quantitative Data Bayesian
becomes available. If this process is adapted to current product development systems, development teams will be able to review predicted warranty performance at each development stage and have the capability to not only see what the current performance levels are but what they are likely to achieve. Therefore, a focus of this thesis will be to not only create an initial Bayesian model that integrates disparate datasets, but also to show feasibility that this model can be updated with new information.
The problem of combining information sources for a Bayesian framework is crucial to achieving an accurate and trustworthy warranty cost prediction model. Accelerated design process and improved cost estimation accuracy relies on the ability to combine multiple data streams into valuable information and insights. This research will seek to answer the following questions: Can multiple data streams be conditioned for input using the Bayes’ Theorem? What are some of the issues that can occur when qualitative data is integrated with quantitative data? What are the different methods to condition available data streams in a Bayesian framework? These are questions that have not been answered in current literature in regards to integrating data in a Bayesian framework for warranty prediction.
3. REVIEW OF RELEVANT LITERATURE
Warranty is a complex topic that stretches beyond product reliability. In order to appreciate and understand warranty issues, it was important to give a comprehensive background of warranty from a historical perspective as well as a review of the current reliability tools. Since the majority of current reliability tools are focused on one time analysis, the purpose of this literature review will be to seek to develop the reader’s knowledge of the current tools that are used today and relevant research that seeks to extend this one-time analysis into a predictive model will be discussed.
Therefore, there will be an initial discussion on the background of warranty that will cover the evolution of warranty as well as the different types of warranty policies available. Although not the focus of this research, the purpose of the background will be to introduce the reader to the legal aspects of warranty. This will be followed by a review of current reliability prediction tools covering popular reliability assessment tools (FMEA, FTA, etc) as well as physics of failure and reliability block diagrams. These are tools that are currently used to perform a one-time reliability analyses. Although these tools were not utilized in this research, the possibility of incorporating this into a Bayesian predictive model is discussed in the future work. The last review section covers relevant research, parts of which were later used in this thesis.
3.1 Background
3.1.1 Evolution of Warranty
In order to understand warranty events, it was necessary to recognize the evolution of warranty and the impact it had on building customer relationships. Warranty, in essence, is a promise that a seller makes to the buyer concerning the quality of goods or their fitness for a particular purpose. It is therefore important that a customer’s expectation of a product’s purpose is aligned with the intended purpose of a particular product. Depending on the context that it is used, warranty can be (Arvinder, 1998):
1. Law in a contract, a promise or binding statement which is non-essential to the main purpose of the contract, so that a failure to honor it does not cause the contract to be ended but may give the other party good reason to claim damages for breach of warranty.
3. Commercial, a promise or statement by the seller or the buyer concerning the quality of goods or their fitness for a particular purpose. Without warranty, the goods are being sold on the condition that the seller has no responsibility for any faults or imperfections in the goods, and the buyer has no right to return them or claim damages or any other remedy.
Therefore, when describing warranty and warranty events it is vital that the issues of negligence, fault and/or due care are discussed and understood by all parties involved. For example, a seller or
manufacturer may be liable for a defect whether he/she knew it or not but will not be if there is a breach of warranty. These issues are important when understanding the legal ramifications of developing a product’s warranty.
In early civilizations, the issue of warranty was raised from a variety of products from cattle to slaves. Tablets from Babylonia have been found to have read (Arvinder, 1998):
…If a man has bought a male or female slave and the slave has not fulfilled his month, but the
bennu disease has fallen upon him, he (the buyer) shall return the slave to the seller and the
buyer shall take back the money he paid…
This sort of “money back guarantee” from the Hammurabic Code offered the buyer compensation for defects discovered in the product after the sale. For various other products and services, the Hammurabic Code provided an eye-for-an-eye type of compensation, for example, a house builder, “who has not made strong his work” (Arvinder, 1998) causing the house to collapse thereby killing the owner, is put to death for his negligence. Codes regarding warranty events during these ancient civilizations had varying time periods from which claims may be made.
Ancient Indian law dealt with warranty events similar with that of the Babylonians, “money back guarantees” were provided to dissatisfied buyers in a specified time period. These time periods were for example: iron (one day), milking cows (three days), and beasts of burden (five days) (Arvinder, 1998). In contrast, Islamic law handled warranty events from a religious perspective, placing emphasis on intent.
From the Industrial Revolution and beyond, protection for the buyer decreased with the growing acceptance of caveat emptor or “let the buyer beware”. Under this idea, buyers were not entitled to receive compensation for any problem associated with product except outright fraud on the part of the seller. Although this may seem unfair to the buyer, in most cases the issue was moot as the buyer and seller were usually from the same local community, and there usually was no need for an express
warranty. It would be far more appropriate and effective for buyers to have expressed their dissatisfaction on a personal level. It was not until the late nineteenth century that standardized product warranties became common. At the start, product warranties were almost always one-sided, providing little to no protection for the buyer and most likely did not cover failed component parts, transportation charges, ensuing damages, etc. In addition, most companies failed to honor warranties, and a trend of dishonest companies caused customers to perceive warranties as an indicator of poor product quality. It was not until the development of several independent product-testing organizations that these types of practices were curbed. These testing agencies are still around today, such as Underwriters Laboratory, Good Housekeeping Institute, and Consumer Reports. Seals of approval from these independent testing agencies went a long way to gain consumer confidence for a particular product (Arvinder, 1998).
In the United States, the Federal Trade Commission (FTC) created several laws governing the sale of goods. The Uniform Sales Act enacted during the 1930s defines warranty as:
… any affirmation of fact or any promise by the seller relating to the goods… if the natural
tendency of such affirmation or promise is to induce the buyer to purchase the goods, and if the
buyer purchases the goods relying thereon
This definition highlights the obligations of express warranty, the two kinds of which is promissory or contractual in nature and which is the nonpromissory affirmations of fact.
It could be said that throughout the evolution of trade, product warranty has evolved and
3.1.2 Warranty Policies
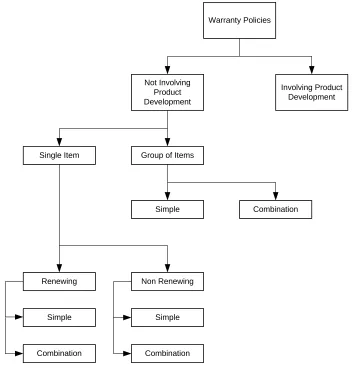
[image:16.612.88.445.187.560.2]Although warranty policies were not the main focus of this thesis, it was important to develop the reader’s understanding of warranty by reviewing the different types and variations of warranty policies available on the market today. Blischke and Murphy (1992) gave a good representation of the types of warranty policies found, in Figure 2, shown below.
Figure 2. Warranty Policies (Blischke & Murthy, 1992)
For most consumers, the type of warranty policy that they will be familiar with is the simple non-renewing single item not involving product development warranty policy. This warranty policy is typical for items such as consumer electronics that come with a one year warranty. For these products, the product is warranted against manufacturer defects for one year. This generally means that the
manufacturer will service or replace the unit if found defective for free until the one year limit. This type
Warranty Policies
Not Involving Product Development
Involving Product Development
Group of Items Single Item
Simple Combination
Renewing Non Renewing
Simple
Combination
Simple
of policy is generally non-renewable, if the unit was found defective 6 months into the warranty period with a new unit, the new unit does not extend the warranty by another year.
For large equipment consumers such as the military, warranty policies include a contract that involves product development after the sale. This is because, the item is generally large and complex (ex. Aircraft carrier) and it is understood that the item will most likely need to be modified or improved after sale rather than be replaced.
3.2 Current Reliability Prediction Tools
There are several popular reliability assessment tools that are currently in use today at many companies. Among them are Failure Modes and Effects Analysis, Fault Tree Analysis, Physics of
Failures, and Reliability Block Diagram. These tools are effective at analyzing reliability at a given period of time. However, because they are traditionally performed as a one-time analysis, they are not as
effective in predicting warranty or reliability performance early on during the product life cycle. This research sought to address this gap by attempting to integrate these various tools into a Bayesian framework to better predict warranty performance early in the product development. Although this was found not possible due to the information provided by our industrial partner, these tools are still good candidates as quantitative and qualitative data for the Bayesian input model.
3.2.1 Failure Modes and Effects Analysis
Failure modes and effects analysis (FMEA), a procedure for analyzing potential failure modes was first introduced by the US Armed Forces in the late 1940s. It is widely used during both product and process development to identify and analyze failure modes and the severity of their consequences. Failure modes are any errors or defects in a process, design, or item, especially those that affect the customer, and can be potential or actual. The benefit of conducting a FMEA during product development includes the ability to perform a step by step breakdown of potential failure modes and rank them by risk.
As one of the most widely used techniques in product risk analysis, it allows potential product problems to be identified before they reach the customer (André, et. al, 2008). As shown in Table 3, each component or failure mode is examined for the following: probability of failure occurrence (Occurrence), severity of failure (Severity), and ability to detect failure before it occurs (Detection). Multiplying these generates the risk priority number (RPN) which allows teams to prioritize the failure modes. If the RPN value is higher than a predetermined limit, actions (ex. design mitigations) are generally required to mitigate the failure risk. FMEAs are effective not only for their ability to prioritize critical failures but also because they require an analysis of each component of a system (André, et. al, 2008). Nevertheless, there are several drawbacks to FMEAs, as outlined below (Javier, et. al, 2002):
Risk evaluation using RPN cannot always be assessed by “detection”;
There is no exact rule to determine the probability of occurrence and detection;
relationship between the probability of failure occurrence and its score is not necessary linear;
Different scores for occurrence and detection can result in the same RPN, despite the risks involved being completely different; and
The RPN is not an effective measure of proposals for improvements.
These drawbacks make the FMEA a useful tool for qualitative data but not so much for quantitative. Although this research did try to leverage the qualitative data provided by the FMEA and supplement the quantitative with other sources, i.e., historical data, we were unable to do so. In the future, it may be possible to integrate the FMEA with other data sources into a Bayesian framework for warranty prediction.
Table 3. Failure Modes and Effects Analysis Example
Item/ Function Potential Failure Mode Failure Mode Effects Se ve rit y
Failure Causes O
cc
ur
re
nc
e
Current Controls D
et ec tio n R P
N Actions Taken Seve
rit y O cc ur enc e D et ec tio n R P N
3.2.2 Fault Tree Analysis
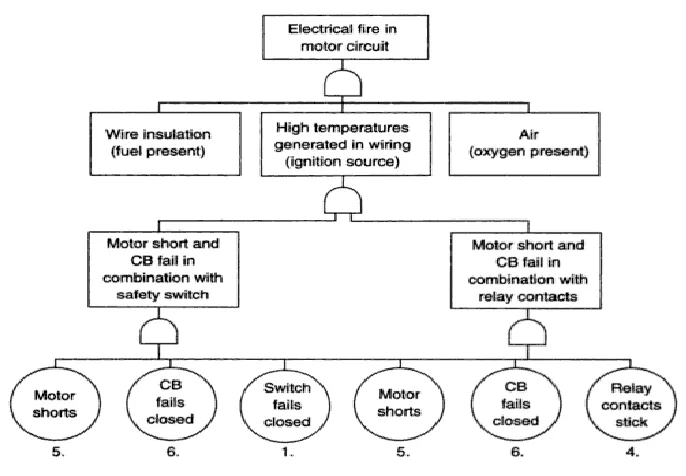
The fault tree analysis (FTA) is a failure analysis in which an undesired state of a system is analyzed using Boolean logic to combine a series of lower-level events. Used mostly in the safety engineering field to quantitatively determine the probability of a safety hazard, it is useful in breaking down complex systems into simpler contributing components.
Figure 4. Fault Tree Analysis Example (Stamatis, 2003)
Although useful for taking all types of failures into account, due to its inherent structure, only a single event can be a top event. Therefore, additional fault trees must be developed for every top event. This can be a time consuming process that generally leads to only a handful of fault trees created. In addition, FTAs are usually performed once during the product development process and therefore does not accurately reflect the product as it is being developed.
Furthermore, because the value and accuracy of the FTA depends on the skill and experience of the analyst, the quality of the fault tree can vary greatly (Bailey, et al., 2008). Therefore, the FTA is a good candidate for use as part of the engineering judgment data for the Bayesian framework.
Unfortunately this research was unable to find any relevant fault trees and therefore was unable to utilize this type of data.
3.2.3 Physics of Failures
Figure 5. Physics of Failure Model (Matic & Sruk, 2008)
As illustrated above, the first step is by evaluating the environmental factors and conditions. The next step involves isolating potential failure triads (site, mode, mechanism)(Matic & Sruk, 2008) and by determining what the failure contributing mechanisms are. This step combines the identification of failure sites and site corresponding failure modes, and the determination of mechanisms contributing to a
potential failure mode (Matic & Sruk, 2008). The next step filters contributing environmental and/or operational factors and the last step finds the functional dependencies of all stresses and identifies any applicable models. From the identified models, a particular one is selected that is the best fit for the specific operational/environmental conditions. Therefore, when the proper equations are known, the effect of the operational/environmental condition is also known as well.
There are many advantages to the P-o-F approach for evaluating and identifying reliability concerns and in effect positively impact the development cycle and reduce project costs. Among them are the ability to compare up-front design candidates, identify up-front design improvements, obtain realistic predictions, estimate the reliability quickly, determine the life expectancy of components, optimize environmental stress screening, and identify a focus of preventive maintenance and its optimal preventive interval.
3.2.4 Reliability Block Diagram
Reliability Block Diagrams (RBD) are used to perform reliability studies and provide information on system risks by evaluating the functional relationship between components in a system. These models also infer predictions based on parts-count failure rates taken from historical data. It should be understood that these predictions are rarely accurate but are useful in understanding the relative severity of risks involved. The figure below (Figure 6) shows a simple reliability block diagram (Gough, et. al, 1990):
Figure 6. Reliability Block Diagram Example (Gough et. al, 1990)
RBDs are able to handle complex systems as they are easily scalable from small and simple to large and complex systems. This makes RBDs well suited to today’s systems as they grow in size and complexity. In contrast to fault tree models that model component failures as they relates to system failure, RBDs focus on how component success results in system operation success.
Like a FTA, RBD provides an intuitive graphical representation of the system from a reliability perspective (Bailey, et al., 2008). However, for all their benefits, RBDs are only as accurate as the failure data available for the components that make up the system (Bailey, et al., 2008). Failure rates that assigned to a component in the system may not accurately reflect what is actually occurring in the field. In addition, RBDs also assume that items fail independently from each other which may not be the case.
3.3 Related Research
3.3.1 Framework for Reliability Prediction
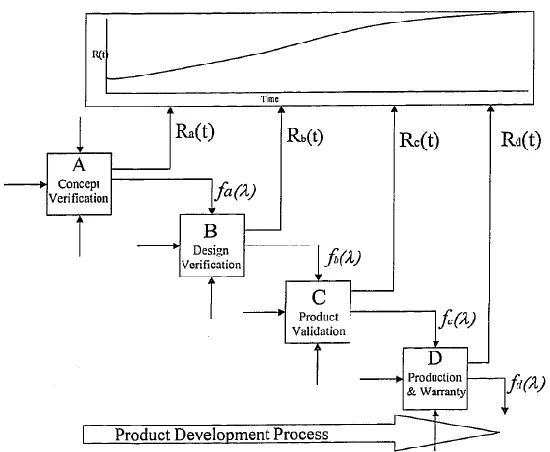
Yadav, et al. (2002) described a process for reliability assessment and prediction during the product development process which could utilize qualitative (fuzzy) information, prior knowledge, and quantitative data. Ideally by integrating all existing reliability assessment data, we could achieve better accuracy and realistic estimates. In order to effectively track and manage reliability improvement during the development phase, continuous reliability estimation is necessary as product moves from one design phase to another. Yadav, et al. (2002) incorporated the fundamental Bayes’ theorem with fuzzy logic reasoning to enhance the capability of the Bayesian model to accept fuzzy information. This was due to the subjective and qualitative nature of engineering judgment, as well as other factors that did not provide hard numerical data.
Figure 7 Product Development Process Model with Reliability Growth (Yadav & Prakash, 2002)
Yadav, et al. (2002) suggested that by calculating the reliability estimate at each design phase, it would be possible to increase product reliability over time. This would result in a revised reliability estimate at the end of each stage incorporating the engineering judgment for design changes, corrective actions, and other qualitative information. Ideally, this estimate would show a positive change in reliability improvement at the end of each stage. Although Yadav, et al.’s (2002) work did a good job incorporating qualitative (fuzzy) information, prior knowledge, and quantitative data, it did not take into account the warranty scenario as a chain of events. Yadav’ focus was on the product reliability only and did not take into account warranty events out in the field.
Figure 8. Framework for Predicting Warranty Performance (Esterman, et al., 2005)
This type of framework would allow warranty performance predictions during the product development phase by accomplishing the following objectives (Esterman, et al., 2005):
1. Facilitate decision-making by increasing the product developers’ and managers’ confidence that their actions are leading to improved warranty performance in the field. In addition, these models should provide insights to the development team for actions they can take to mitigate warranty costs.
2. Provide the management team an accurate projection of warranty costs so that the enterprise can appropriately plan for the financial impact of these costs. These impacts include: product pricing, extended warranty support pricing, service inventory requirements, warranty accruals, etc.
This research sought to further develop the framework proposed by Esterman, et al. (2005) by researching the feasibility of combining multiple information sources into a Bayesian process. Data mining techniques and Bayesian methods was also used to be implement this framework on a test case study to demonstrate feasibility.
3.3.2 Bayesian Statistics
Bayesian statistics is a statistical theory and approach to data analysis that provides a coherent method for learning from evidence as it accumulates(Campbell, 2006). Utilizing Bayesian statistics, we can develop a systematic framework that can accommodate noise, variability, and low samples sizes. This will allow us to integrate disparate incomplete datasets throughout the product development cycle.
Therefore, a review of the general mechanics and applications of Bayesian statistics was
predict warranty events early in the product development cycle. Furthermore, an understanding of the usage of Bayesian statistics could reveal data conditioning requirements for integrating prior historical knowledge, engineering judgment, and test results.
The fundamental idea in Bayesian statistics is that one’s uncertainty about an unknown quantity of interest is represented by probabilities for possible values of that quantity(Campbell, 2006). Using the Bayes theorem (shown below in Figure 9), it would be possible to combine previous information with current data.
Figure 9. Bayes’ Theorem
This is done by defining the probabilities of the Bayes Theorem. For instance, before testing begins and data is obtained, a prior distribution P(A) can be determined based on prior probabilities or a distribution that matches the failure mode. For example, P(A) can be the probabilities of a particular event according to prior historical data. If there is no previous knowledge, a non-informative prior distribution can be used instead. As data is gathered and information is collected, prior probabilities P(A) are updated per Bayes’ Theorem to posterior probabilities P(A|B). These posterior probabilities P(A|B) are probabilities for values of the unknown quantity after data is observed and in the next iteration take the place of the prior probability.
In doing this, a Bayesian approach allows for the derivation of the predictive probability from a posterior probability. This predictive probability is the probability of future events given outcomes that have already been observed. With all possible values of future outcomes, we can create a predictive distribution that will permit us to determine when to stop testing, predict outcomes, and adjust test results for missing data. Bayesian statistics is different than traditional frequentist approaches in that Bayesian analysis bases all inferences on the posterior distribution which is the product of the prior distribution and likelihood function.
3.3.3 Bayes During Development Testing
Although not focused on warranty per se, Mazzuchi & Soyer (1993) presented a method for analyzing product reliability during the development phase using a Bayes approach. During product development, testing is performed at various stages to determine if a design change is needed. These design changes are made in hopes of enhanced product durability and/or quality. This type of process generates both attribute (pass/fail) and variable (failure time) test data that can be termed “reliability growth”. This reliability growth is the building block for the model developed by Mazzuchi & Soyer (1993) to determine a product’s reliability at each stage of the design.
In the proposed Bayes approach, failure data from sequenced testing/modification stages is used as prior distribution. Test results at each test stage can be used to update this probability and therefore affect the probability at subsequent test stages leading up to the final development phase. This is an important distinction between other current Bayesian approaches to product reliability as it yields future reliability estimates after each test stage (Mazzuchi & Soyer, 1993) instead of the current reliability estimate at each test stage.
Mazzuchi & Soyer (1993) suggested a framework for incorporating prior information using the prior distribution shown below where m specifies test stages, q is the probability of occurrence for a nonfixable-cause failure mode and p specifies the testing performed. This type of framework allowed for actual test-stage failure probabilities and perceived absolute and/or relative change in these values (Mazzuchi & Soyer, 1993) shown below in Equation 1.
i i i m j m j j m j q p q j p j p p q 1 ; parameters positive prior , stage -at test test -p a in failure cause -fixable p test p a in failure cause nonfixable q stages of number m where ) 1 ( ) 1 ( ) ( ) ( ) , | , ( 1 1 1 1 1 0 2 0 2 0 (1)
While Mazzuchi & Soyer’s research is similar to this research in that both use the Bayes theorem to integrate failure data at various points during the product development, Mazzuchi & Soyer’s research focus primarily on product failures. Mazzuchi & Soyer also focuses primarily on failure data and did not present a way to integrate disparate data sets that could also add value to the development of the posterior probability. This research sought to address these two opportunities.
3.3.4 Bayesian Belief Networks
A review of Bayesian Belief Networks was important as they helped us understand how warranty events could have causal relationships that are determined by both qualitative and quantitative data. Although not used in this research, they present a way to assign probabilities to a chain of events that could include the warranty event and repair.
Bayesian belief networks (BBN’s) are also known as “probabilistic networks” and constitute a mathematically sound way for representing and reasoning with joint probability distributions (JPDs) in an internally consistent manner (Lee, 2002). Many top companies have successfully utilized BBNs to
diagnostically model mechatronic equipment. A simple Bayesian belief network is shown below in Figure 10 (Lee, 2002):
Figure 10. Simple Bayesian Belief Network Example (Lee, 2002)
A Bayesian belief network consists of the following qualitative and quantitative relationships: set of random or deterministic variables, set of directed edges or arcs, and a set of root and conditional probabilities. From the example above, there are variables (Sprinkler, Rain, Grass Wet), the causal relationships between them (shown by the arrows), and the probabilities describing it all. There are three fundamental “causal patterns” that are the basis for how all other patterns are constructed:
X causes Y and Z
Exacting inferences from BBNs may be performed with either exact or approximate methods depending on the structure used (Lee, 2002). An exact method such as the Probability Propagation in Clique Trees (PPCT) method works in two basic steps. The belief network is first converted into a
secondary computation structured called a “clique tree” and then the probabilities of interest are computed by operating on that secondary structure. BBNs present an opportunity to model multiple causes to a single failure mode. This is an advantage over most current reliability tools such as the Fault Tree Analysis. By relating probabilities to failure events, it may be possible to generate likelihoods for individual warranty events.
3.3.5 Failure Modes and Effects Analysis with Bayesian Belief Networks
Although not used in this research, Burton Lee’s research presented a way to incorporate
Bayesian techniques into a popular reliability analysis tool, Failure Modes and Effect Analysis, in order to better quantify risk. While this approach has its merits, it fails to address other sources of data such as life test data or engineering judgment. Nevertheless, it was important to review relevant literature in order to discover parallels between this research and Burton’s.
A common criticism of scenario based FMEAs from experienced engineers is the lack of correlation between the criticality rating and real life scenarios. Although RPN values are helpful in prioritizing risk, it appears to do a poor job accurately quantifying it. Combining FMEAs and Bayesian Belief Networks may be one way to rectify this.
The BN-FMEA uses the belief network theory to construct directed acyclic graph (DAG) models of failures scenarios to represent causal and statistical dependences between internal and external states as well as the event variables of the physical system (Lee, 2002). It uses a new class of severity variables as well as both root probabilities and conditional probabilities to obtain improved inference and design trade-off evaluation as compared to a traditional FMEA. Similar to a traditional FMEA, a FMEA criticality matrix is generated from the belief net model.
A Bayesian network based FMEA methodology allows for the specification of severity
The BN-FMEA method utilizes the Bayesian network graph with four primary variable
groupings: physical system, customer and world state and event variables, and severity variables. In order to construct this model, Burt Lee suggests the following steps (Lee, 2002):
Step 1 - Build failure scenarios: Failure "chains" representing individual failure scenarios are constructed out of these physical system variable types. System-level models are assembled from chains which share variables; (Lee, 2002)
Step 2 - Severity annotations: For every variable designed as a "failure end-event" or FEE, attach a severity variable along with its associated parent variables; (Lee, 2002)
Step 3 - Compile the Clique Tree: compile every failure scenario-severity model; (Lee, 2002)
Step 4 - Extract and Plot: Extract the required failure occurrence probability and severity distribution information from each compiled scenario and plot on the criticality matrix. (Lee, 2002)
Step 5 - Update: revise the failure scenario model to reflect any design improvements made as a result of the FMEA analysis. (Lee, 2002)
In order to build a failure scenario, we need to start with the "failure chain", the complete failure sequence of the physical system, from the original cause to intermediate effects, and finally to the "end effect" of "failure end-event". There are two basic approaches to developing a failure scenario, the component-based variable identification and the function-based variable identification.
Conditional Severity Variable
Severity Distribution = P(Severity|failure end-event, system-internal states, system-external factors, customer actions or states)
The benefit of utilizing a probability distribution for severity lends itself to flexibility. Traditional FMEAs define severity as a point distribution which by definition lends itself to a potentially wide range of interior and exterior states and events.
Dual failure scenarios and Severity
We can set the use of a single severity standard across all failure scenarios that must be enforced by the modeling environment during model construction.
Generation of the BN-FMEA Criticality Matrix
The Criticality Matrix as well as the candidate pointset (Pi) is generated once all qualitative and
quantitative relationships are specified in their respective DAG's for all failure scenarios. For each failure scenario, a single candidate point Pi is assigned to it. In order to determine the x and y coordinates for each candidate point, the y-axis is set to the failure end-event's a priori value from the clique tree. By setting the failure end-event (FEEi) to what is observed and obtaining the maximum severity state, the
x-axis is also obtained.
Registering Design Improvements
Individual failure scenarios are updated as design improvements are identified during the FMEA process. As expected, reliability improvements will result in the decreasing of the underlying root probabilities or conditional probability tables. Major design changes may result in changes to the DAG, for example new nodes or modified ones.
3.3.6 Data Mining
Data mining, also known as the knowledge discovery from data (KDD), can be defined as the application of computer algorithms to discover useful knowledge in large databases (Romanowski, 2004). Although it is not a new field, having been in use for over ten years, it is a tool that is heavily used in a variety of industries, such as the banking industry. A data mining approach can be symbolic or non-symbolic; predictive or classifying; but it is always interactive and iterative (Romanowski, 2004).
Regardless of the particular approach used, the following general steps are the same for most data mining algorithms (Romanowski, 2004):
Determine the type of learning Choose the data mining algorithm Choose the target variable
Pre-process the data Mine the data Analyze the output Refine the task
3.3.6.1 Clustering
The k-means algorithm, also called k-means clustering is a technique of grouping a number of n observations into k clusters depending on how close an observation is to the cluster with the nearest mean (otherwise known as seeds). It is an iterative method that allows the user to at first select a random k initial means, then associating every observation with the nearest mean. The centroid of each of the k clusters (seed) becomes the new means and existing k clusters are redefined repeating until convergence has been reached. See Figure 11 below (Berry, et al., 2004):
Figure 11. K-Means Algorithm Example (Berry, et al., 2004)
3.3.6.2 Support Vector Machines
using SVMs, disadvantages include: slow speed during the test phase, selection of the kernel function parameters, high algorithmic complexity and extensive memory requirements of the required quadratic programming in large-scale tasks (József & Gábor, 2008).
Figure 12. Support Vector Machines Example
3.3.6.3 Association Learning
The Apriori algorithm is a popular data mining approach that learns association rules. It attempts to find similar items given a set of itemsets. It does this by finding subsets which are common to at least a minimum predetermined number of the itemset. Apriori algorithms are typically used for transaction based datasets, such as determining what items a customer buys and if there is a relationship between the items customers buy, such as a computer and a keyboard. Depending on the type of values, the
association rules can be classified into either Boolean Association Rules or Quantitative Association Rules. Regardless of the association rule selected, the following determines the association (Wu, et al., 2008):
Minimum Support Threshold
o The support of an association pattern is the percentage of task-relevant data transactions for which the pattern is true.
Minimum Confidence Threshold
Apriori first scans the database and searches for frequent itemsets of size 1 by accumulating the count for each item and collecting those that satisfy the minimum support requirement. It then iterates on the following three steps and extracts all the frequent itemsets (Wu, et al., 2008). Given a historical data set, an Apriori algorithm may be one possible way to identify relationships between features. Other types of data mining algorithms are tabulated in Figure 13.
Figure 13. Typical Data Mining Algorithms and their characteristics (Romanowski, 2004)
3.3.6.4 Decision Trees
Decisions trees are one way to model a group of conditions and their result in a tree-like format. With a decision tree, it is possible to predict a result even if the set of conditions is not in the original dataset.
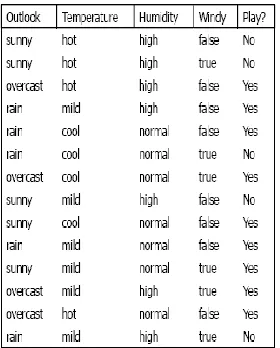
Figure 14. Weather Example Dataset (Witten & Frank, 2005)
[image:35.612.237.377.74.248.2]In building a decision tree, there are two approaches: top-down construction and bottom-up tree pruning. In a top down tree construction, all training examples are at the root and examples are partitioned recursively by choosing one attribute each time. In a bottom-up tree pruning, branches or sub trees are removed in a bottom-up manner to avoid over fitting. To choose the splitting attribute, all available attributes are evaluated at each node on the basis of separating the classes of training examples. One of two good functions are typically used for this purpose: information gain and information gain ratio. A good criterion for attribute selection is the one that will result in the smallest tree. This will reduce the risk of overfit, where the tree has defined the data set too strictly. It may however result a risk of underfit, which results in the opposite problem. Using a goodness function such as information gain, we can select attributes based on the average purity of the subsets that the attribute produces.
3.3.6.5 Data Mining Conclusions
While data mining can be used to uncover patterns in data samples, it is important to be aware that the use of non-representative samples of data may produce results that are not indicative of the domain. Similarly, data mining will not find patterns that may be present in the domain, if those patterns are not present in the sample being "mined". Hence, an important part of the process is the verification and validation of patterns on other samples of data.
3.3.6.6 Data Conditioning
A major focus of this research was the integration of different datasets for input into the Bayesian model. In order to do this, a common set of parameters was needed. After this was set, data could then be converted or transformed to meet these criteria.
3.3.7 Design for Warranty Cost Reduction
During product development, a process based cost model for warranty events can be used to reduce the eventual cost of warranty. This can be successfully done when key warranty cost drivers are identified and a set of cost reduction strategies are executed.
With the total cost of warranty for computer and related high technology US based companies now approaching $8 billion per year (Mueller, 2007), design for warranty cost reduction takes an important in role in maintaining profit margins.
Although numerous companies have shifted their warranty costs by moving towards an extended warranty strategy, this does not address the root causes and effects of poor product quality or misaligned customer expectations.
In order to reduce warranty costs, one must realize that for every warranty event there is not only a possible component replacement cost but a service process cost involved. In recent years, the available options of service processes include but are not limited to the following: phone support, web-based and customer self-fix schemes, repair centers, and on-site service calls. These service processes do not come cheap; from $30/call for a warranty event resolved over the phone to >$700 for on-site repairs (Mueller, 2007).
A service process based warranty costs model addresses both the customer's problem and the support process used to resolve it. For every warranty event there is a unique linkage of a diagnosed problem, a specific support process to resolve the event and specific material costs (components), if consumed. Therefore, the total warranty cost for a specific warranty type is the following (Mueller, 2007):
Expected warranty cost = Fi * (process cost + material cost)
where Fi = frequency of occurrence of a specific warranty event type.
However, as experience shows that for most products, only a handful of warranty events
dominate the total warranty costs, we can use the Pareto principle to define M, where M is the number of warranty event types that account for an acceptable percentage, for example 90% of a product's total warranty costs. Although the service process based warranty cost model was not utilized in this research, this research reviewed various costs that contributed to high warranty costs providing the basis for future research.
3.4 Literature Review Summary
In order to develop methods to condition available data streams for use in a Bayesian framework, a thorough literature review was needed to explore the vast number of tools available today. This thesis may not have used all the tools covered in this literature review, but it was important to review the
applicability of each tool for this approach for their usefulness in providing good data sources. Integrating multiple data streams and data mining techniques have been explored for this thesis to identify patterns and relationships between attributes that may provide valuable information to product development teams. This would hopefully lead to data conditioning requirements for a successful warranty prediction early on in the product development process.
4. RESEARCH METHODOLOGY
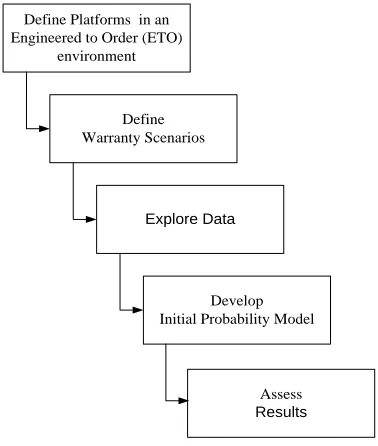
[image:38.612.176.365.262.485.2]This thesis sought to develop a mathematical framework to integrate Bayesian methods and data mining techniques to develop the event generation engine in an engineer to order environment. The purpose of this research was to show feasibility that disparate data sources can be conditioned for input into a Bayesian model to predict event rates. This built on the work developed by Yadav & Prakash (2002). This research relied on the use of actual data gathered with the help of an industrial partner. Actual data allowed us to uncover additional issues that needed to be solved and therefore helped to lead to a more robust event generation solution. The steps used to execute this research plan are summarized in Figure 16.
Define Platforms in an Engineered to Order (ETO)
environment
Define Warranty Scenarios
Explore Data
Develop Initial Probability Model
Assess
Results
Figure 4. Pictorial Representation of Research Steps
discussion of the challenges that were encountered. The remainder of this section describes these steps in more detail.
4.1 Platform Concept in an Engineer-to-Order (ETO) Environment
In an engineered-to-order environment, companies try to satisfy custom needs with custom products (Jin & Thomson, 2003). The major characteristics of an ETO environment are: customer involvement in product design and/or configuration, manufacturing planning directly linked to the details of customer orders, and material ordering and production scheduling driven by the pace of engineering development. These characteristics make manufacturing planning (orders, materials, facilities, personnel) complex due to the use of product information which is largely unknown at the acceptance of an order and which continuously changes as product specifications are finalized. This is in contrast to make-to-stock firms that produce market based products in very large quantities where the design characteristics are based on the market and not on an individual customer.
Rahim et al. performed a comprehensive study on the product design characteristics associated with ETO firms. Those features that are relevant to the warranty prediction process are highlighted in Table 17. A couple characteristics of the ETO system that increase the likelihood of warranty issues are increased system complexity and a lengthened product life-cycle. However, from an organizational perspective, a dependency on a similar product and a high involvement of manufacturing in design would lower the likelihood of warranty issues. These characteristics were important issues to consider because it indicated how different and important warranty issues would be to an ETO firm compared to a market-based firm.
Criteria Characteristic
Design Usually Exclusive To 1 Customer
Frequency Of Design Very Frequent
Design Effort & Cost Per Product High
Chance Of Design Improvement During Manufacture Low
Involvement Of Manufacturing Engineers In Design Always
Design Dependency On Similar Product High
Customer Input During Design Usually High
Product Test & Commissioning Usually At Customer Site
Customer’s Technical Knowledge High
Certainty Of Customer Requirements High
Product Complexity Generally High
Customer Requirements Generally Technical & Specific
Interpretation Of Customer Requirements Direct
Product Life-Cycle Long
Table 17. ETO Design Characteristics
Understanding the different design characteristics of ETO firms gave us an idea of what factors could increase or decrease the likelihood of warranty issues. But we still needed a way to group similar products together. This was because in an ETO environment, companies make a mixture of completely new products and reconfigurations of existing designs. Also, after a contract is awarded, there is a
continuous cycle of design, material change/confirmation and shop floor schedule change/confirmation as designs are negotiated with the customer and completed (Jin & Thomson, 2003). These products are assigned a unique contract number which can run in the thousands depending on the volume of the manufacturer. With so many unique part numbers, there was a need to group them into a manageable number.
Product family and product platform design is a way to facilitate mass customization by redesigning and consolidating a group of distinct products based on a set of common features,
Figure 18. Representation of Product Families and Iteration Numbers
In an engineered-to-order environment, the platform concept is not one that is typically adopted. Instead, these types of companies tend to think in terms of contracts. In order to determine which contracts to collect data from, it is useful to think of these ETO products in a platform context.
By doing so, the fact that products that share components are expected to share similar failure modes, can be leveraged. Data for each contract may be limited, thus the aggregated data from several contracts would allow us to treat them as a platform. Over time, this would allow us to gather reliability data over revisions to the platform (platform iterations) helping to show reliability growth.
Working with an industrial partner, products were grouped into “platforms”. These products were grouped by size, time period it was sold in, how it was used, and by the application of the product. In a low volume, high mix product environment, it was a challenge to group products into “platforms” which can then be used during the development of warranty scenarios. It was vital that this phase was completed with the help of the industrial partner as they were the experts in determining what attributes qualify each product to be part of a platform. The benefits go both ways as we were able to bring a fresh perspective to their unique set of warranty problems.
4.2 Warranty Scenarios
The warranty scenario extended the idea of a failure scenario used in an Advanced FMEA (Kmenta & Ishii, 2004). In an Advanced FMEA, the focus is on developing failure scenarios, in contrast to a traditional FMEA which describes the local effect of a component failure. For our purposes, a failure scenario was defined as “an undesired cause-and-effect chain of events”, a class of warranty scenarios was defined as a group of similar warranty scenarios, a warranty event was defined as an occurrence of the identified warranty scenario while the product was in operation, and each warranty scenario was defined as a failure scenario that included both diagnosis and repair events (Figure 19).
Product Family 1,
Rev A
Product Family 1,
Rev B
Product Family 1,
Rev C
Warranty Event
Generation
Warranty
Scenario Cost
Warranty Scenario
Identification
Causes Failure Modes Diagnosis Repair Effects/ Customer SymptomsCost
iP{WS
i}
Prioritization &
Risk Mitigation
E(Cost)
iFigure 19. Warranty Scenario Identification (Esterman, et al., 2005)
The first step of this reliability improvement activity was to identify the critical failure modes. When dealing with the development of complex systems, particularly those that incorporate new technologies, a class of failures that caused greatest concern is “unknown-unknown”. These were unanticipated failures resulting from physical mechanisms that were not understood very well. A second class of failure that generated concern were wear-out modes due to the length of time required to uncover them. Both of these could be incorporated in the warranty scenario from the design FMEA. An overview of the steps to developing a warranty scenario is shown in Figure 20.
Identify Critical Failure Modes Collect Relevant Data Interview Engineers Aggregate Data Determine Chain of Events
Figure 20. Warranty Scenario Development
Once the critical failure modes were identified, the next step was to determine the causes, effects/customer symptoms, diagnosis, and repair for each failure mode. Traditionally, for a customer facing event, this type of information was stored in the service record or if applicable a failure
investigation. It is at this stage that service records were combined with engineering judgment to provide a complete outline of the warranty scenario. This involved interviewing engineers and identifying candidate warranty events that have occurred historically. It should be noted that the warranty scenario includes causes that may be unlikely but can realistically happen in the field.
data, its associated cost. Both of these helped to facilitate decision making and provide management an accurate projection of warranty costs so that the team can either have confidence that their actions are leading to improved performance or plan accordingly to the financial impact. In the next section, we will show the data exploration phase of the research. In the end, both the warranty scenario and its related data sets were taken to create an initial probability model.
4.3 Data Exploration Approach
A major piece of this research focused on the identification of data sources that could be used for input into the initial probability model as shown in Figure 21. Using this model, the probability of a warranty event for the current platform iteration could be developed. Therefore, it was critical that an industry partner was identified in order to allow us to uncover additional issues that needed to be solved and therefore help lead to a more robust event generation solution. This was expected to be a challenge as data sources may not be integrated and would mostly likely reside in multiple locations.
Ideally, although the original intent of this research was to be able to integrate data for each platform iteration and compare the probability of each warranty event, this part of the research was never fulfilled due to the complexities introduced by the ETO environment. In the research, only data from one platform iteration was integrated. Therefore, the following steps were taken during data exploration: review of the different types of data available, identifying patterns in data using data mining algorithms, and the use of traditional statistical tools.
Historical Data (Warranty, Manufacturing, Product
Development, etc.)
Manufacturing Data Product Development
Test Data
Product Development Analysis Data
Qualitative Data Inference
Modeli
P{Warranty Event | tservice}
Figure 21. Input-Output Inference Model
A review of available data streams was done with the help of an industry partner. It was
only qualitative data, this would still be valuable in determining the relative likelihood of particular failures that may be missed when utilizing only quantitative data. The importance of this type of data has increased as more and more products are a combination of mechanical, electromechanical and software components. In the end, we were unable to find any engineering judgment data that could be used as inputs for the inference model.
Prior distribution/historical data were provided from field data records. Although this type of data did not include product revisions already in process, it was important to establish probabilities for
previous iterations of the current product platform. It was expected that previous iterations would be helpful in predicting a warranty event for the current platform.
Data mining was used to discover patterns in datasets and thereby gain inferences from multiple sources of data. By identifying underlying patterns, it may be possible to draw unsuspecting relationships and insights of value. This may prove useful when developing platforms in an engineering to order environment.
Specifically, patterns in data (association learning, clustering, etc) were explored using “Weka Explorer”. Weka provided an easy to use interface for data mining tasks with its collection of machine learning algorithms. These algorithms could be applied directly to the dataset or used via the user’s own custom program. For our research purposes, Weka was used out of the box for its tools on data pre-processing, classification, regression, clustering, association rules, and visualization. It should be noted that the Weka software is also useful for new machine learning schemes which can be added as necessary (http://www.cs.waikato.ac.nz/ml/weka/).
The following data algorithms were applied on the data sources provided by the industrial partner: association learning, clustering and decision trees. Association learning is a way to quantify the relationships between words for qualitative data. Association learning takes each row of data as a string of words and then tries to find a pattern by seeing what words are repeated in each row. Clustering is a way to find subsets of observations that are similar to each other. It is a method of unsupervised learning that allows to user to identify patterns in the dataset. Clustering uses algorithms such as the k-means algorithm which is a simple iterative method to partition a given dataset into a user-specified number of clusters, k (Wu, et al., 2008). The algorithm starts by picking a number of points as the initial k cluster
an if-then statement but are usually presented in a tree format. The number of levels as well as the size of the dataset can drive the size of the decision tree. Large datasets can produce decision trees that are quite complicated, creating decision trees that are difficult to visualize as shown in Figure A-6. These data mining algorithms allowed us to better analyze warranty data given the complexity of the interactions between the user, environment, and the product. Allowing automated algorithms and processes aided in the discovery of relevant patterns that allowed us to see connections between causes and undesired states more visibly.
In addition to data mining, linear regression analysis and general linear model was used to determine if warranty events could be predicted effectively using these tools. These are traditional statistical tools that can be used to correlate and model data using linear functions. For example, in order to create a linear regression model to predict warranty costs, the independent variable was set to internal costs and the depend variable was set to field costs. It was expected that these tools would not be successful dealing with the type of data we were expecting but we needed to verify this hypothesis.
Therefore, the data exploration phase of this research started with several traditional sources of data during Product Development: Historical Field Data, Product Development Testing Data, Failure Assessment Tools Data, and Engineering Judgment. Data sources will then be cataloged using a data dictionary which would list the following information for each dataset: attribute, example,
description/notes, qualitative/quantitative, type, and length. Field data can then be sorted by cost or frequency in order to prioritize the failure modes. This would help reduce the scope of the problem and give us a feel of where the “big” warranty issues are. It should be noted that relationships between data streams can also be explored with more traditional statistical methods such as linear regression analysis and general linear models. Data mining will then be used to aid in the analysis to model the underlying structures which give rise to consistent and replicable patterns. After analysis, this data can be
conditioned and pre-processed so that it is ready to be accepted as inputs into the Bayesian process which will be our initial probability model. This is because a Bayesian framework allows for a systematic process that can accommodate noise, variability, and a lack of data. In the end, this research sets the groundwork for a successful warranty event generation engine that would allow effective warranty prediction early on in the product development process.
4.4 Initial Probability Model
With warranty scenarios identified and data sources linked, an initial probability model was developed. For our purposes, the initial probability model used a Bayesian model based on discrete values. The duration of the warranty period was discovered to vary between one to two years. After reviewing the distribution of mean time to failure data, it was determined that setting the warranty period to one year would provide us the most amount of prediction data.
Initially, the concept of using a Bayesian model based on continuous values was explored. While it has its advantages such as being able to give the probability of a warranty event based on a length of time, it also posed problems given disparate data sets. Thus, a discrete solution was pursued. The inclusion of time was considered but converted to a discrete format. This was done so it would make the model easier to develop in order to demonstrate feasibility. Discrete values would also make data conditioning simpler as use cases could be used to convert number of cycles from a dataset (ex. life test) to an approximate length of time that would integrate well with actual field data. Using continuous values from disparate data sources would add a level of complexity that is not the focus of this particular
research phase. It would be difficult to correlate time values from one dataset with another. It is expected that a Bayesian model based on continuous values could be developed in the future.
Therefore, the model developed in this work sought to answer the following question: What is the probability of a warranty scenario occurring in the future within the warranty period? In order to answer this question, the initial probability model relied on using the Bayes equation (Equation 2) as a discrete function.
Probability of event H given evidence E:
] Pr[ ] Pr[ ] | Pr[ ] | Pr[ E H H E E H (2) Where
Pr[H|E] = Probability of a warranty event (given a specific warranty scenario) occurring given the warranty period
Pr[E|H] = Probability of the warranty period given the warranty event (given a specific warranty scenario) Pr[E] = Probability of being within the warranty period (over all events, regardless of warranty scenario) Pr[H] = Probability of a warranty event (over all time periods, given a specific warranty scenario)
warranty event over all time periods, regardless of whether it was in or out of the warranty period. The term Pr [E] indicates the probability of being within the warranty period over all events. See Figure 46 for an example of how the warranty events are related to each other in relation to the warranty period and a specific warranty scenario. The term Pr [H|E] that is calculated is the posterior probability, which
becomes the prior probability on the next iteration of the Bayesian model as the data is updated with new information.
Figure 46. Example of Warranty Events in relation to Warranty Period
From the Bayes equation, we developed the following models for a specific warranty scenario on a given platform. Details on why this approach was taken are explained below:
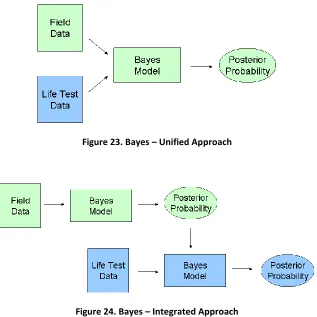
1. Bayes Approach – Developed a model using one dataset
2. Bayes Approach – Developed a model using one dataset split into two (Training and Test Dataset)
3. Integrated Bayes and Unified Bayes Approach – Developed a model using two datasets. One would be provided by our industrial partner and the other one would be fabricated.
In the first model, we started with a single dataset to show that creating a Bayes model was feasible using product data. For this model, a single dataset, a specific warranty scenario, and a platform were selected. Although we could have used engineering judgment or manufacturing data for our single dataset, we chose historical data because it was easy to quantify.
In the second model, we used a single dataset and split it into two to verify how we could use one part of the dataset to develop a Bayes model and update it using the other part of the dataset (Figure 22).
60 Warranty Events outside warranty period
40 Warranty Events within warranty period
10 Warranty Events for a specific warranty scenario that are within the warranty period 10 Warranty Events
for a specific warranty scenario that are outside the warranty period