Results of
RESULTS OF
Subseries
Volume:
Subseries
Volume:
Subseries
Volume:
Subseries
Volume:
Subseries
Volume:
Subseries
Volume:
I
-1
2
3
4
5
6
7
8
II
1
2
3
4
5
6
7
8
9
10
11
III
1
2
3
4
5
6
IV
1
2
3
4
V
1
2
3
4
VI
1
2
3
4
5
Impact on manufacturing
Food, drink and tobacco processing machinery
Pharmaceutical products
Textiles and clothing
Construction site equipment
Chemicals
Motor vehicles
Processed foodstuffs
Telecommunications equipment
Impact on services
Insurance
Air transport
Credit institutions and banking
Distribution
Road freight transport
Telecommunications: liberalized services
Advertising
Audio-visual services and production
Single information market
Single energy market
Transport networks
-Dismantling of barriers
Technical barriers to trade
Public procurement
Customs and fiscal formalities at frontiers
Industrial property rights
Capital market liberalization
Currency management costs
Impact on trade and investment
Foreign direct investment
Trade patterns inside the single market
Trade creation and trade diversion
External access to European markets
Impact on competition and scale effects
Price competition and price convergence
Intangible investments
Competition issues
Economies of scale
-Aggregate and regional impact
Regional growth and convergence
The cases of Greece, Spain, Ireland and Portugal
Trade, labour and capital flows: the less developed regions
Employment, trade and labour costs in manufacturing
Aggregate results of the single market programme
The Single JUarket Review
RESULTS OF
THE BUSINESS SURVEY
The Single Aia.rfc.et Review
taken in creating the Single Market. This survey forms part of a series of 39 studies which
assess the progress made in implementing the Single Market Programme. It was carried out in
1995 on a sample of randomly selected enterprises representative of the European Union's
production structure in terms of sector of activity, size and Member State of residence.
The operation was coordinated by
-b/UfOSIclt,
with the assistance of L / v j yv V (Internal Market and Financial Services)
ΕΠΟ. D v J
11 (Economic and Financial Affairs).
Data collection was carried out by the following bodies (National Statistical Institutes*):
INS* (Belgium), Statistics Denmark*, IFO (Germany), National Statistical Service of
Greece*, Ministry of Industry and Energy (Spain), INSEE* (France), ESRO in cooperation
with CSO* (Ireland), ISTAT* (Italy), Statec* (Luxembourg), NEI in cooperation with
Statistics Netherlands*, INE* (Portugal), NSO* (United Kingdom).
The European Commission would like to express thanks to the national experts and
representatives of firms for their contribution to the 1996 Single Market Review, and to this
survey in particular.
© European Communities, 1997
No part of this book may be reproduced, stored in a retrieval system, or transmitted in any
form or by any means, electronic, mechanical, photocopying, recording or otherwise without
written permission from the copyright holder.
Office for Official Publications of the European Communities
2 rue Mercier, L-2985 Luxembourg
ISBN 92-827-8811 -3 Catalogue number: C1 -99-96-996-EN-C
Kogan Page.Earthscan
Table of contents
List of tables vii
List of figures xii
List of abbreviations xiii
Foreword xv
Acknowledgements xvi
1. Introduction 1
2. Analysis of results 3
2.1. Introduction 3
2.2. Business perception of the single market 3
2.2.1. The single market has been successful in removing barriers to trade... 3
2.2.2. ... and is considered by firms to have had some impact on their performance 4
2.2.3. ... but a limited impact on sector performances 5
2.3. Analysis of the effectiveness of the main SMP measures 7
2.3.1. Removal of physical barriers to trade 8
2.3.2. Removal of technical barriers to trade 9
2.4. The SM and the competition level on the domestic market - effects in terms of
costs 12
2.4.1. Increase in the competition level 12
2.4.2. Effects on unit costs 14
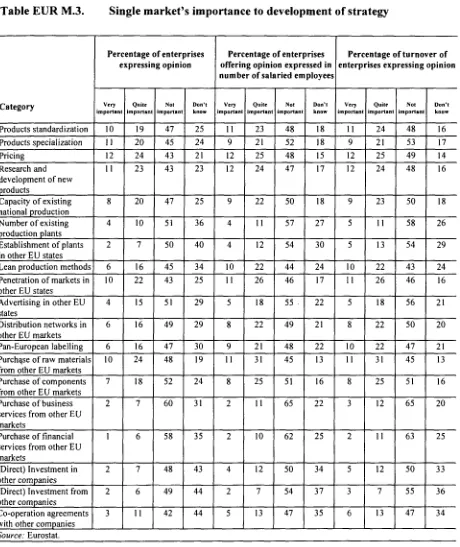
2.5. The impact of the SMP on the enterprises and their business strategy 15
2.5.1. Effects on firms ' operations 15
2.5.2. Importance to the development of enterprises' strategy 17
2.6. Conclusions 19
3. Aggregate results for EUR-12 21
3.1. Manufacturing sectors 21
3.2. Construction sectors 26
3.3. Distributive trade sectors 30
3.4. Other services sectors 32
3.5. Results of open questions 35
4. Unadjusted results item by item 41
4.3. Other services sectors 129
5. Comparison of countries, sectors and size classes 153
5.1. Structure effect and opinion effect 153
5.1.1. Definition 153
5.1.2. Overview of results 153
5.2. Tables 155
6. Multidimensional analysis 159
6.1. Correlations 159
6.2. Correspondence analysis of all characteristics 159
6.3. Cross-tabulation of a selection of characteristics 164
6.4. Multidimensional analysis by block of homogeneous questions (manufacturing) 171
6.4.1. Impact of measures on companies' activities 171
6.4.2. Impact of measures on companies'operations 173
6.4.3. Strategic importance 175
6.4.4. Competition 177
6.5. Costs 179
6.6. Legislation 181
7. Description of the survey 185
7.1. Questionnaire and data collection 186
7.2. Size of the sample and response rate 197
8. Additional survey characteristics 199
8.1. Imputation of non-response and non-response survey 199
8.1.1. Partial imputation 199
8.1.2. Stratification 199
8.1.3. Complementary survey on non-respondents 200
8.1.4. Special investigation on the behaviour of non-respondents 200
8.2. Different types of estimates 201
8.3. Calculation of confidence intervals 202
8.4. Definition of opinion effect and structure effect 231
8.4.1. Definition 231
8.4.2. Mathematical formulation 231
9. General information about businesses in Europe 233
List of tables
Analysis of results:
Table 2.1. The SMP has been successful in eliminating obstacles to EU trade
in your sector
Table 2.2. The SMP has been a success for your firm
Table 2.3. The SMP as it affects your sector, at national and EU levels
Table 3.1. Impact of single market measures on firms in the manufacturing sector
Table 3.2. Impact of single market measures on firms in the services sector
Table 3.3. Impact of single market measures aimed at removing technical barriers
Table 3.4. Impact on firms of the change in VAT procedures for intra-EU sales
Table 4.1. Change in competition level on the domestic market in recent years
Table 4.2. Increase in competition level on the domestic market on the basis of price
in recent years. Percentages
Table 4.3. Impact of the SMP on enterprises' unit costs by size. Manufacturing sector.
Percentages
Table 4.4. Changes in unit costs. Importance of the measures contributing to the
changes. Manufacturing sector. Weighted by number of employees.
Percentages
Table 5.1. The effect of the SMP on enterprises' operations. Manufacturing
and service sectors. Weighted by number of employees. Percentages
Table 5.2. The effect of the SMP on sales to other EU countries. Weighted by number
of employees. Percentages
Table 5.3. The importance of the SMP to the development of the firms' strategy in
recent years. Manufacturing sector. Weighted by number of employees.
Percentages
Table 5.4. The importance of the SMP to the development of the firms' strategy in
recent years. Services sector. Weighted by number of employees.
Percentages
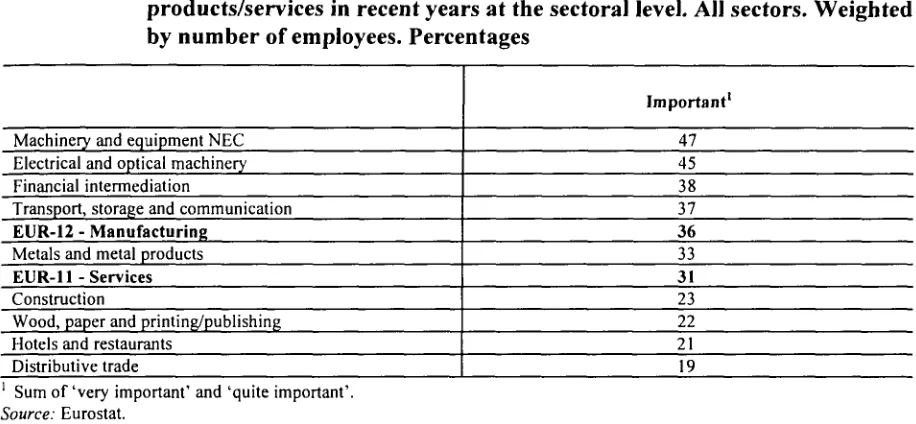
Table 5.5. The importance of the SMP on research and development of new
products/services in recent years at the sectoral level. All sectors.
Weighted by number of employees. Percentages
4
5
6
7
8
9
11
13
13
14
15
16
16
17
18
19
EUR summary
Table EUR M.l.
Table EUR M.2.
Table EUR M.3.
Table EUR M.4.
Table EUR M.5.
Table EUR M.6.
Table EUR M.7.
of manufacturing:
Single market's impact on your firm 21
Single market's impact on your company's operations 22
Single market's importance to development of strategy 23
Any change in competition levels in the domestic market 24
The extent to which the implementation of the SMP has affected
unit costs 24
Importance in changing unit costs 25
Single market legislation as it affects your own firm or sector 25
EUR summary of the construction sector:
Table EUR C. 1. Single market's impact on your firm
Table EUR C.2. Single market's impact on your company's operations
Table EUR C.3. Single market's importance to development of strategy
Table EUR C.4.
Table EUR C.5.
Any change in competition levels in the domestic market
Single market legislation's effect on your firm or sector
EUR summary of the distributive trades:
Table EUR D.I.
Table EUR D.2.
Table EUR D.3.
Table EUR D.4.
Table EUR D.5.
Single market's impact on your firm
Single market's impact on your company's operations
Single market's importance to development of strategy
Any change in competition levels in the domestic market
Single market legislation as it affects your own firm or sector
EUR summary of other services:
Table EUR S.l.
Table EUR S.2.
Table EUR S.3.
Table EUR S.4.
Table EUR S.5.
Single market's impact on your firm
Single market's impact on your company's operations
Single market's importance to development of strategy
Any change in competition levels in the domestic market
Single market legislation as it affects your own firm or sector
28
29
30
30
31
31
32
32
33
33
34
34
Open questions:
Table OQ M. 1. Manufacturing sector: Additional measures needed to create a genuine
single market 36
Table OQ M.2. Manufacturing sector: Additional measures needed to eliminate
obstacles to EU trade 37
Table OQ S.l. Services sector: Additional measures needed to create a genuine
single market 38
Table OQ S.2. Services sector: Additional measures needed to eliminate obstacles
to EU trade 39
Detailed manufacturing:
Single market's impact on your firm:
Table M. 1. Harmonization of technical regulations and/or standards
Table M.2. Mutual recognition of technical regulations and/or standards
Table M.3. Conformity assessment procedures
Table M.4. Simplified patenting procedures
Table M.5. The opening up of public procurement
Table M.6. The elimination of customs documentation
Table M.7. Deregulation of freight transport
Table M.8. The elimination of delays at frontiers
Table M.9. The change in VAT procedures for intra-EU sales
Table M. 10. The liberation of capital movements
Table M. 11. Double-taxation agreements
Single market's impact on your company's operations:
Table M. 12. Sales to the domestic market
Table M. 13. Sales to other EU countries
Table M. 14. Sales to non-EU countries
Table M. 15. Productivity
Table M. 16. Profitability
Table M. 17. Employment
42
43
44
45
46
47
48
49
50
51
52
Single market's importance to development of strategy:
Table M. 18. Product standardization 59
Table M. 19. Product specialization 60
Table M.20. Pricing 61
Table M.21. Research and development of new products 62
Table M.22. Capacity of existing national production 63
Table M.23. Number of existing production plants 64
Table M.24. Establishment of plants in other EU states 65
Table M.25. Lean production methods 66
Table M.26. Penetration of markets in other EU states 67
Table M.27. Advertising in other EU markets 68
Table M.28. Distribution networks in other EU markets 69
Table M.29. Pan-European labelling 70
Table M.30. Purchase of raw materials from other EU markets 71
Table M.31. Purchase of components from other EU markets 72
Table M.32. Purchase of business services from other EU markets 73
Table M.33. Purchase of financial services from other EU markets 74
Table M.34. Direct investment in other companies 75
Table M.35. Direct investment from other companies 76
Table M.36. Co-operation agreements with other companies 77
Any change in competition levels in the domestic market:
Table M.37. Competitors: domestically owned enterprises 78
Table M.38. Competitors: other EU-owned enterprises 79
Table M.39. Competitors: non EU-owned enterprises 80
Table M.40. Price competition: domestically owned enterprises 81
Table M.41. Price competition: other EU- owned enterprises 82
Table M.42. Price competition: non EU-owned enterprises 83
Table M.43. Quality competition: domestically owned enterprises 84
Table M.44. Quality competition: other EU-owned enterprises 85
Table M.45. Quality competition: non-EU-owned enterprises 86
Table M.46.1 The extent to which the implementation of the SMP has affected - Unit
cost of typical or average product (sub table 1) 87
Table M.46.2. The extent to which the implementation of the SMP has affected - Unit
cost of typical or average product (sub table 2) 88
Table M.46.3. The extent to which the implementation of the SMP has affected - Unit
cost of typical or average product (sub table 3) 89
Importance in changing unit costs:
Table M.47. Production process 90
Table M.48. Testing and certification 91
Table M.49. Distribution costs 92
Table M.50. Marketing costs 93
Table M.51. Costs of raw materials 94
Single market legislation as it affects your own firm or sector:
Table M.55. The SMP has been a success for your firm 98
Table M.56. The SMP has been a success for your sector in your country 99
Table M.57. The SMP has been a success for your sector in the EU 100
Table M.58. The SMP has been successful in eliminating obstacles to EU trade in
your sector 101
Table M.59. The SMP has been successful in creating a genuine single market 102
Table M.60. Additional measures are needed to eliminate obstacles to EU trade 103
Table M.61. Additional measures are needed in this sector to create a genuine
single market 104
Detailed distributive trades:
Tables D. 1 -D.7. Single market's impact on your firm 106
Tables D.8.-D. 13. Single market's impact on your company's operations 110
Tables D. 14.-D.27. Single market's importance to the development of strategy 113
Tables D.28.-D.36. Any change in competition levels in the domestic market 120
Tables D.37.-D.43. Single market legislation as it affects your own firm or sector 125
Detailed other services:
Tables S. 1 -S.7. Single market's impact on your firm 130
Tables S.8.-S.13. Single market's impact on your company's operations 134
Tables S.14.-S.27. Single market's importance to the development of strategy 137
Tables S.28.-S.36. Any change in competition levels in the domestic market 144
Tables S.37.-S.43. Single market legislation as it affects your own firm or sector 149
Structure effect and opinion effect:
Table 5.1. Example of opinion effect and structure effect 154
Table 1 M.l. Manufacturing 155
Table ID. 1. Distributive trade 156
Table I S.l. Other services 157
Cross-tabulation of selected characteristics:
Tables CT M.l.a.
to CT M.l.d. Manufacturing 164
Tables CT S.l.a.
toCTS.l.c. Other services 168
Sample size and response rate:
Table 7.1.a. Response rate by sector 197
Table 7.1 .b. Response rate by Member State 198
Non-response rate:
Table 8.1. Average percentage of item non-response 199
Table 8.2. Results of the survey on non-respondents 200
Table 8.3. Estimation of non-response bias 201
EUR Confidence intervals for manufacturing:
Table CI M.3.a.. Single market's importance to development of strategy
(sub table 1) 208
Table CI M 3.b. Single market's importance to development of strategy
(sub table 2) 209
Table CI M.4. Any change in competition in the domestic market 210
Table CI M.5. The extent to which the implementation of the SMP has affected 211
Table CI M. 6. Importance in changing unit costs 214
Table CI M.7. Single market legislation as it affects your own firm or sector 213
EUR Confidence intervals for construction:
Table CI C. 1. Single market's impact on your firm 214
Table CI C.2. Single market's impact on your company's operations 215
Table CIC.3. Single market's importance to development of strategy 216
Table CI C.4. Any change in competition in the domestic market 217
Table CI C.5. Single market legislation as it affects your own firm or sector 218
EUR Confidence intervals for the distributive trade:
Table CI D. 1. Single market's impact on your firm 219
Table CI D.2. Single market's impact on your company's operations 220
Table CI D.3.a. Single market's importance to development of strategy
(sub table 1) 221
Table CI D.3.b. Single market's importance to development of strategy
(sub table 2) 222
Table CI D.4. Any change in competition in the domestic market 223
Table CI D.5. Single market legislation as it affects your own firm or sector 224
EUR Confidence intervals for other services:
Table CI S. 1. Single market's impact on your firm 225
Table CI S.2. Single market's impact on your company's operations 226
Table CI S.3.a. Single market's importance to development of strategy
(sub table 1) 227
Table CI S.3.b. Single market's importance to development of strategy
(sub table 2) 228
Table CI S.4. Any change in competition in the domestic market 229
Table CI S.5. Single market legislation as it affects your own firm or sector 230
General information about businesses in Europe:
Table 9.1. Structure of European manufacturing sector by Member State,
sector and size class (1992) 234
Table 9.2. Structure of European construction sector by Member State and
size class (1992) 235
Table 9.3. Structure of European distributive trade sector by Member State,
sector and size class (1992) 236
Table 9.4. Structure of European other services by Member State, sector and
List of figures
Figure 6.1. Multiple Correspondence Analysis (Manufacturing), Axes 1 & 2 161
Figure 6.2. Multiple Correspondence Analysis (Manufacturing), Axes 1 & 3 162
Figure 6.3. Multiple Correspondence Analysis (Manufacturing), Axes 2 & 3 163
Figure 6.4. Correspondence Analysis (Manufacturing), Impact on firm's activities 172
Figure 6.5. Correspondence Analysis (Manufacturing), Impact on firm's operations 174
Figure 6.6. Correspondence Analysis (Manufacturing), Strategic importance 176
Figure 6.7. Correspondence Analysis (Manufacturing), Changes in competition levels 178
Figure 6.8. Correspondence Analysis (Manufacturing), Importance of costs 180
List of abbreviations
DG15 Directorate-General for the Internal Market and Financial Services (DG XV)
ECU European currency unit
EEC European Economic Community
EU European Union
EUR-12 12 Member States of the European Union before 1 January 1995
Eurostat Statistical Office of the European Communities
NACE General industrial classification of economic activities within the European Communities
NEC Not elsewhere considered
NSI National Statistical Institutes
NUTS Nomenclature of territorial units for statistics (i.e. location by region)
SM Single market
SME Small and medium-sized entreprises (from 10 to 249 employees)
SMP Single market programme
VAT Value added tax (consumption tax)
Note that in the tables of this survey, the 12 Member States of the European
Union (before 1 January 1995) are listed alphabetically using the spelling of
the original language (corresponding names in English in facing column):
België/Belgique
Danmark
Deutschland (BR Deutschland)
Elláda
España
France
Ireland
Italia
Luxembourg
Nederland
Portugal
United Kingdom
Belgium
Denmark
Germany (Federal Republic of Germany)
Greece
Spain
France
(Ireland)
Italy
Luxembourg
Netherlands
Portugal
Foreword
The single market is the backbone of European economic integration and the principal
achievement to date of the European Community. Removal of all remaining non-tariff
barriers, which has been at the very heart of the Union's legislative activity over recent years,
was designed to open up markets to competition, thereby stimulating growth and improving
competitiveness. Despite some delays in the adoption and transposition of the measures, the
bulk of the legislative framework needed to make the single market work is now in place.
The time was therefore ripe to launch this first major survey of European business to assess
the impact of the single market legislation on firms' strategies and operations, as well as their
level of awareness of the opportunities presented by the single market. This exercise, which
has been conducted with the help of the various National Statistical Institutes an some
Economic Institutes, constituted a major input to the overall analysis of the effectiveness of
the measures taken in creating the single market, which has been undertaken by the
Commission in the context of Council Resolution 1218/92. The Single Market Review 1996
has been a major exercise in identifying the strengths and weaknesses of the functioning of the
single market.
The first significant result achieved is the high level of response rate: more than 13,500
enterprises out of a total of some 24,000 replied to the survey (a 56% response rate), which
confirms business interest in the single market. Overall results show that the single market
programme, and in particular measures to remove customs formalities and eliminate delays at
borders, has so far had a positive impact on European business even if a significant percentage
of firms said they had not felt any impact. Although on the whole large firms benefited more
from the single market than small businesses, the latter, which still operate mainly on local or
national markets and are therefore not directly affected by the single market legislation,
nevertheless gave an overall positive assessment of the SMP.
The manufacturing sector has expressed a greater degree of satisfaction vis-à-vis the SMP than
the services sector. This confirms the view that while significant progress has been made in
liberalization of some services sectors, especially traditional services, such as transport and
financial services, barriers are still high in others.
More than three years after the symbolic starting date of 1 January 1993, business, however,
considers that, although the SMP has largely succeeded in removing the main barriers to trade,
it still far from having created a genuine internal market and that additional measures are
therefore needed to achieve this objective. As recognized in the Commission's Confidence
Pact on Employment, the single market is a key component of Europe's strategy to improve its
competitiveness and create jobs. The results of this survey have contributed significantly to
the 1996 Review of the Market and to setting the agenda for the future.
John MOGG
Director-General
Directorate-General for the Internal Market
and Financial Affairs (DG XV)
Yves FRANCHET
Director-General
Statistical Office of
Acknowledgements
This survey has been carried out under the responsibility of:
Photis Nanopoulos, Director of Eurostat-Directorate D 'Business and energy statistics,
research and development, and statistical methods' with Daniel Defays, Head of Unit
Eurostat-D/3 'Research, development and statistical methods', Alexander Spachis, Deputy
Head of Unit DG XV/A/1 'Operation of the internal market and economic analysis', and
Pierre Buigues, Head of Unit DG II/B/3 'Evaluation of competition and research and
development policies; internal market and industrial affairs, coordination of sectoral policies'.
It has been coordinated by Raoul Depoutot with the support of:
in Eurostat (processing of data, preparation of the publication): Mahammad Navid Anwar,
Philippe Arondel, Jean-Yves Bienvenue, Asterios Hatziparadissis, Nicole Lehnertz, Edward
Ojo, Mohamed Radjabou, Marina Van Mechelen;
in DG XV (definition of the scope of the survey, economic analysis of results): Jean-Y ves
Muylle, Patrick Roe, Lorna Windmill;
in DG II: John Sheehy.
In the Member States the national coordinators for data collection, codification and data
capture have been:
Belgium: Jean-Pierre Georges
Denmark: Peter Boegh-Nielsen
Germany: Wolfang Ruppert
Greece: Eleni Kapnissi
Spain: Desiderio Aranda-Martín
France: Vincent Thollon-Pommerol
Ireland: Brendan Whelan
Italy: Piero Taccini
Luxembourg: Victor Moiling, Arthur Tibesar
The Netherlands: Henry Niewenhuijsen, Hans Posthumus
Portugal: Maria Gois
1. Introduction
In December 1992, the Council of Ministers passed a resolution calling for a retrospective
assessment of whether the single market programme (SMP) has achieved its objectives of
removing non-tariff barriers to trade, investment and the free movement of persons in the
European Union (EU). To this end, the European Commission undertook a series of 40
studies looking at progress in implementing the SMP, its effectiveness in removing non-tariff
barriers and its impact in creating a genuine single market and improving economic
performance and benefits for consumers.
Nineteen independent studies of manufacturing and service sectors were undertaken to identify
whether the single market measures under review have led to the disappearance of barriers to
free circulation and to identify any remaining obstacles to cross-border transactions.
Five independent 'barrier studies' aimed to assess progress in dismantling the most important
non-tariff barriers (technical barriers, public procurement, customs and fiscal formalities,
capital controls and industrial property protection).
Fifteen studies examined the economic impact of removing barriers; these studies dealt inter
alia with trade and investment flows, price convergence, competition and competitiveness,
employment and labour costs and economic cohesion.
A survey of 200 European trade associations' perceptions of the effects of the single market,
was co-ordinated in the context of the Commission's 1995/96 Panorama of EU Industry.
Finally, this major business survey looked at the awareness of, and attitudes and reactions to,
the SMP at company level. This exercise was conducted by the National Statistical Institutes,
and other bodies specialized in statistics and economic analysis, and co-ordinated by the
Statistical Office of the European Communities (Eurostat). The survey covered most
manufacturing activities, construction and services. Twenty-four thousand firms, with more
than 20 employees in the manufacturing sector and 5 employees in the services sector, were
asked to rate the success of the SMP and its impact on their strategies and operations. More
than 13,500 enterprises replied to this questionnaire, which represents a 56% response rate.
2. Analysis of results
2.1. Introduction
This major survey was undertaken in the framework of the 1996 review to test the awareness,
attitudes and reactions of European business to the SMP. A questionnaire was sent to
approximately 24,000 enterprises in 12 Member States, asking them to rate the success of the
single market in a number of areas, and its impact on their strategies and operations. Some
13,500 replies were received (a 56% response rate).
The survey was conducted mainly in the first half of 1995, i.e. at a time when some directives,
in particular in the services sector, had just entered into force, thereby imposing a limit on the
impact assessment. Moreover, only 11 Member States conducted a survey in the services
sectors (EUR-12 minus Germany) and in the construction sector (EUR-12 minus Greece).
The questionnaire covered a broad range of issues, such as the impact of the transitional VAT
regime, the impact of the single market on marketing and distribution, the change experienced
in competition on the basis of price or quality and the single market impact on banking and
insurance costs. It was therefore designed to be answered by company executives with a
horizontal view on their companies' operations.
This analysis serves as an introduction to the following more detailed results of the survey
presented in the next chapters. While only a limited number of references will be made to
concrete figures and tables, this chapter aims to provide an analysis of the results achieved
and attempts, wherever possible, to explain them.
2.2. Business perception of the single market
2.2.1. The single market has been successful in removing barriers to trade...
European businesses largely agree that the SMP has achieved its main objective, i.e. to remove
obstacles to trade and create a barrier-free market. In particular, manufacturing firms, which
previously had to operate in fragmented markets, given the co-existence of many physical and
technical barriers to trade, perceived much more of an SMP effect in removing barriers than
other sectors. Some 41% of manufacturing companies consider that obstacles to EU trade
have been eliminated in their sector. Only 22% of companies consider that the SMP had been
a success in removing barriers in the services sector, where physical obstacles were somewhat
less present than in the manufacturing sector. However, the percentage of firms considering
that the SMP had failed to remove barriers does not substantially differ between
manufacturing and services and ranges from 17% to 22% (size-weighted results
1)·
Firms in sectors which were previously quite heavily regulated and suffered from market
fragmentation, like food and drink and electrical machinery, have been more sensitive to the
removal of trade barriers, while firms in the wood and paper, transport equipment,
non-metallic and mineral products industries were more cautious in their assessment.
1 Salaried employees working in firms having responded expressed as a percentage of the total number of employees
Transport services have also been fairly positive, although 50% of transport companies
responded they had no opinion on the issue. This is not so surprising, given the small share of
international transport in total demand and the dominance of the sector by very small
companies. Distribution expressed an overall positive assessment with twice as many firms
agreeing as disagreeing that the SMP had removed barriers. The fact that the distribution
sector is still largely operating on a regional/national basis may help to explain the very high
rates of firms having no opinion on the matter.
Table 2.1. The SMP has been successful in eliminating obstacles to EU trade in your
sector
Classification
MANUFACTURING
Agree
41
No opinion
39
Disagree
20
of which
Electrical and optical machinery Food, beverages and tobacco Machinery and equipment NEC Chemicals, rubber and plastics Wood, paper and printing/publishing Transport equipment
CONSTRUCTION DISTRIBUTIVE TRADE
51 46 43 41 33 31 24 27
30 36 35 39 48 38 56 59
19 18 21 20 19 30 19 14
of which
Wholesaling and motor vehicles Retail trade
SERVICES
29 25 22
54 63 65
17 11 13
of which
Transport, storage and communication Financial intermediation
37 29
50 53
13 18
Source: Eurostat.
Manufacturing firms in the southern countries and Ireland, with positive opinions equal to or
in excess of, 50%, are much more positive in their assessment of the SMP's impact, while
firms established in Belgium, the Netherlands and the UK, especially small firms, appeared
mainly indifferent on the matter. This apparent dichotomy between peripheral Member States
and the core regions is mirrored by the results of the effectiveness of measures aimed at
abolishing customs formalities and simplifying VAT operations (see Section 2.3). Individual
country results are somewhat similar in the services sector, except for Portugal, which has a
much less positive attitude, and for Luxembourg, which has much more positive assessment;
this can probably be explained by the overall positive opinion expressed by financial services
firms.
2.2.2. ... and is considered by firms to have had some impact on their performance
[image:22.595.76.536.224.475.2]Italian and Irish companies, and Greek and Spanish large firms in the manufacturing sectors,
are very positive, with 50 to 65% of firms, expressed in terms of employees, having perceived
a successful impact from the SMP on their operations. A majority of Italian and Greek firms in
the services sector express the same opinion. On the other hand, Portuguese firms display
overall negative results as regards the SMP's impact on their operations. Firms in Belgium
and the Netherlands, which have long been very open economies, did not notice any
significant impact of the SMP (between 60 and 70% of firms having no opinion, depending on
the sector).
A general trend in the responses is that large and very large firms have felt the SMP impact
more positively, both in the manufacturing and services sectors (with respectively 46 and 35%
of firms with more than 1,000 employees agreeing that the SMP had been a success for them).
The impact on SMEs, however, is less pronounced but, nevertheless, still quite positive in the
manufacturing sector. This could be explained by the high number of SMEs not yet involved
in cross-border operations, for which single market measures are not particularly relevant.
The transport equipment sector illustrates this discrepancy between small and large firms:
while only 27% of firms have felt a positive SMP impact (with 52% having no opinion), this
percentage increases to 47% when expressed in number of employees (with only 28% having
no opinion).
Table 2.2. The SMP has been a success for your firm
Size class
20-49 50-199 200-499 500-999 >1,000 EUR-12
Manufacturing
Agree
30 36 40 38 46 33
No opinion
42 37 35 38 31 40
sector
Disagree
28 27 25 24 23 27
Service sector
Agree
16 18 17 21 35 16
No opinion
63 61 61 54 46 63
Disagree
21 21 22 25 19 21
Distributive trade
Agree
18 26 26 20 26 18
No opinion
59 49 51 50 60 58
Disagree
23 25 24 30 14 23
Source: Eurostat.
Firms, in particular large firms from high-tech industries, such as the chemical, equipment and
machinery and electrical industry, have mostly benefited from the SMP, and more specifically
from technical harmonization and mutual recognition measures. An overall negative
assessment of the impact of the SMP on firms' activities seems to prevail in the wood and
paper, construction and distributive trade sectors. This could be explained by the lack of
specific measures for these sectors, on which the impact of the SMP has been much more
indirect than direct, and therefore of a less visible nature than for other sectors, such as
'high-tech' industries.
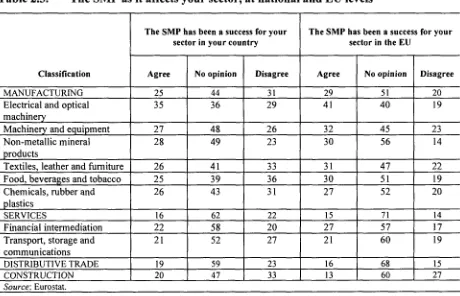
2.2.3. ... but a limited impact on sector performances
negative. Manufacturing firms consider, however, that the SMP has been rather successful
for their sector at European level, while the services sector has a more balanced view.
Looking at sectors' reactions, one can clearly distinguish between sectors with strong
internationalization and sectors more traditionally anchored at regional and national levels.
Manufacturing firms consider that the SMP has been more successful for their sector at EU
than at national level, while in the services sector, firms consider that the SMP has been
equally successful for their sectors at national and EU levels. Most of the firms in the
electrical machinery and equipment sectors are convinced the SMP has been beneficial for
their sector (at EU and national levels), which confirms the sectoral analysis made in Section
2.2. In the services sector, firms in the financial intermediation and transport sectors also
acknowledge beneficial effects on their sectors, although they do not make much distinction
between the national and EU levels.
Table 2.3. The SMP as it affects your sector, at national and EU levels
Classification MANUFACTURING Electrical and optical machinery
Machinery and equipment Non-metallic mineral products
Textiles, leather and furniture Food, beverages and tobacco Chemicals, rubber and plastics
SERVICES
Financial intermediation Transport, storage and communications DISTRIBUTIVE TRADE CONSTRUCTION
The SMP has been a success for your sector in your country
Agree 25 35 27 28 26 25 26 16 22 21 19 20
No opinion 44 36 48 49 41 39 43 62 58 52 59 47
Disagree 31 29 26 23 33 36 31 22 20 27 23 33
The SMP has been a success for your sector in the EU
Agree 29 41 32 30 31 30 27 15 27 21 16 13
No opinion 51 40 45 56 47 51 52 71 57 60 68 60
Disagree 20 19 23 14 22 19 20 14 17 19 15 27
Source: Eurostat.
[image:24.595.81.541.289.585.2]2.3. Analysis of the effectiveness of the main SMP measures
Individual SMP measures seem to have had an overall positive impact on European firms in
all sectors, even though in most cases a high percentage of firms was unable to assess the
impact or identify the measures concerned. In general, more firms perceive a positive impact
from individual measures (ranging from 10 to 60%) than a negative one (ranging from 1.5 to
9.3%). Italy, Greece and, to a lesser extent, Ireland are more positive in their assessment,
while the Benelux countries, which have been very open economies for decades, notice a less
positive impact. British firms seem to have been rather indifferent, with very high rates of
'neutral' responses, which in some cases can be explained by the relatively high levels of
market liberalization already achieved there.
Very large companies perceive the positive consequences of the SMP more keenly than
smaller firms. This is also confirmed by the higher size-weighted results achieved. Sectors
which benefited from measures more specifically tailored to their own needs, like most of the
'non-traditional' manufacturing sectors and transport services, experience more impact, while
other services and distributive trade were affected more indirectly and therefore in a less
tangible way. In the manufacturing sector, a general feature is that sectors with a high
technological content, such as chemicals, electronics and machinery have been more affected
by SMP measures, either in a positive or negative way, while sectors with a lower
technological content were less affected (wood and paper, textiles) or had no opinion
(non-metallic industries).
In order to assess the effectiveness of the SMP, a careful look should be taken at the impact of
individual measures designed to deal with the removal of barriers within the single market.
Measures aimed at removing physical barriers to trade had a positive impact for a very
significant number of enterprises, as did measures aimed at technical harmonization and
mutual recognition, deregulation of freight transport for the manufacturing sector, and
liberalization of capital movement for the services sector.
Table 3.1. Impact of single market measures on firms in the manufacturing sector
Category of measures
The elimination of customs documentation The elimination of delays at frontiers Deregulation of freight transport Harmonization of technical regulations/standards
The change in VAT procedures for intra-EU sales
Percentage of enterprises expressing opinion
Positive impact
60 56 43 31
32
No impact
30 35 43 51
41
Negative impact
5 2 3 9
15
Don't know
5 7 12
9 11
Table 3.2. Impact of single market measures on firms in the services sector
Category of measures
Measures to facilitate cross-border operations into other EU states Liberalization of capital movements Recognition of licences/authorizations in other EU states
Measures to facilitate physical establishment in other EU states
Percentage of firms
Positive impact
22
16 12
9
No impact
65
72 72
77
expressing opinion
Negative impact
3
1 4
1
Don't know
10 10 13 13
Source: Eurostat.
2.3.1. Removal of physical barriers to trade
This covers measures aimed at eliminating customs documentation and delays at the frontiers,
which mainly affect the manufacturing sector, as well as measures aimed at facilitating
cross-border operations and physical establishment for the services sector. It should not come
as a surprise that these measures have had a positive impact on a very significant number of
enterprises. Indeed, some 60% of manufacturing enterprises experienced a positive impact
from the elimination of customs documentation, while only 5% were negatively affected.
Comparable figures exist for the elimination of delays at borders. Most of the firms in
peripheral countries (Ireland, Greece and Denmark) benefited from the elimination of customs
procedures, while Luxembourg experienced a surprisingly high percentage of firms having
been negatively affected by this removal (which probably represents customs agents and other
intermediaries). UK companies remain largely indifferent to the removal of physical barriers
to trade; around 55% of them declared elimination of delays and formalities had had no impact
whatsoever on their activities.
Large firms, which are usually most inconvenienced by export formalities, reacted very
positively to these measures, whereas smaller firms were less keen to report a positive impact.
This tendency appears in all Member States, with size-weighted results always outweighing
unweighted results. These measures also seem to be universally appreciated across sectors,
with the non-metallic and mineral products industry having been the least sensitive to the
removal of physical barriers.
In the services sector, measures designed to facilitate cross-border operations were also the
most positively perceived by enterprises, especially by the transport services sector and the
wholesale business. However, more than half of the firms acknowledged that these measures
had had no impact on them. A majority of Greek and Spanish firms felt a positive impact,
while very few Danish and UK firms did. A significant number of French and Luxembourg
firms even felt some negative impact from measures aimed at facilitating cross-border
operations in the distributive trade sector.
intermediation sector, also experienced a much more positive impact than small firms.
However, almost no company reported having been negatively affected by such measures.
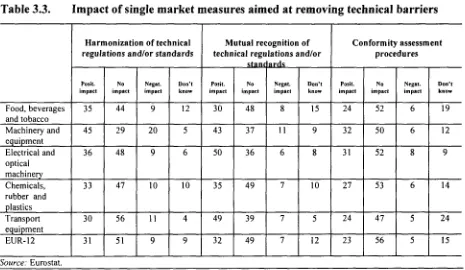
2.3.2. Removal of technical barriers to trade
This covers measures aimed at harmonizing technical regulations/standards (manufacturing)
and licensing/authorization requirements (services), mutual recognition of technical
regulations/standards and of licences/authorizations in other EU states (services), conformity
assessment procedures and simplified patenting procedures (manufacturing).
Technical harmonization measures and mutual recognition had an overall positive impact on
manufacturing enterprises; almost four times as many companies were positively affected than
negatively. The application of the mutual recognition principle is rated more highly than EU
efforts to eliminate technical barriers through legislative harmonization.
[image:27.595.66.531.380.650.2]High-tech industries, such as the chemical, machinery and electrical machinery sectors,
experienced a much more positive impact (even though a significant number of machinery and
equipment firms felt a negative impact from these procedures, which can be partly explained
by high, transitional costs of compliance with technical standards or regulations). Overall,
sectors did not notice any major difference in the effectiveness of harmonization measures and
mutual recognition, for which results are almost equal.
Table 3.3.
Food, beverages and tobacco Machinery and equipment Electrical and optical machinery Chemicals, rubber and plastics Transport equipment EUR-12
Impact of single market measures aimed at removing technical barriers
Harmonization of technical regulations and/or standards
Posit, impact
35 45 36
33
30 31
No impact
44 29 48
47
56 51
Nfgat. impact
9
20
9
10
11
9
Don't know
12 5 6
10
4 9
Mutual ree technical regu stanr
Posit, impact
30 43 50
35
49 32
No impact
48
37
36
49
39
49
ognition of lations and/or ards
Ncgat. impact
8
11
6
7
7
7
Don't know
15 9 8
10
5 12
Conformity assessment procedures
Posit, impact
24
32
31
27
24
23
No impact
52 50 52
53
47 56
Ncgat. impact
6 6 8
6
5 5
Don't know
19
12
9
14
24
15
Source: Eurostat.
Conformity assessment procedures appeared to have been less important for companies, more
than half considering that they had no impact on them. The positive impact, which
significantly predominates among companies having an opinion, is more apparent in high-tech
sectors and in Mediterranean countries, with the exception of Greece where 36% of firms did
not know the impact that conformity assessment procedures may have had on them (15% at
EU average).
Globally speaking, the same considerations apply when looking at the effect of simplified
patenting procedures, with 85% of firms being indifferent on this issue. This very high rate
may be partly due to the high proportion of SMEs in the sample, because size-weighted results
tend to be much more positive than unweighted results, particularly in the chemical (34%),
transport (32%) and machinery equipment (30%) sectors, for which protection of intellectual
property rights is of greater strategic importance. This major divergence between the views of
small and large companies (9% versus 36% of companies having felt a positive impact) can be
explained by the very small proportion of small businesses concerned with obtaining EU-wide
protection of patents and trademarks.
Around 80% of firms in the services sector had no strong feeling about the impact of
harmonization or recognition of licensing/authorization requirements, because an important
proportion of them were not directly affected by these measures. As expected, however, the
net balance was more positive for the transport and financial intermediation sectors.
Moreover, while in most countries the net impact appears to have been positive, Italian firms
in the services sector appear to have been negatively affected by the harmonization of
licensing/authorization requirements. This may be explained by the overall negative
assessment from the hotel and restaurant sectors.
Removal of fiscal barriers
Changes in VAT procedures and measures designed to get rid of some forms of double
taxation are considered here.
The transitional VAT system has given rise to quite controversial reactions since its
implementation in 1993. While twice as many companies agreed that it had had a more
positive impact than a negative one, 41% considered it had had no impact at all. While there
is no major differentiation of the results across sectors, results vary quite substantially across
countries with Greek, Irish, Danish and the large Portuguese companies much more positive
about it, while large companies in France, Germany and the Netherlands were more critical.
Table 3.4. Impact on firms of the change in VAT procedures for intra-EU sales
20-49 50-199 200-499 500-999 > 1,000 EUR-12
Percentage of firms expressing opinion
Positive impact
32 33 35 29 30 32
No impact
44 39 35 35 33 41
Negative impact
12 20 21 28 23 15
Don't know
13 8 8 8 14 11
Source: Eurostat.
The few provisions aimed at tackling double taxation problems appear to have had an overall
positive impact, even though between 80 and 90% of responding firms adopted a 'neutral'
position in this respect. This can be explained by the fact that only companies having
subsidiaries or permanent establishments in other EU Member States were affected by these
measures. The impact has therefore been much greater for large companies, which quite often
have subsidiaries in other Member States and are therefore much more affected by the
directives adopted at EU level. The financial intermediation sector, and the chemical and
mineral products sectors, with a strong proportion of multinationals, have also been more
positively affected.
Flanking measures
These include measures to liberalize capital movements, open up public procurement and to
liberalize of freight transport.
The liberalization of freight transport was the most successful measure as it had a positive
impact on some 43% of European manufacturing firms, with a peak of 69% of firms in the
two most peripheral countries, Greece and Ireland. Countries located in the inner core of the
Union were much less affected by this liberalization, while firms in the periphery benefited
much more from it, for obvious reasons. 'Heavy' sectors, for which transport costs are an
important component, were also much more receptive to the gains from freight transport
liberalization, as were very large companies, with 57% of them having been positively
affected.
Liberalization of capital movements had a strong, positive impact on firms in Greece, Spain
and Italy (except for the distributive trades in Italy) which all had severe restrictions to capital
movements before the SMP was put in place, while a substantial negative impact was
perceived almost nowhere. The financial intermediation sector benefited quite substantially
with 49% of firms (size-weighted results) having felt a positive impact, while the property and
business activities were largely not affected (77% experienced no impact). No significant
impact has been noticed on the distributive trades sector, except in Greece where liberalization
measures had a positive impact for 55% of firms.
Dutch manufacturing and Luxembourg services companies had mostly perceived a negative
impact. The construction sector, which is quite affected by these measures, recorded a mostly
negative impact, while other sectors recorded a fairly positive net impact. This relative failure
seems to be the main reason for the overall negative assessment of firms as to the overall
impact of the SMP because 67% and 76% of them disagreed that the SMP had been a success
for them and their national sector respectively.
2.4. The SM and the competition level on the domestic market - effects in terms of costs
Through the elimination of trade barriers and the creation of a larger single market, one goal of
the SMP was to stimulate competition and encourage enterprises to lower their production
costs. A first section will provide evidence, on the basis of the survey, of an increase in the EU
competition level. A second section will emphasize how the SMP has impacted upon
European enterprises' average unit costs.
2.4.1. Increase in the competition level
One of the most visible consequences of the single market has been a marked increase in the
competition level in recent years, especially from domestic and other EU firms. This was most
apparent on the basis of price.
Firms in the manufacturing sector have been more confronted to increased competitive
pressures than firms in the services sector. In the manufacturing sector, the single market has
mainly led to an overall increase in the number of competitors from other EU Member States.
Small businesses, in particular, faced increased price competition from national competitors,
while large firms faced it from other European firms; increased competition from
non-European firms was mainly experienced by large companies.
Table 4.1. Change in competition level on the domestic market in recent years
Classification
No. of competitors
Domestic firms Other EU-owned firms Non-EU-owned firms
Price-competition
Domestic firms Other EU-owned firms Non-EU-owned firms
Quality competition
Domestic firms Other EU-owned firms Non-EU-owned firms
Manufacturing
Increase
25 39 25
44 41 29
33 29 18
No change
64 59 74
51 55 67
64 69 79
Decrease
11 2 2
42 4 4
3 2 3
Services
Increase
30 21 9
37 16 9
27 14 8
No change
63 77 88
60 81 87
69 83 89
Decrease
7 2 2 3 3 3
4
3 3
Source: Eurostat.
Firms in the transport equipment, and food and beverages sectors have been subjected to an
overall increase in competition from national and other EU firms, while firms producing
non-metallic mineral products apparently did not face a significant increase in competition. The
electrical and machinery and textile sectors also faced quite a significant increase in
competition from non-EU firms. In services, the financial intermediation sector reported well
above average perception of increased competition from other EU Member States, while
transport services and property and business activity experienced increased competition from
domestic competitors.
Table 4.2. Increase in competition level on the domestic market on the basis of price
in recent years. Percentages
Classification
Manufacturing
EUR-12
Food, beverages and tobacco Transport equipment Textiles, leather and furniture Electrical and optical machinery Non-metallic mineral products
Services
EUR-11
Financial intermediation Transport
Distribution
Property and business activities
Domestic enterprise
44 54 50 43 37 44
37 6 42 38 43
Other EU enterprises
41 45 51 36 40 32
16 26 29 29 17
Non-EU enterprises
29 20 32 35 43 16
9 34 15
11 11
[image:31.595.67.528.80.300.2] [image:31.595.66.526.461.730.2]The increasingly competitive environment, which resulted from the SMP, has been mainly felt
by firms from peripheral countries. In particular, Irish, Spanish and Greek enterprises across
sectors noticed the most significant increase in competition from domestic and other EU
competitors. German and French manufacturing enterprises were most exposed to an increase
in competition from non-EU enterprises due to the SMP. Overall results also point to the
relatively low Italian and UK business perceptions of increased competition.
2.4.2. Effects on unit costs
Only the manufacturing sector was questioned on the SMP's effects on average unit costs. The
majority of manufacturing firms perceive the implementation of the SMP as not having
affected their unit costs. However, size-weighted results indicate that when businesses felt an
impact, average unit cost decreases prevailed over cost increases. This is even more the case
the larger the companies are, therefore suggesting that large firms benefited most from
economies of scale to reduce their costs.
The transport equipment industry and the electrical and optical machinery sectors experienced
significant unit cost decreases while most of the other sectors experienced around average cost
decreases. Firms, especially small ones, in the machinery and equipment sectors, experienced
surprisingly high average cost increases, which could be explained by high one-off costs to
comply with the requirements imposed by the new technical harmonization measures.
Greek and Irish firms reported above average decreasing unit costs. On the other hand, one
among four Spanish and Italian firms experienced unit cost increases. The results indicate that
larger firms perceive a reduction in unit costs more frequently than smaller firms. The survey
also suggests that the smallest firms (20 to 49 employees) have seen more of an increase in
their average unit costs than a decrease.
Table 4.3. Impact of the SMP on enterprises' unit costs by size. Manufacturing
sector. Percentages
EUR-12
More than 1,000 employees
200 to 499 employees
500 to 999 employees
50 to 199 employees
20 to 49 employees
Decrease
15
26
21
22
16
12
No change
53
55
53
57
56
51
Increase
14
7
8
9
13
17
[image:32.595.83.543.488.761.2]The survey suggests that, where changes in unit costs have taken place, they were mainly due
to decreasing costs of raw materials, more efficient production processes and reduced
distribution costs. This is because these factors are major determinants of average unit costs
and moreover were directly influenced by the abolition of physical border controls which has
had the greatest impact on manufacturing firms. Banking and insurance costs have, where
applicable, contributed least to changing firms' unit costs.
Table 4.4. Changes in unit costs. Importance of the measures contributing to the
changes. Manufacturing sector. Weighted by number of employees.
Percentages
Costs of raw materials Production process Distribution costs Testing and certification Marketing costs Banking costs Insurance costs Other cost sources
Important1
30 24 24 21 16 14 11 5
Little or no importance
26 32 32 35 40 42 45 28
Don't know
44 44 44 44 44 44 44 67
1 Sum of 'very important' and 'quite important'. Source: Eurostat.