B
UDGET
P
ERSPECTIVES
2007
Tim Callan (ed.)
Alan Barrett, Kieran Coleman,
Liam Delaney, Tony Fahey,
Brenda Gannon, Ide Kearney,
Yvonne McCarthy, Brian Nolan,
John Walsh
Copies of this paper may be obtained from The Economic and Social Research Institute (Limited Company No. 18269). Registered Office: 4 Burlington Road, Dublin 4.
www.esri.ie
Price €15.00
Tim Callan, Tony Fahey and Brian Nolan are Research Professors at The Economic and Social Research Institute (ESRI). Alan Barrett is a Senior Research Officer, Yvonne McCarthy and John Walsh are Research Analysts, Kieran Coleman is a Research Assistant and Ide Kearney is a Research Associate with the ESRI. Liam Delaney is a Senior Researcher at UCD Geary Institute. Brenda Gannon is a Senior Research Officer at the Irish Centre for Social Gerontology (ICSG), J.E. Cairnes Graduate School of Business and Public Policy, National University of Ireland, Galway.
B
UDGET
P
ERSPECTIVES
2007
Tim Callan (ed.)
Alan Barrett, Kieran Coleman,
Liam Delaney, Tony Fahey,
Brenda Gannon, Ide Kearney,
Yvonne McCarthy, Brian Nolan,
John Walsh
© THE ECONOMIC AND SOCIAL RESEARCH INSTITUTE
DUBLIN, 2006
The papers included here have benefited substantially from comments and suggestions offered by ESRI staff, FFS members and by the Director, Brendan Whelan. We are very grateful to our colleagues for their valuable input in this regard.
Page
Acknowledgements iv
OPENING ADDRESS
Brendan Whelan 1
Chapter
1. DISABILITY BENEFIT – CONTROLLED OR UNDER-CONTROLLED?
Brenda Gannon 3
2. CHILD POVERTY AND CHILD INCOME SUPPORTS: IRELAND IN COMPARATIVE PERSPECTIVE
Tim Callan, Kieran Coleman, Brian Nolan and John Walsh 23
3. STATE FINANCIAL SUPPORT FOR HORSE RACING IN IRELAND
O
PENING
A
DDRESS
Brendan Whelan
W
ELCOMEOn behalf of the co-hosts, the Economic and Social Research Institute and the Foundation for Fiscal Studies, I would like to wish you all a warm welcome to this year’s Budget Perspectives Conference. These conferences, which have been running since 1998, continue to attract a large attendance and have provided a very useful forum in which the context surrounding the budget can be analysed and debated. As usual, I should begin by reminding everyone that the views expressed are strictly those of the individual authors; neither the ESRI nor the FFS takes corporate or institutional positions in relation to any of the issues raised.
I
n the first presentation, Alan Barrett, Ide Kearney and Yvonne McCarthy will present the macroeconomic context for the Budget, drawing on the forecasts and analysis of the latest Quarterly EconomicCommentary. They will show that the immediate prospects for the
Irish economy continue to be positive, with growth in both 2006 and 2007 projected to remain around its long-run potential rate of about 5 per cent. As a result, expansion in employment is expected to continue and tax revenues to stay buoyant. The authors also highlight a number of serious threats and uncertainties, including the global imbalances in the world economy, which may unwind to Ireland’s disadvantage, the heavy dependence of growth on domestic activity, especially in the construction sector, and the on-going volatility of energy prices. However, on the whole the analysis suggests that the Minister will have some scope for flexibility in the Budget while staying within the bounds of fiscal prudence.
The Overall
Economic
Situation
O
ur second presentation, by Brendan Gannon of NUI Galway, will examine the growth of disability payments in Ireland. The key question she addresses is whether the extent of disability has actually increased or whether mis-reporting of disability has been spurred by increased generosity of, or accessibility to, disability payments. This question is important for a number of reasons, including for the assessment of efficiency in public expenditure andDisability and
Disability Benefit
because of the distortions which may be introduced into incentives for labour market participation. The author sets Ireland in an international context, analyses the available evidence and draws conclusions for policy.
T
he next paper, by Tim Callan, Kieran Coleman, Brian Nolan and John Walsh assesses the extent of child poverty in Ireland in an international context. They find that countries which have reduced child poverty to the lowest levels internationally tend to have a strong welfare state supporting the incomes of all citizens, adults and children. Analysis of a potential “second-tier” payment in the Irish context shows that it is possible to achieve some reductions in child poverty through targeted child income supports. However, the countries with the strongest focus on such targeted measures still have rates of child income poverty which remain quite high by international standards.Child Poverty and
Child Income
I
n the final paper, Tony Fahey of the ESRI and Liam Delaney of UCD’s Geary Institute examine the history and nature of state support for the horse-racing industry, which currently amounts to about €55 million per annum. They show that up to 2001 this support was wholly financed by a tax on off-course betting but that subsequent reductions in the rates of tax mean that it is now partly financed from general taxation. This pattern of state support for the horse-racing industry is due for re-consideration in 2008. The authors identify the background factors influencing the industry and examine the issues which such re-consideration will raise.State Support for
Horse Racing
W
e have tried to plan the morning so that there will be time for a short period of discussion after each paper as well as a general panel session at the end. I hope that the now well established tradition of lively participation in these exchanges will continue.D
ISABILITY
B
ENEFIT
:
C
ONTROLLED OR
U
NDER
-CONTROLLED
?
Brenda Gannon
∗I
n recent decades, as many economies endeavoured to reduce the numbers unemployed there was a notable increase in the receipt of social welfare disability payments. While the case of the Netherlands is an outstanding example of this trend, Ireland, among other countries, is no exception – official statistics show a steady rise in the number of applicants and recipients for disability payments over the late 1990s. The credibility of some of these recipients has been questioned (Public Accounts Committee (PAC), 2006). The core question addressed in this paper is if in fact the incidence of true disability has increased, or has mis-reporting of disability been spurred on by a perception of generous and easily accessible disability payments? The paper will also address the incentives for older workers to mis-report – this is of particular policy relevance, given the changing demographics of our society and the increasing focus on alleviating labour supply deficiencies via the employment of older workers. Expenditure on illness and disability amounted to approximately 14 per cent of total social welfare spending in 2004, over 1 per cent of GDP, so evidence of overpayments of disability welfare has some small but important budgetary implications. In many countries expenditure on disability payments reflects the rate of disability – the crucial question is does this high expenditure lead to mis-reporting of disability? If so, reporting behaviour and greater control of disability payments is an important concern to policy makers.1.
Introduction
One of the main reasons for mis-reporting is the influence of economic incentive. If individuals think they could receive generous disability payments while out of work, they may be inclined to report
3 ∗
a disability. In times of high employment levels, this could possibly increase their chances of receiving social welfare. Within the economic literature, this is known as endogeneity of reported disability whereby individuals may mis-report the extent of a disability in order to rationalise labour force non-participation. If labour force groups behave in different ways depending on the financial incentives involved, this results in ‘systematic differential reporting’. Two groups likely to report systematically different to the employed, are the disabled/ill and retired.
To examine the extent of mis-reporting of disability would require either an in-depth case study that monitors disability payment recipients, or a large scale econometric study that compares subjective reported disability to more objective measures of disability. Both of these methods have been used in the Netherlands and results indicate that there is a significant level of mis-reporting, and that this may be reduced by intensive monitoring of recipients. In the US and Spain, the main focus has been on comparing subjective and objective measures either by using administrative data or household survey data. Until recently in Ireland, there has been no research on the extent of mis-reporting. However, new evidence from a Public Accounts Committee report shows that there are in fact overpayments within the disability benefit schemes (2006). This small case study is supported by results from a more advanced econometric analysis that compares subjective and objective disability, (Gannon, 2006). The focus in this paper, therefore, is to review the results from these two studies and to discuss these in an international comparative context.
The structure of the remainder of this paper is as follows. Section 2 provides background data on disability prevalence and expenditure in the OECD, and potential reasons for mis-reporting in the context of the Irish labour market. Section 3 gives an overview of disability schemes in Ireland and the changing number of recipients over the years 1995-2004. Evidence on mis-reporting in Ireland is given in Section 4. Results from International studies are compared in Section 5. Implications for policy in Ireland are discussed in Section 6. Conclusions are presented in Section 7.
2.1
PREVALENCE OF DISABILITY IN OECD COUNTRIES2.
allow them to partake in mainstream social activities. Such individuals were seen as inadequate and society did not accommodate them in ways to allow them to be actively included in daily societal activities. On the other hand, the social theory of disability stresses the discriminatory barriers in society whereby modifications should be made to include and accommodate the needs of all individuals. Disability is, therefore, an outcome of social attitudes/structures and the interaction between the person and environmental factors.
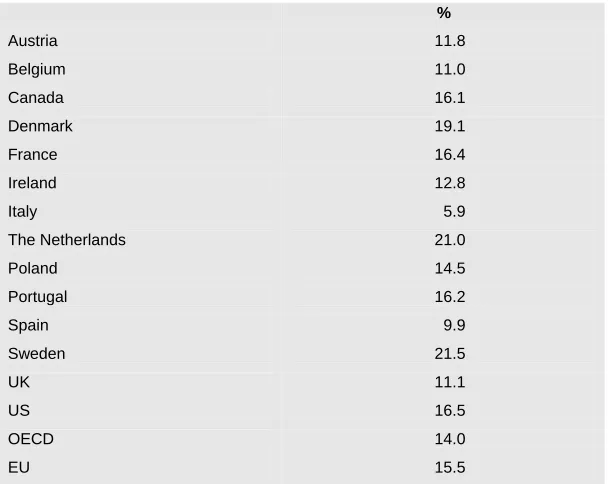
The OECD have well recognised the limitations in comparing disability rates between member countries, but have successfully presented an overview of disability prevalence in the 1990s (OECD, 2003). The OECD report used ECHP data from 1997 (see OECD, 2003, Table 3.1), so in this paper we will update this information using the most recently available ECHP data from 2001. The definition employed in the OECD report aimed to address the World Health Organisation classification of disability, i.e. functional limitation or disability caused by a chronic illness or long-term impairment. To this end, responses to the self-reported question from the ECHP served as a useful starting point in European comparisons of disability prevalence. All individual respondents to the survey, aged 16 years and over, were asked “do you have any chronic physical or mental health problem, illness or disability?” and if so, “are you hampered in your daily activities by this chronic physical or mental health problem, illness or disability?” Individuals had a choice of three responses to this question, (1) “yes, severely” (2) “yes, to some extent” or (3) “no, not at all”. Table 1 presents the rate of disability for European countries, calculated from the responses severely or to some extent limited in daily activities. It presents rates for the age group 20-64 years to facilitate comparisons with other non-European countries, (see OECD, 2003). In over half of these countries, the rate of disability is greater than the European or OECD average. In particular, the rates in Sweden and the Netherlands are very high, compared to lower rates in more southern countries such as Spain or Portugal. The rate for Ireland is closer to the average. This table highlights the variation in disability rates across countries. Although, cross-country comparisons may be affected by survey design or definition of variables, we would not expect this to be a huge problem for the European countries in Table 1. Consequently, it leaves us to wonder if in fact differences across countries reflect variation in the disability welfare system.1
Table 1: Prevalence of Disability, Age 20-64 Years
%
Austria 11.8
Belgium 11.0
Canada 16.1
Denmark 19.1
France 16.4
Ireland 12.8
Italy 5.9
The Netherlands 21.0
Poland 14.5
Portugal 16.2
Spain 9.9
Sweden 21.5
UK 11.1
US 16.5
OECD 14.0
EU 15.5
Source: ECHP 2001 except for Canada (1998/1999), Poland (2000), US (1999).
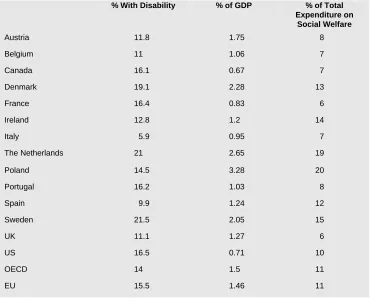
Table 2: Disability Prevalence and Expenditure on Disability
% With Disability % of GDP % of Total Expenditure on
Social Welfare
Austria 11.8 1.75 8
Belgium 11 1.06 7
Canada 16.1 0.67 7
Denmark 19.1 2.28 13
France 16.4 0.83 6
Ireland 12.8 1.2 14
Italy 5.9 0.95 7
The Netherlands 21 2.65 19
Poland 14.5 3.28 20
Portugal 16.2 1.03 8
Spain 9.9 1.24 12
Sweden 21.5 2.05 15
UK 11.1 1.27 6
US 16.5 0.71 10
OECD 14 1.5 11
EU 15.5 1.46 11
The expenditure figures mirror the extent of disability across countries – countries with high expenditure have higher levels of disability. The direction of causation of this relationship is of crucial relevance to policy makers – preferably the generosity of payments is not causing increased levels of disability reporting. Hence, in Section 4 we will probe further into this question, and focus in on disability reporting in Ireland. First though we look at potential theoretical reasons for mis-reporting.
2.2
POTENTIAL REASONS FOR MIS-
REPORTINGthe self-reported measure of disability, i.e. differential measurement error.
Labour market conditions and the structure of the social welfare system could well influence the amount of systematic reporting behaviour. More specifically, labour force participation changed dramatically in Ireland during the 1990s. The numbers in employment increased dramatically, and by 2001 there was almost full employment, leaving an unemployment rate of 3.6 per cent. For those who were still out of work, the eligibility rules for receiving unemployment assistance became more stringent, whereby unemployed persons must have proved they were actively seeking work to ensure continued receipt of unemployment assistance. The replacement rate – the ratio of unemployment benefits to after-tax wage income – was reduced from a high of 77 per cent to 64 per cent in 1994, a level below the OECD average. The Irish welfare system traditionally provided “…more or less permanent support for the unemployed” with no maximum duration for unemployment assistance. In recent years, however, recipients in some age groups have been required to register in a public employment or training programme if they wish to continue to receive benefits after their first six months on the rolls (Tille and Yi, 2001).
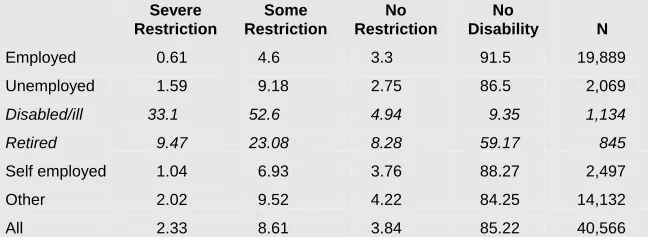
[image:14.496.130.454.503.623.2]During a cycle of full employment, individuals that do not wish to work may be required to seek an alternative explanation for their non-participation. Psychological and financial incentives may influence them to state that they are unable to work. Perhaps some individuals who do not want to work would claim to have a disability in order to (1) get disability social welfare assistance, or to (2) justify themselves for not working. The extent of these mis-reports could vary depending on whether the person is disabled/ill, unemployed or retired. Table 3 shows that there are differences in reported disability and associated limitations across labour force status categories in Ireland. At this stage we do not know if this is true disability or not, but none the less this provides a useful starting point to compare reported disability across labour force groups.
Table 3: Labour Force Status by Restrictions in Daily Activities, 1995-2001, Age <65 Years
Severe Restriction
Some Restriction
No Restriction
No
Disability N
Employed 0.61 4.6 3.3 91.5 19,889
Unemployed 1.59 9.18 2.75 86.5 2,069
Disabled/ill 33.1 52.6 4.94 9.35 1,134
Retired 9.47 23.08 8.28 59.17 845
Self employed 1.04 6.93 3.76 88.27 2,497
Other 2.02 9.52 4.22 84.25 14,132
All 2.33 8.61 3.84 85.22 40,566
For those who are employed there is a high proportion reporting no restriction or disability, as expected. Although 5 per cent are restricted in some way, we would not expect to see that employed workers would mis-report (Kreider, 1999) as there seems little incentive for them do so. Unemployed individuals on the other hand may be more likely to report a disability and we will need to disentangle whether this is true disability or mis-reporting with a view to obtaining disability allowance in the future. This may be difficult to do – it could be that due to lack of information they are claiming unemployment assistance rather than disability allowance, or it may be that they prefer to state their labour force status as unemployed rather than disabled, to avoid any potential discrimination. The disabled/ill group have a large proportion that say they are restricted in daily activities, as expected. About 14 per cent say that they are not restricted or have no disability. This is slightly higher than the figure presented for the Netherlands in 1993, where 11 per cent of those aged 58-63 years and in the labour force group of disabled, report no restrictions. The corresponding figures for the age groups 53-57 years and 43-52 years are 8 and 6 per cent respectively (Kerkhofs and Lindeboom, 1995). The 9.5 per cent of the labour force group ‘disabled/ill’ with no disability may be explained by the fact that their disability may be short term – our definition of disability means long-term chronic illness or disability only.
Our hypothesis is that the disabled/ill group may over-report for financial and psychological reasons, but this could also be true for the retired group. Table 2 shows that almost one third report a limitation – we also hypothesise that this group over-reports their disability status. The next group are the self-employed and the expectation is that they have no incentive to mis-report – about 8 per cent of them are restricted in some way. Finally, the other group include all those on training schemes or not covered by the previous categories. While these groups are not the focus of the paper, it will be interesting to view their disability reporting behaviour.
D
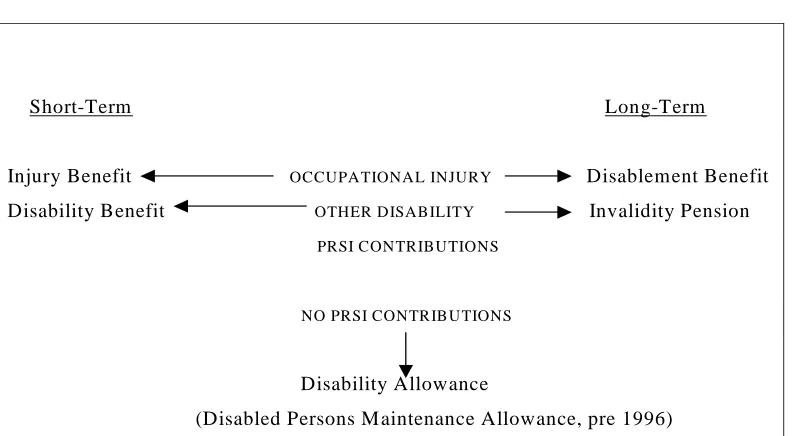
isability schemes in Ireland are varied depending on whether or not the disability/illness is short term or long term, the extent of previous social insurance contributions and the cause of disability. Figure 1 illustrates a brief description. A report by the Department of Social and Family Affairs provides a more in-depth discussion of these payments and their historical context, (2003). To summarise disability payments may be categorised into short- and long-term payments, and entitlements also vary by previous social insurance contributions. The amounts received are comparable to unemployment assistance/benefit, so in that respect there is no incentive to prefer disability benefit. The incentive structure therefore lies in accessibility of these payments – if people think that disability payments are more readily available than unemployment payments, this may influence their disability reporting behaviour. Two main types of disability payments exist in Ireland – Disability Allowance is a weekly allowance paid to people with a disability who are aged 16 years or over and under age 66 years. The disability must be expected to last for at least one year and the allowance is subject to both a medical suitability and a means test. The Deciding Officer may refer an individual for a medical assessment. Disability Benefit is a payment made to insured people who are unable to work due to illness. For this payment, individuals must attend their own GP to get a medical certificate. They may be required to attend a further medical assessment within the department of Social Welfare, but this is at the discretion of the Deciding Officer. [image:16.496.50.446.411.629.2]3.
Review of
Disability
Schemes in
Ireland
Figure 1: Description of Disability Payments in Ireland
Short-Term Long-Term
Injury Benefit OCCUPATIONAL INJURY Disablement Benefit Disability Benefit OTHER DISABILITY Invalidity Pension PRSI CONTRIBUTIONS
NO PRSI CONTRIBUTIONS
Disability Allowance
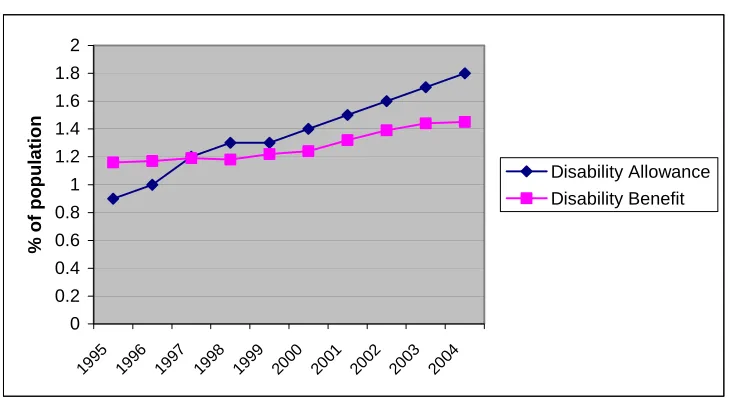
Figure 2 shows that the proportion of the population in receipt of the main disability payments increased between 1995 and 2000. This could be a reflection of improved access and information to social welfare payments for people with disabilities (this could include those who were previously employed but now are aware of their entitlements). On the other hand, it could be that there has been mis-reporting of disability status. The proportions receiving benefit fluctuate for all age groups indicating that it is not just because individuals are getting more disabilities as they get older, but that there are other reasons for the fluctuation in the proportions getting these payments.
Figure 2: Recipients of Disability Payments 1995-2004
0 0.2 0.4 0.6 0.8 1 1.2 1.4 1.6 1.8 2
1995 1996 1997 1998 1999 2000 2001 2002 2003 2004
%
of population
Disability Allowance Disability Benefit
Similar to the case of individuals who state their labour force status as unemployed, those who are near retirement age may also be prone to exaggerating their disability status, particularly if financial incentives exist. A pre-retirement allowance is available for individuals who have been unemployed for over a year and are aged 55 years and over. The number of people in receipt of this payment dropped from about 15,000 in 1994 to approximately 11,000 in 2004. For those who wish to ‘retire’ at an earlier age or were recently employed, social assistance is less available. Individuals must prove they are unable to find work, so in this case they may be more inclined to report a disability and apply for disability benefits. The health and retirement literature has focused on this issue for the US, UK and the Netherlands, but until recently there has been no comparable analysis for Ireland, possibly because of data limitations.
that individuals may have changed their reporting behaviour over the period. The number of cases referred for medical assessment increased from 6,423 in 1997 to 10,285 in the year 2000, and consequently the number of applicants deemed as unqualified or who did not attend medical examination increased over the years. This could be the result of increased surveillance on this social welfare payment. It could also suggest that individuals were claiming they had a disability in an attempt to receive the Disability Allowance. The increasing number of cases referred for examination but then not qualifying could support this view. Second, for Disability Benefit the number of cases referred for examination also increased dramatically from 54,226 in 1995 to 63,927 in 1998. Higher proportions were found capable of work after 1998 – ranging from 11.8 per cent in 1998 to over 15 per cent after 2000. This suggests that individuals may have been over-reporting their disability status.
Table 4: Percentage of Unqualified and Non-attendance to Medical Examinations
1995 1996 1997 1998 1999 2000 2001 2002 2003 2004 Disability
Allowance
Cases referred
for examination N/A N/A 6,423 7,229 8,862 10,285 9,663 8,952 8,450 NA Percentage
Unqualified N/A N/A 28 32 30 28 31 31 32 NA
Percentage
Non-attendance N/A N/A 25 26 27 33 32 30 27 NA
Disability Benefit
Cases referred
for examination 54,226 52,059 55,089 63,927 59,224 45,037 41,710 42,017 38,670 35,505 Percentage
Capable of
Work 14.8 12.8 13 11.8 12.5 15.6 15 14 16.6 16.3
Percentage
Non-attendance 29 31.4 30.3 32.0 30.7 27.6 29.8 29.6 31.2 31.1
Source: Statistical Information on Social Welfare Services, Department of Social, Community and Family Affairs.
These figures imply that it may be of interest to determine if changes over time were due to mis-reporting and if this was influenced by any administrative or institutional changes in the system. So the next section discusses the studies that reveal the extent of reporting errors in Ireland.
U
ntil recently in Ireland, there was no statistical evidence of overpayments of social welfare for disabilities. Two reviews have now been conducted and we discuss these in turn. The first is the Public Accounts Committee report, 2006. This report reviewed a pilot initiative of intensive monitoring of disability payments. The background to this evolved from a finding that lower back pain casesrepresented 17 per cent of all disability benefit claims in 2002. Resources were then redirected to a pilot initiative that gave priority in medical examinations for these cases. As a result, many cases were found to be capable of working and the success of this initiative suggested that early intervention may be necessary for other ailments. Only 154 of the original 1,532 claimants qualified for disability benefit due to lower back pain. In terms of medical assessment, this report recommended that reassessment should take place – 16 claimants of disability allowance were reassessed in 2003 and all were found not qualified, but we should bear in mind that they may qualify for other illness benefits under the social welfare system. For example in 2005, approximately 950 people found capable of work did not go back to work but availed of other schemes. Of course, some may not have been successful in getting employment so this is an issue that needs to be addressed.
There are two plausible explanations for the large number found capable of working, (1) they may have been mis-reporting disability or (2) the large proportion found capable may be partially due to the backlog of medical examinations so that individuals have recovered by the time their medical examination took place. It is likely though that people found capable of working, then claimed other social welfare benefits – so even though overpayments had been made, the overall expenditure saving was minimal. None the less, the department of social welfare spends in excess of €23 million each year on fees to medical practitioners in respect of certificates and medical reports – whereas the total cost of medical assessment is about €3.6 million per year – the Public Accounts Committee believed that if the department had a process of reviewing certificates by GPs, particularly against the opinion of the subsequent medical assessments, then money could be saved.
The second study is an econometric analysis of reporting behaviour between 1995 and 2001, (Gannon, 2006).2 The main
question asked in that paper was “…does reported disability status depend on your labour force status”, i.e. was there state dependent reporting behaviour? The model employed in that paper compared subjective and objective measures of disability for each labour force status group, and any remaining effect of labour force status on reported disability (compared to the employed) was taken as evidence of state dependent mis-reporting. In other words, some financial incentives existed to influence individuals to report having a disability in order to rationalise their labour force status. In particular, the study found that compared to employed persons, mis-reporting was clearly visible for those whose labour force status was disabled/ill or retired.
The model is similar to that used by Kerfhofs and Lindeboom (1995). In their later paper (2002) however, they emphasised the
importance of correcting for the fact that there may be unobserved individual characteristics such as previous investments in health or education that could influence labour force status and reported or true disability. Due to unobserved differences that exist between workers and disability recipients, they found that the extent of over-reporting was less than previous. Similar to Lindeboom and Kerkhofs (2002), we allow for the influence of unobserved effects that may be correlated with the objective measure of disability and labour force status and find the same effect – the level of mis-reporting is smaller.
The results from this model are shown in Figure A1 and this compares the level of actual reported disability with predicted disability as if employed, for each labour force status group. This is described separately for each of the four levels of disability status. First, for the disabled/ill group under 30 per cent report having a severely limiting disability. When we predict how they would respond if they were employed, we find that only approximately 3 per cent would report this type of disability. But unobserved individual characteristics should be accounted for, so we then find that about 15 per cent of the disabled/ill group would report a severely limiting disability. In other words, half of the original group would not report this limitation if responding as if employed. About 55 per cent report some limitation, and this would reduce to about 20 per cent when compared to the employed. So if the disabled/ill group are over-reporting severe or some limitations, it must be that they under-report no limitations or no disability. Indeed, the remaining two graphs show that over 4 per cent actually reported no limitations, when in fact almost double that would report in that manner if employed. The main difference, however, is for reporting of no disability – only 10 per cent report having no disability, but this increases to over 50 per cent when we account for measurement error relative to the employed. This graph clearly indicates that the disabled/ill group report severe or some limitations and under-report having no disability.
per cent report this type of disability compared to about 0.6 per cent if employed. Initially, we see that 60 per cent of the retired group report no disability and this increases to about 80 per cent if reporting as employed.
In order to get some conclusive evidence on the extent of mis-reporting of disability in Ireland, we should compare these results to the first study reported by the Public Accounts Committee and administrative data presented earlier in Table 4. First, for disability allowance if all those found unqualified or did not attend their assessment were actually mis-reporting disability, then the econometric result is consistent with administrative data i.e. 50 per cent do not report correctly. None the less, it is likely that some proportion is not mis-reporting and had recovered during the waiting time for assessment, so the econometric estimate may be higher than the actual level of mis-reporting. Similarly, for disability benefit, 40-45 per cent were found capable of work or non-attendance. Conversely, the model predicts disability reporting compared to the employed, so if the employed were less likely to report a (true) disability, then the econometric estimate would actually be underestimated. As pointed out by Kerkhofs and Lindeboom (1995), in their model they do not need to determine who tells the truth – the overall aim is to get measure of disability that is cleansed of state-dependent reporting error. In this context, we must take into account other evidence in order to get a more absolute measure of mis-reporting, for example evidence of overpayments from the PAC report. Another reason that may lead us to suspect that the econometric figure is underestimated is that only approximately 10 per cent of those with back pain who were assessed were found incapable of working. There is still a question though if people with back pain are mis-reporting or not, but in Canada, Campoleiti (2006) found that more stringent screening of applications for disability insurance is associated with a decline in reports of back pain. While 90 per cent mis-reporting seems very high, an approximate level of 50 per cent seems more reasonable, but this would depend on the severity of the illness, length of waiting times for medical assessment and the type of illness involved. Finally, although some of the administrative data suggests that there may have been changes in reporting behaviour over time, the evidence from this study shows that there were only marginal changes in state dependent reporting between 1995 and 2001.
T
he findings from our study are quite similar to those found by Kerfhofs and Lindeboom (1995, 2002). In their 1995 paper they assess the magnitude of mis-reporting of self assessed health and find that about three-quarters of all individuals who state their labour force group as disabled/ill would not report bad or to some extent bad health, if they responded as employed. Although we measure mis-reporting of a slightly different variable, i.e. selfreported limitations, we find that about the same proportion of the disabled/ill labour force group would not report a severe or to some extent limiting disability/chronic illness, if responding as if employed. When we introduce unobserved effects into the model and control for the fact that mis-reporting may be due to some unobserved individual characteristics such as previous investments in health or education, we find the same result as Lindeboom and Kerkhofs (2002). These results are even more comparable because they focus on work limiting disability in their 2002 paper. Both models find that approximately 60 per cent of the disabled group over-report having a severe or to some extent limiting disability. This reduces the proportions in similar magnitudes, so the differences in the prevalence of disability across countries remain the same. If we suspect that differences in disability rates across countries are due to the presence of different social security systems, then we would expect that in the Netherlands there should be more mis-reporting than in Ireland. However, we have only discussed the differences within the disabled/ill group and we would need exact figures of actual reported disability across each labour force group, to precisely calculate differences across countries in the overall rate of reported disability.
Our findings for the retired group are different to those from the Netherlands – we find that there is substantial mis-reporting among the retired. About one-fifth of those who report a disability would do so if they were employed. In the Netherlands, however, the level of reporting for the early retired group is quite similar to that of the employed. It is possible that differences in mis-reporting between the retired and disabled group arise in the Netherlands, because of different economic incentives for each group. Early retirement schemes were very popular in the 1980s and 1990s in the Netherlands as a means of encouraging people to leave the workforce to make room for a younger workforce. This means that older workers would not need to mis-report a disability in order to leave the workforce, as the direct retirement route was clearly possible. Given the changing demographics this is no longer necessary and the Dutch social partners have agreed that incentives for early retirement need to be reduced. Early retirement schemes are slowly being replaced by pre-pension arrangements shifting the burden of the cost from employers to the individual worker making the decision. Still, the OECD (2003) has reported that more needs to be done to reduce the incentives for early retirement. This may have implications for future mis-reporting of disability. In Ireland however, the incentives are similar for everyone up to age 66 years, so perhaps the retired group are simply a subset of the disabled/ill groups in terms of their reporting behaviour. Unless we analyse a harmonised dataset, we cannot precisely compare across different labour force groups, and even at that cultural and social norms will play a significant role in responses to similar questions. Kapteyn et al.
respondents have a lower response threshold in claiming disability than American respondents. Their evidence shows that especially in the more subjective health problems of pain and emotion, Americans use a tougher standard when assigning work disability status. Why these differences exist is another question, to some extent it may be due to differences in social welfare and/or social norms.
Once the evidence of mis-reporting is established, the next step in terms of policy is to try and reduce this reporting behaviour. In the Netherlands, this proved to be a difficult task and after many policy changes and pilot initiatives, the final outcome was to reduce the number of fraudulent disability insurance applications. In the Netherlands, around 10 per cent of the working age population were collecting benefits in the early 1990s. A major reform of the disability insurance scheme took place in 1993/1994 but there was no sustainable reduction in the numbers entering the scheme. Some of this may be attributed to a buoyant labour market whereby lower unemployment levels mean that individuals are more likely to aim for disability insurance schemes. In addition, they are less likely to loose their job when labour market conditions are good. More stringent measures were introduced in 2002 mainly because of institutional improvements3 and for the first time in seven years the
total number of beneficiaries declined. Some of this decline may be cyclical (the Dutch economy was in a period of recession and inflow to unemployment insurance increased) but recent research shows that in fact intensified screening of sickness absence also reduces the number of disability insurance applications, (de Jong, Lindeboom and van der Klaauw (2006)). The current challenges facing the Netherlands now are to reassess the stock of existing beneficiaries, restrict full benefits to severe cases, and reduce access to partial benefits from people with mild disabilities that do not affect their daily functioning and work ability.
In Spain, Jiminez-Martin et al. (2006) found that individuals aged between 55 and 59 years had a probability of receiving a benefit without deserving it, that was significantly higher than the rest of the individuals. Their results confirm that disability benefits are being used as a way of exiting the labour force before retirement age. While they do not specifically analyse the award errors for people aged less than 55 years, it is likely that this may also be a problem in Spain. One of the main sources of income for disabled persons is disability benefits, approximately 35 per cent receive benefits compared to an EU average of about 20 per cent, (OECD, 2003). Jiminez-Martin et al. (2006) make some recommendations for more medical tests but recognise the expenditure involved. But as we saw earlier the costs are likely to only be a small fraction of the benefits
(Netherlands). More recently, the Spanish Observatory of the Social Security System proposed reforms in the regulation of permanent disability benefits. These included approval of a list of occupational diseases and the exclusion of professions that are no longer suited to old-aged workers. In relation to this, they propose to modify retirement benefits by relaxing the restrictions on age for these professions.
In the US, Gruber (2000) notes that the level of disability insurance is 42 per cent of previous earnings on average and mostly non-taxable. The author fears that this could be subsidising early retirement of older workers who have no other reason for retiring. Nonetheless, a replacement rate of 42 per cent is quite low compared to the Netherlands, and this could be a contributing factor to the higher rates of disability in the Netherlands compared to the US. There is also evidence of mis-reporting of disability status among older workers, although there are conflicting results between earlier and more recent studies. Kreider (1999) found that non- workers over-report work limitations. Their main focus was on the consequential econometric issues involved in labour force participation models, rather than the relationship between reporting and social security benefits for disabled people. Bound (1989) found that they were no dis-incentive effects of disability benefit – most people on disability insurance were found to be healthy and half of those who had been rejected for disability insurance were then found capable of work. This would suggest that in the US the level of benefits does not contribute to mis-reporting but more so that it is a favourable route towards retirement. Benitez et al. (2004) analysed the 45-64 year age group during the 1992-93 period and found that a person’s evaluation of health is similar to Social Security Award evaluation. Given that expenditure on disability benefits in the US is quite low at less than 1 per cent of GDP, and the fact that the disability rate is quite low, we should not expect a high level of mis-reporting. Kreider (1999) and Benitez-Silva et al. (2004) give conflicting results but the earlier paper by Kreider only focuses on 1992/93 whereas Benitez-Silva et al., focus on data up to 1996 – it is possible that the different results are due to cyclical variation.
T
here is clearly evidence of mis-reporting of disability and overpayments of disability welfare in Ireland, so the next step is to find a strategy that will fix this problem.The question is what type of policy reform is needed and to what extent this should be monitored.Policy reform, in terms of eligibility conditions, does not seem to be enough according to evidence from the Netherlands.The same level of mis-reporting can be observed in Ireland even though there was not much reform. In Ireland, the disability schemes are targeted towards a diverse group depending on severity and duration of illness/disability and there was little reform in terms of disability policy during the period 1995-2001. Benefits increased in line withother social welfare payments and there were very few institutional changes.
In 1996 the payment of disability allowance was moved from the Department of Health to Social Community and Family Affairs. The purpose of this was to integrate income maintenance payments and to streamline the process for social welfare payments for the disabled more generally. The expectation was that this might reduce the level of potential overpayments within the system, nonetheless as we saw earlier the number of beneficiaries increased significantly but at the same time the level of mis-reporting only changed marginally. In 2003, a report from the Department of Social Community and Family Affairs reviewed expenditure on illness and disability schemes. One of their main recommendations was to improve the effectiveness and efficiency of the system by introducing a simpler one. But more recently, the PAC reported on the level of overpayments within the system. The PAC report recognised the level of work that has been done to eliminate overpayments in the social welfare system but recommended that the Department of Social Welfare should introduce further systems of integration with the Revenue Commissioners in order to streamline systems and reduce time taken to detect overpayments. There should also be greater liaison between GPs certificates and medical assessments from the Department. While the level of overpayments may then be reduced it is likely however that individuals no longer entitled to disability payments will seek payment from another social welfare scheme – thus it is important that policy also ensures that individuals are re-integrated in to the labour market once they are capable of working.
The implications from the more stringent measures in the Netherlands and the pilot initiative in Ireland are that this is a successful approach to reducing overpayments of disability welfare and ensuring that the appropriate people receive benefits. A cost-benefit analysis by de Jong et al. (2006), shows that the costs of intensified screening are only a small fraction of the benefits. There is a strong case, therefore, for a similar cost-benefit analysis to be carried out in Ireland and additionally for a nationwide expansion of the pilot initiative. The lesson to be learned from the Netherlands is that reform of the schemes is not sufficient without effective monitoring. It is crucial, however, that reform does not affect those who are currently receiving disability payments if they are genuinely in need of assistance. An efficient monitoring system should appropriately distinguish between those in genuine need of social welfare and those who are mis-reporting or no longer incapable of work.
A
s disability prevalence increased in many OECD countries, this raised the question if in fact the incidence of true disability increased or was there an element of mis-reporting? It could be that financialincentives existed to influence individuals to mis-report. This paper strived to answer this question using evidence from a recent Public Accounts Committee report and results from an econometric analysis of mis-reporting. The conclusion reached is that relative to the employed there was substantial mis-reporting in the late 1990s. Within the disabled/ill group almost 30 per cent had reported a severe disability, whereas this was reduced to approximately 15 per cent if individuals in this group would have responded as if employed. Similarly, the level of mis-reporting by the early retired group was reduced by half. These results are complemented by evidence from the PAC report that there was a substantial amount of overpayments in all social welfare in 2003, one-third of which were attributed to fraud. Some overpayments were due to the time lag in obtaining medical assessments, whereby some individuals had recovered and were then found capable of working. In this context, part of the econometric estimate may reflect mis-reporting due to this delay in medical assessment, rather than fraudulent mis-reporting.
These results are not unique to Ireland and this paper provided a comparative analysis with some other OECD countries. In terms of policy, the most effective strategy for reducing mis-reports is for careful monitoring of the disability benefit applicants. Evidence from the Netherlands suggests that this is a successful and inexpensive approach, and without effective monitoring, policy reform is not enough to reduce the number of overpayments of disability benefit. In an international context, these findings of overpayments are comparable to the Netherlands, Spain and the US. The resulting question is; what type of policy reform is required to address this problem of overpayments of disability welfare? For example, in the Netherlands, policy reform without efficient monitoring did not lead to a change in reporting behaviour. Eventually, when stricter obligations and penalties for firms were introduced, the number of beneficiaries declined. It is crucial the solution does not affect those in genuine need of disability benefits. The emphasis should, therefore, be on improved medical assessments with shorter waiting times and efficient monitoring. In terms of government expenditure, international research has shown that the cost of monitoring is only a small fraction of benefits.
The implications for Ireland are:
A need for review of the medical assessment procedure in order to reduce waiting times, and to reduce expenditure on medical practitioners.
Introduce further systems of integration between Department of Social Welfare and Revenue Commissioners in order to reduce time taken to detect overpayments.
Cost-benefit analysis of intensified screening should be carried out.
Individuals found capable of work need to be re-integrated into the labour force, so as to reduce the number applying for other social welfare payments.
REFERENCES
BENITEZ-SILVA, H., M. BUCHINSKY, H. CHAN, J. RUST and S. SHEIDVASSER, 2004. “How Large is the Bias in Self-reported Disability Status? Journal of Applied Econometrics, Vol. 19, pp. 649-670.
BOUND, J., 1991. “Self-Reported Versus Objective Measures of Health in Retirement Models”, The Journal of Human Resources, XXVI[1], pp. 106-138.
BOUND, J., 1989. “The Health and Earnings of Rejected Disability Insurance Applicants”, NBER Working Paper No. 2,816.
CAMPOLIETI, M., 2006. “Disability Insurance Adjudication Criteria and the Incidence of Hard-to-Diagnose Medical Conditions”, Contributions to Economic Analysis and Policy, Vol. 5, No. 1.
DE JONG, P., M. LINDEBOOM and B. VAN DER KLAAUW, 2006. “Screening Disability Insurance Applications”, IZA Discussion Paper No. 1981.
GANNON, B., 2006. “The Influence of Economic Incentives on Reported Disability Status”, mimeo, National University of Ireland, Maynooth.
GRUBER, J., 2000. “Disability Insurance Benefits and Labor Supply”, Journal of Political Economy,
Vol. 108, No. 6.
JIMINEZ-MARTIN, S., J. LABEAGA and C. VILAPLANA, 2006. “Award Errors and Permanent Disability Benefits in Spain”, FEDEA Working Paper 2006-18.
JOHANSSON, P. and P. SKEDINGER, 2005. “Are Objective Official Measures of Disability Reliable?” Institute for Labour Market Policy Evaluation, Sweden, Working Paper 2005, pp. 14.
KAPTEYN, A., J. SMITH and A. VAN SOEST, 2004. “Self-reported Work and Disability in the US and the Netherlands”, IZA Discussion Paper 1118.
KERKHOFS, M. and M. LINDEBOOM, 1995. “Subjective Health Measures and State Dependent Reporting Errors”, Health Economics, Vol. 4, pp. 221-235.
KREIDER, B., 1999. “Latent Work Disability and Reporting Bias”, The Journal of Human
Resources; XXXIV[4], pp. 734-769.
LINDEBOOM, M. and M. KERKHOFS, 2002. “Subjective Health Measures, Reporting Errors and the Endogenous Relationship between Health and Work”, IZA Discussion Paper No. 457, March.
OECD, 2003. Transforming Disability into Ability: Policies to Promote Work and Income Security for Disabled People, Paris: OECD.
PUBLIC ACCOUNTS COMMITTEE, 2006. Fourth Interim Report for 2003, Committee Hearings October 2004 to July 2005, Dail Éireann.
TILLE, C. and K. YI., 2001. “Curbing Unemployment in Europe: Are There Lessons from Ireland and the Netherlands, Current Issues in Economics and Finance, Federal Reserve Bank of New York, Vol. 7, No. 5.
WORLD HEALTH ORGANISATION, 1999. ICIDH-2 International Classification of Functioning
Figure A1 Actual v Predicted Probabilities –average of 1995-2001 Severe limitations 0 0.05 0. 1 0.15 0. 2 0.25 0. 3 Disabled Retired actual
predicted if employed
predicted if employed (includes unobserved heterogeneity)
So me lim itat ion s
0 0 .1 0 .2 0 .3 0 .4 0 .5 0 .6
D i s a ble d R e ti re d
a c tua l
p red ic te d if e m p lo ye d p red ic te d if e m p lo ye d (i nc lud e s uno bs e rv ed he te rog e nei ty )
No Limitations 0 0.02 0.04 0.06 0.08 0. 1 Disa bled Unem ploye
d Reti red Oth er ac tual
predic ted if employed predic ted if employed (includes unobs erved heterogeneity )
N o D is ability
0 0 .2 0 .4 0 .6 0 .8 1
Dis a bled Un em ploy ed Retire d Oth er
act ua l
C
HILD
P
OVERTY AND
C
HILD
I
NCOME
S
UPPORTS
: I
RELAND IN
C
OMPARATIVE
P
ERSPECTIVE
Tim Callan, Kieran Coleman, Brian Nolan, John R. Walsh
N
ESC’s (2005) characterisation of the developmental welfare state emphasises three overlapping areas of welfare state activity: services, income supports and activist or innovative measures. In this paper we focus on the income support domain, especially as it relates to children.1.
Introduction
There has been particular concern in Ireland, as in many other countries, about the effects of poverty on children. The impact of poverty during childhood, and especially in early childhood, may be especially difficult to reverse. For this reason, a key question is how policies can be made more effective in supporting the incomes of families with children. In order to explore this question we examine evidence on how child poverty rates vary across a wide range of countries and the role of policy differences in helping to explain these differences in outcomes for children. We then focus more closely on the Irish system of child-related income supports. We examine how it has evolved in recent years, and the impact of such changes on child poverty. The implications of introducing a “second tier” of income-tested child income support, replacing Child Dependant Additions and Family Income Supplement, are then examined. Such a change has been under consideration as part of the Ending Child Poverty Initiative under Sustaining Progress and remains on the agenda in the most recent partnership agreement, Towards 2016.
2.1
CHILD POVERTY IN INTERNATIONAL PERSPECTIVE2.
Child Poverty
and Welfare
Policies:
Cross-country
Comparisons
[image:30.499.74.450.314.602.2]The most comprehensive recent study of rates of child poverty in rich countries is reported in UNICEF (2005). Overall results for child income poverty (the risk of living in a household with an income below 50 per cent of median income per adult equivalent) are reported in Table 1. The lowest rates of child poverty were found in the Scandinavian countries, where the risk of income poverty was between 2 and 4 per cent. Almost all Continental European countries, along with some of the new member states, had child poverty rates of between 7 and 13 per cent. Ten countries had higher child poverty rates – the highest in the US and in Mexico, with the others at levels of between 14 and 17 per cent. It is striking that all of the English speaking countries had poverty rates well above the average. The six English speaking countries occupied six of the nine worst positions in terms of the prevalence of child poverty. Micklewright (2004) extends this analysis with further comparisons and finds that the English-speaking countries also perform poorly on other indicators of child welfare.
Table 1: Rates of Income Poverty for Children in Rich Countries, Around 2000
Country
Rate of Child Poverty
(Relative Income Poverty, 50% of Median Equivalised Income)
Denmark 2.4
Finland 2.8
Norway 3.4
Sweden 4.2
Czech Republic 6.8
Switzerland 6.8
France 7.5
Belgium 7.7
Hungary 8.8
Luxembourg 9.1
Netherlands 9.8
Austria 10.2
Germany 10.2
Greece 12.4
Poland 12.7
Spain 13.3
Japan 14.3
Australia 14.7
Canada 14.9
UK 15.4
Portugal 15.6
Ireland 15.7
New Zealand 16.3
Italy 16.6
USA 21.9
Mexico 27.7
Source: UNICEF (2005), Child Poverty in Rich Countries 2005, Innocenti Report Card No. 6.
Note: The poverty rates in Figure 1 refer to the following years: 2001 (Switzerland, France, Germany,
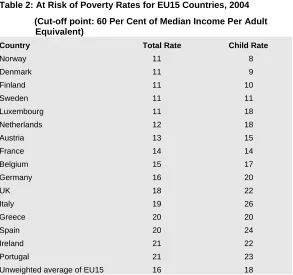
More recent information on the incidence of child and overall poverty is available for EU countries. This is of particular relevance given the emphasis on trying to match EU best practice in social policy, as set out in the Lisbon strategy. Table 2 reports “at risk of poverty” measures for the total population and for children, for EU countries in 2004. The cut-off used is 60 per cent of median income per adult equivalent, one of the key “Laeken” indicators.
Table 2: At Risk of Poverty Rates for EU15 Countries, 2004
(Cut-off point: 60 Per Cent of Median Income Per Adult Equivalent)
Country Total Rate Child Rate
Norway 11 8
Denmark 11 9
Finland 11 10
Sweden 11 11
Luxembourg 11 18
Netherlands 12 18
Austria 13 15
France 14 14
Belgium 15 17
Germany 16 20
UK 18 22
Italy 19 26
Greece 20 20
Spain 20 24
Ireland 21 22
Portugal 21 23
Unweighted average of EU15 16 18
Note: Figures for Netherlands and for the UK are for 2003.
Source: Eurostat web site, http://www.epp.eurostat.cec.int.
The Scandinavian countries had the lowest rates of overall income poverty, and rates of child poverty which were, if anything, somewhat lower (child poverty rates of 8 to 11 per cent). This makes them stand out from Continental European countries where the child poverty rates were between 14 and 20 per cent. The UK and Ireland had child poverty rates of 22 per cent, with higher rates of up to 26 per cent in a group of “southern” countries (Portugal, Spain and Italy).
For the most part, child poverty rates were close to overall poverty rates.1 Norway, Denmark and Finland were the only
countries with child poverty rates below the overall poverty rate. There were two countries, Luxembourg and the Netherlands, with low overall poverty rates but substantially higher child poverty rates.
1 This is in line with Brady’s (2004) finding that, for 18 rich Western countries, child
2.2
CHILD POVERTY AND CHILD INCOME SUPPORT POLICIESThe lowest rates of child poverty and of overall poverty shown in Table 2 are for the Nordic countries – Denmark, Finland and Sweden among the EU countries, and Norway. The logic of the “best practice” approach dictates that special attention should be paid to these countries in order to understand how they have achieved low rates of child and general poverty, and what lessons may be learned from their experience. This is all the more so because the child poverty outcomes for children achieved in theses countries represent “best practice” not just within the EU but in global terms. In seeking to “end child poverty” a closer look at the Scandinavian experience is clearly warranted.
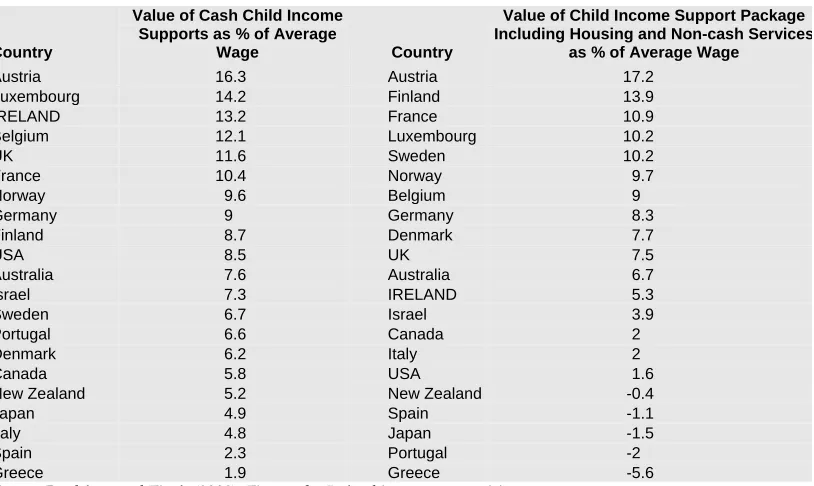
[image:32.499.43.450.404.647.2]We begin by considering how income support paid by the state in respect of children varies across countries: clearly this has the potential to affect child poverty outcomes. Child income supports can vary according to the age and number of the children concerned, and may also depend on whether one or two parents are present in the household, and on the labour force status and income of the parent(s). Bradshaw and Finch (2002) examine child income support packages for a wide range of family types and labour market/income situations. They choose a subset of these cases, giving greater weight to those occurring more commonly. While this does not provide a fully representative picture of families in any one country, this approach provides a standardised framework with which to assess the nature of the income support packages across countries. Key results are set out in Table 3.
Table 3: Ranking of the Child Support Package for 22 Countries, 2001
Country
Value of Cash Child Income Supports as % of Average
Wage Country
Value of Child Income Support Package Including Housing and Non-cash Services
as % of Average Wage
Austria 16.3 Austria 17.2
Luxembourg 14.2 Finland 13.9
IRELAND 13.2 France 10.9
Belgium 12.1 Luxembourg 10.2
UK 11.6 Sweden 10.2
France 10.4 Norway 9.7
Norway 9.6 Belgium 9
Germany 9 Germany 8.3
Finland 8.7 Denmark 7.7
USA 8.5 UK 7.5
Australia 7.6 Australia 6.7
Israel 7.3 IRELAND 5.3
Sweden 6.7 Israel 3.9
Portugal 6.6 Canada 2
Denmark 6.2 Italy 2
Canada 5.8 USA 1.6
New Zealand 5.2 New Zealand -0.4
Japan 4.9 Spain -1.1
Italy 4.8 Japan -1.5
Spain 2.3 Portugal -2
Greece 1.9 Greece -5.6
Source: Bradshaw and Finch (2002). Figures for Ireland incorporate revisions
The package of cash income supports offered in Ireland, as of 2001, was among the most generous across countries. Ireland ranked third in terms of the value of the cash package of income supports for children – mainly child benefit and child dependant additions. The total value of the package, averaged over a wide range of family situations, was just over 13 per cent of the average industrial wage, compared with 15 per cent for the country with the most generous package. The value of the package in most countries – including the four Scandinavian countries – was between 5 and 10 per cent of the average wage.
The value of Ireland’s overall child support package, taking into account housing benefits and provision of non-cash services such as subsidised childcare, was towards the lower end of the international spectrum in 2001. Increases in child benefit since then, and the introduction of the Early Childcare Subsidy will have boosted Ireland’s overall child support package, and its position in the country rankings of child supports. Because this support is delivered through a cash mechanism, while other countries typically use non-cash mechanisms for childcare, Ireland’s position in the ranking of cash income supports will be further enhanced, while its low ranking in terms of directly provided services will remain unchanged.
It is striking that the four Scandinavian countries, which have the lowest child poverty rates, had child income support packages of between 6 and 10 per cent, in the middle of the international ranking. Thus, their exceptional performance in terms of reducing child poverty is not due to exceptionally high child income supports. Indeed, both Ireland and the UK have higher valued cash supports – but as we have seen, child poverty rates in Ireland and the UK are close to the highest in the EU, while those in the Scandinavian countries are among the lowest.
2.3
WELFARE REGIMESHow then have the Scandinavian countries managed to achieve such low rates of child poverty? A key factor in explaining this is that the income situation of children depends on the total income package received by their parents, not just on the elements which are related to the presence of children. The Scandinavian societies combine high employment rates with a welfare regime which gives high levels of payment to those on social protection. Table 4 below illustrates for Ireland, the UK and the four Scandinavian countries:2
a. the unemployment benefit paid to a single person as a proportion of the EU at risk of poverty threshold (60 per cent of median income per adult equivalent);
2 While individual examples of this type might not be representative we know (e.g.,
b. the poverty threshold as a proportion of the average industrial wage; and
[image:34.499.57.453.115.231.2]c. unemployment benefit as a proportion of the average industrial wage.
Table 4: Poverty Thresholds, Average Wages and Unemployment Benefits, 2004
Unemployment Benefit as % of Poverty
Threshold
Poverty Threshold as % of Average Wage of
Production Worker
UB as % of Average Wage of Production
Worker
Denmark 147 29 43
Finland 121 34 41
Sweden 89 37 33
Norway1 70 42 29
Ireland 65 39 26
UK 40 34 14
Notes: 1. As UB is earnings related, and can be payable in respect of quite low levels of earnings, social
assistance provides a higher floor – similar to the UB payable to an individual on half the average wage. The minimum wage in Ireland is just over half the average industrial wage.
Source: Poverty threshold from Eurostat web site cited in Table 2. Wage for average production worker from
OECD Taxing Wages2003-2004. Unemployment benefit for a single person from OECD (2006) Benefits and
Wages: OECD Indicators 2004 and associated online country files.
In Ireland, the rate of Unemployment Benefit in 2004 was about two-thirds of the at-risk-of-poverty threshold for a single person. For Sweden the ratio was almost 90 per cent, while the payment rates in Finland and Denmark were well above the at-risk-of-poverty threshold in those countries. In the UK, by contrast, the payment rate was 40 per cent of the at-risk-of-poverty threshold.
The poverty thresholds represent varying proportions of the average industrial wage across countries. Is this ratio particularly high in Ireland, causing particular labour market difficulties in paying a welfare rate which is high in relation to the at-risk-of-poverty threshold? The Irish rate is 39 per cent, higher than that in Denmark, Finland and the UK. It is also somewhat above the rate in Sweden (37 per cent) but below that in Norway (42 per cent).
Sapir (2005) provides a further perspective on the issue of whether the achievement of a low risk of poverty measure in the Scandinavian countries is at the expense of a trade-off between equity and efficiency. Figure 1, drawn from Sapir, plots the EU15 countries in terms of an equity goal (the probability of avoiding poverty, measured by 100 minus the percentage risk of poverty measure) and an efficiency goal (the employment rate, which takes into account not just unemployment but also labour market participation).
Figure 1: Employment Rates and Probability of Avoiding Poverty, EU, 2004
Source: Sapir (2005).
T
he clear message from these international comparisons is that, to date, the most effective policy regimes in countering both child poverty and general poverty have been those of the Scandinavian countries. Furthermore, the success in countering child poverty is notdue to especially high child income support payments, but to the more general income support regime and to the extent to which the welfare state more broadly reconciles equity and efficiency goals and underpins a high employment rate. However, welfare state expenditures have to be financed. If Ireland, like other English-speaking countries, is unwilling to finance expenditure at the levels seen in Scandinavian countries, then the question arises as to what can be achieved with a more targeted approach to the reduction of child income poverty. In this section, therefore, we concentrate on the recent evolution of policy in Ireland and in other English speaking countries, which relates to the development of more targeted child income supports. It must be remembered, however, that these supports operate in an environment where child income poverty is substantially higher than in the Scandinavian countries.
3.
Restructuring
Child Income
Supports: Policy
Impacts, Policy
Options
3.1
ASSESSING THE IMPACT ON CHILD POVERTY OF RECENT DEVELOPMENTS IN CHILD INCOME SUPPORT [image:35.499.179.447.88.240.2]of support which was neutral with respect to labour market status, and away from payments conditional on being out of work.
The outcome in terms of the balance between payment rates for CDAs and Child Benefit is illustrated in Figure 2. The rate of payment for Child Benefit rose from just under 2 per cent of the average industrial wage in 1994 to a level just under 6 per cent of that wage in 2005. While CDA payment rates remained constant in nominal terms, rising real and nominal wages meant that CDA rates declined as a proportion of the average industrial wage from about 5 per cent in 2000 to 3 per cent in 2005. The total income support package rose from 7 per cent of the average wage to 9 per cent, with the net increase concentrated in the period from 2000 to 2002. Figure 2: Rates of Child Benefit and Child Dependant Addition as a Percentage of
Average Earnings in Manufacturing, 1994 to 2005
0 1 2 3 4 5 6 7 8 9 10
1994 1996 1998 2000 2002 2004 % of ave. weekly
earnings
CB CDA CB+CDA
Budget 2006 introduced a further innovation in the form of the Early Childcare Subsidy. This is a cash support, allowing the parent or parents to choose whether to use the money to help purchase paid childcare or to use it as a financial support for a parent to undertake the care.
[image:36.499.110.445.245.484.2]