Volume 7 N° 1 (2008)
Highlights in this issue:
- Recent economic developments and short-term prospects
-
The Great Moderation in the euro area: what role have
economic policies played?
- Recent labour market reforms in the euro area:
characteristics and estimated impact
- Member States' differences in the transmission of recent
inflation shocks
- Focus – Economic and monetary integration in East Asia:
Are there lessons to be learned from the European
Table of contents
E
DITORIAL...3
I.
E
CONOMIC SITUATION IN THE EURO AREA...5
THE GREAT MODERATION IN THE EURO AREA: WHAT ROLE HAVE ECONOMIC POLICIESPLAYED?... 12
RECENT LABOUR MARKET REFORMS IN THE EURO AREA: CHARACTERISTICS AND
ESTIMATED IMPACT... 18
MEMBER STATES' DIFFERENCES IN THE TRANSMISSION OF RECENT INFLATION SHOCKS...23
II. F
OCUS–
E
CONOMIC AND MONETARY INTEGRATION INE
ASTA
SIA:
A
RE THERELESSONS TO BE LEARNED FROM THE EUROPEAN EXPERIENCE
? ... 30
III. R
ECENTDG
ECFIN
PUBLICATIONS... 44
IV. K
EY INDICATORS FOR THE EURO AREA... 46
B
OXES:
1. THE IMPACT OF HIGHER OIL PRICES –SIMULATIONS WITH THE NEW VERSION
OF THE COMMISSION'S QUEST MODEL... 10
E
DITORIALThe external headwinds that the euro-area economy has been facing for several months have gathered strength.
Firstly, uncertainties about the duration of the financial turmoil, the ultimate scale of its costs and the location of the losses have intensified and continue to affect investor confidence.
While the ECB and other major central banks have taken decisive action to stabilise money markets, the functioning of these markets has not yet returned to normal. Banks are still reluctant to lend to each other at longer maturities, and the use of central-bank lending facilities remains much higher than usual. Meanwhile, other key credit markets are disrupted. The fear of losses from defaults on US sub-prime mortgages remains pervasive and evidence also suggests that defaults have spread to other sectors of the US economy. Problems are emerging with higher quality US residential mortgages, as well as with commercial mortgages, automobile loans and credit-card debt.
Substantial asset write-downs have implied corresponding capital losses for banks and triggered a re-capitalisation in several cases – often involving investments by sovereign wealth funds. Amid the need to rebuild capital and the prospect of reduced earnings, there has been a generalised tightening in bank lending standards in the US and in Europe but not yet so in emerging markets.
Secondly, recent data for the US points to a more severe contraction of the housing sector than previously expected and, according to most private sector analysts, the US economy is already in, or is on the brink of, a recession. Looking ahead, it is difficult to say whether the US economy will rebound relatively quickly or whether the downturn will be more protracted.
Given the importance of the US economy and the international linkages through the trade channel and financial markets, the rest of the world will not be immune. In the case of the euro area, the impact of the US downturn will also depend on developments in exchange rates. In this respect, excessive volatility and disorderly
movements in exchange rates are undesirable for economic growth and, in the present circumstances, excessive exchange rate moves are a source of concern.
Finally, inflation pressures from surging energy and food prices represent another downside risk to the outlook. Oil prices remain high and volatile, driven by limited spare capacity, robust demand from emerging markets and geopolitical tensions in oil-producing countries. According to the futures market, they will remain very high this year. Prices of non-fuel commodities, however, are now expected to stabilise.
These combined headwinds have begun to take a toll on euro-area GDP growth which decelerated from 2.6% year-on-year in the third quarter of last year to 2.2% year-on-year in the fourth quarter. They also led us to revise our growth projections downwards in our Interim Forecast released on 21 February to 1.8% for 2008 as a whole. This is 0.4 pp lower than projected in the 2007 Autumn Forecast. The most recent hard and soft data released since the publication of the interim forecast are consistent with this projection.
The focus section of this report looks at an issue which has recently attracted renewed attention from economists and policy makers: the possible lessons of European economic and monetary integration for the process of regional integration in Asia. Greater intra-regional monetary and financial stability in East Asia would obviously be beneficial for the countries concerned. It would also be in the interest of the euro area and the global financial system, particularly if it could help support a more orderly unwinding of global imbalances where the euro would not have to bear an excessive weight of the exchange rate adjustment as is the case today.
The Asian financial crisis of the late 1990s has provided some momentum to economic integration in East Asia but progress has so far been uneven. While trade integration has increased rapidly, financial and monetary cooperation has advanced considerably more slowly.
In the field of monetary cooperation, the most advanced institutional process developed by East Asian countries so far is the so-called Chiang Mai Initiative (CMI). This collection of 17 bilateral swap agreements seems, however, to have exhausted its role. The bilateral swap agreements have never been activated and Asian countries have accumulated huge currency reserves, which may signal a lack of confidence in the credibility of the system.
There is therefore a need to give new momentum to the integration process and to put in place mechanisms that could help the region face currency turmoil effectively and reduce its exposure to global imbalances. Asia’s recent decision to study the possibility of a multilateral swap arrangement can be seen as a step in that direction. Economists have also begun to discuss possible moves towards closer monetary and exchange rate cooperation with a view to full monetary and economic union.
Regarding lessons that can be drawn from the European monetary integration, it is necessary to stress the profound differences in political and economic conditions between the two regions. The global context is today also very different from the situation prevailing when monetary unification started in Europe. The integration
steps followed by Europe clearly cannot be replicated in East Asia. Nevertheless, as argued in this Report, the European experience can provide some useful lessons, as on many issues, the European integration process transcends the local historical experience. In particular, it points to two major challenges facing further monetary integration in Asia.
First, real and nominal convergence is still elusive in Asia and on many counts Asia is not at the stage of integration where Europe was when it began its monetary integration process. This is particularly so in fields such as cross-border labour market mobility, regional financial integration, regulatory harmonisation and business cycle synchronisation. On the other hand, East Asian intra-regional trade has increased significantly in recent years and may be similar to that of Europe in the late 1980s. And, the European experience shows that the monetary integration process itself tends to bring countries concerned closer to an Optimum Currency Area. To be viable, however, further exchange rate and monetary integration will require important structural changes in the economies concerned.
Second, monetary integration calls for strong political commitment and adequate governance. The determination of the political leadership in East Asian countries to bring economic policy in line with the requirements of such an integration scheme appears weak at this stage. Furthermore, effective surveillance mechanisms are not in place. Effective surveillance, based on some form of institutional cooperation, is a pre-condition for the successful achievement of exchange rate and monetary coordination. This is probably the most important hurdle on the way to further monetary integration in East Asia.
KlausREGLING
I.
Economic situation in the euro area
Activity in the euro area has now clearly started to soften under the combined effects of surging oil prices, continued financial market turbulence and slowing global trade growth. GDP growth decelerated to 0.4% (q-o-q) in the last quarter of 2007. This deceleration owes much to a significant weakening of private consumption, mostly attributable to unfavourable developments in consumer prices. A comforting development was the continuation of strong growth in investment spending (0.8% q-o-q), explained by high capacity utilisation and the high profitability of the non-financial corporate sector. According to the Commission’s Interim Forecast of February 2008, economic growth in the euro area is expected to slow down to 1.8% for 2008, a 0.4 pp downward revision compared to the 2007Autumn Forecast.
Most OECD countries have experienced a sharp reduction in output growth volatility over the past three decades. Econometric analysis indicates that this ‘Great Moderation’ is not just the result of a long period of luck in the form of milder shocks. It can also partly be ascribed to improvements in economic policies, in particular more credible monetary policy and, to a lesser extent, more powerful automatic fiscal stabilisers. Policy improvements have been more substantial in countries, particularly some Southern euro-area Member States, where policy mistakes were particularly acute in the 1970s-80s. In these countries, policy changes have made a comparatively larger contribution to the drop in output volatility.
Reform data compiled in ECFIN's LABREF database suggest that labour market reforms put in place in the euro area in recent years have mainly aimed at increasing labour utilisation, especially of those groups with low participation rates (the outsiders). Reforms targeted at improving labour market flexibility also focused mainly on the outsiders, with little effort made to adapt employment regulation for insiders. Evidence shows that reforms have to some extent paid off, raising the average employment rates and enhancing the response of employment to cyclical shocks. However, the increased dualism of the euro-area labour market may require further reform measures targeted at insiders rather than outsiders.
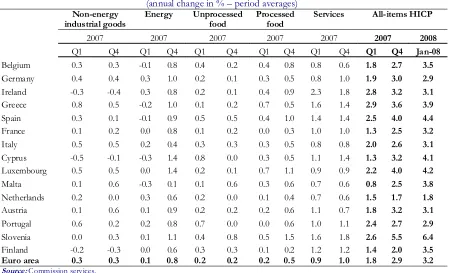
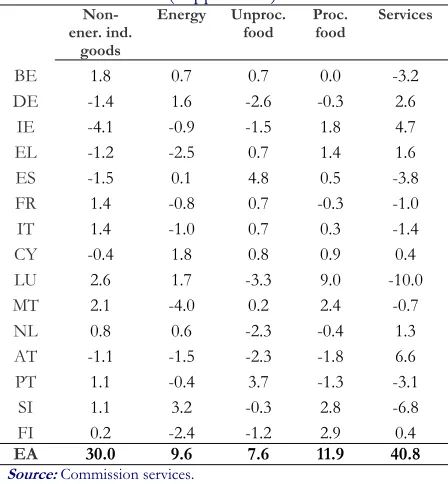
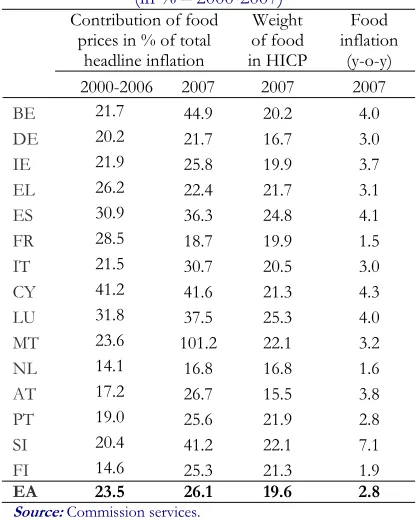
While headline inflation in the euro area has increased significantly in recent months, inflation dispersion amongst euro-area Member States has also increased visibly since summer 2007. Although energy and food prices have accelerated in all Member States, the global shocks to oil and agricultural commodity prices have been transmitted to individual countries with varying intensity. This heterogeneity can be related to a range of factors, including country differences in the weight of food and energy in the national HICP basket, in the degree of competition in retail markets and in the cyclical position. Furthermore, the exchange rate pass-through to consumer prices has differed across euro-area Member States.
1. Recent economic developments and
short-term prospects
1The financial sector remains in a state of flux…
The global economic situation and outlook remain unusually uncertain at the beginning of 2008 mainly due to the uncertainty about the extent, duration and impact of financial turbulence. While the ECB and other major central banks have taken decisive action to stabilise money markets, the functioning of these markets has not yet returned to normal. Hence, spreads on interbank markets remain elevated when compared with previous periods, indicating continued tensions. Beginning of March, the spread between the month Euribor and the 3-month treasury bills stood around 50 basis
1 The cut-off date for the statistics included in this issue was 14 March 2008.
points, compared with 100 in December 2007 (Graph 1).
Graph 1: Euro-area money market (in % – 1 Jan 2007 to 14 Mar 2008)
3.4 3.6 3.8 4.0 4.2 4.4 4.6 4.8 5.0
Jan-07 Mar-07 May-07 Jul-07 Sep-07 Nov-07 Jan-08 Mar-08 T-bills, 3m
Euribor 3m
Source: Ecowin.
area. The ECB has kept its policy rate unchanged since the summer but ECFIN's Monetary Conditions Indicator (which reflects real short-term interest rates and the real exchange rate) has showed a continued tightening until December due to both higher short-term interbank interest rates and further appreciation of the euro (Graph 2). In January and February, the MCI loosened somewhat again, mainly due to the effect of higher inflation on real interest rates but also to a moderate fall in the spreads between interbank interest rates and risk-free alternatives.
Graph 2: Euro area MCI and its contributors (inverted scale – Jan 1999 – Feb 2008)
-4
-3
-2
-1
0
1
2
Jan-99 Jan-00 Jan-01 Jan-02 Jan-03 Jan-04 Jan-05 Jan-06 Jan-07 Jan-08 REER (1) RIR (2) MCI (3)
Loosening
Tightening
(1) Reel effective exchange rate. (2) Real interest rate.
(3) Monetary Conditions Indicator.
Source: Commission services.
Problems in credit markets have been reflected in the balance sheets of euro-area banks. Many of these banks had retained significant exposure to credit risk in securitised products via
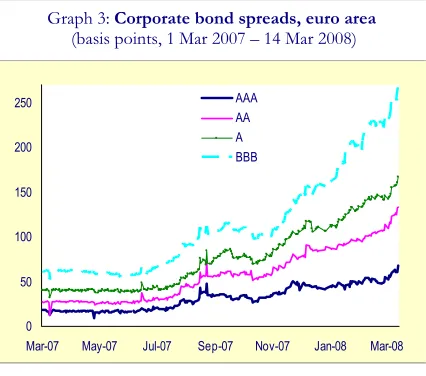
off-balance-sheet operations. These off-balance-off-balance-sheet exposures, which were originally a source of liquidity problems for banks, have now become a problem for bank capital. The need to rebuild capital and the prospect of reduced earnings have led to a generalised tightening in bank lending standards. The January 2008 ECB's bank lending survey for the euro area reported a further sharp tightening of credit standards for loans to enterprises as well as to households – although the former were more affected than the latter. The survey also suggests that the tightening phase is not over as banks expect the financial turmoil to have a greater impact on credit standards in the first quarter of 2008 than over the previous three months.
Graph 3: Corporate bond spreads, euro area (basis points, 1 Mar 2007 – 14 Mar 2008)
0 50 100 150 200 250
Mar-07 May-07 Jul-07 Sep-07 Nov-07 Jan-08 Mar-08 AAA
AA A BBB
Source: Commission services.
[image:8.595.313.526.536.724.2]The tightening of financial conditions is not confined to bank loans. Spreads on corporate
Table 1: Euro-area growth components
Forecast (1)
2007
Q1 2007 Q2 2007 Q3 2007 Q4 Carryover to 2008 2007 (2) 2008 (2)
Percentage change on previous period, volumes
GDP 0.8 0.3 0.7 0.4 0.7 2.6 2.2
Private consumption 0.0 0.6 0.5 -0.1 0.4 1.7 2.1
Government consumption 1.1 0.2 0.7 -0.1 0.3 2.0 2.1
Gross fixed capital formation 1.7 0.0 1.2 0.8 1.2 4.7 2.9
Exports of goods and services 0.9 0.8 2.1 0.5 1.6 5.8 5.3
Imports of goods and services 1.4 0.3 2.5 -0.4 1.0 5.3 5.5
Percentage point contribution to change in GDP
Private consumption 0.0 0.4 0.3 0.0 0.2 1.0 1.2
Government consumption 0.2 0.0 0.1 0.0 0.1 0.4 0.4
Gross fixed capital formation 0.4 0.0 0.3 0.2 0.3 1.0 0.6
Changes in inventories 0.4 -0.3 0.2 -0.1 -0.1 0.0 0.0
Net exports -0.2 0.2 -0.1 0.4 0.3 0.2 0.0
(1) Annual change in %. (2) European Commission Autumn 2007 Forecasts. Source: Commission services.
bonds have widened to multi-year highs, mostly for lower rated bonds (Graph 3). In addition, the cost of insuring against debt default has soared to new highs. Finally, equity markets, which had shown remarkable resilience to the financial turmoil in the past months, have dropped by more than 15% since the beginning of the year.
A significant softening of household spending….
The extent to which the financial turbulence has spilled over to the real economy in the euro area is difficult to assess at this juncture. The economy has in fact been hit simultaneously by a number of shocks, including surging commodity prices and a softening of world trade, the effects of which are difficult to disentangle. In any event, activity in the euro area has now clearly softened. GDP growth in the euro area decelerated to 0.4% (q-o-q) in the last quarter of 2007, compared to 0.7% in the previous quarter, bringing y-o-y growth down to 2.2%.
The GDP breakdown shows that the deceleration in the fourth quarter owes much to a significant weakening of private consumption. Household consumption dropped slightly (by 0.1% q-o-q) after increasing by 0.5% in the third quarter. The weakening was broad-based at the country level, though much sharper in Germany (-0.8% q-o-q). It was clearly the consequence of rising consumer prices. In nominal terms, GDP and consumption increased at broadly similar
rates both in the fourth quarter of 2007 and during the year as a whole. Consumption weakness is therefore mostly attributable to the deterioration of the terms of trade, i.e. unfavourable developments in consumer prices relative to the GDP deflator. Although the household savings ratio dropped marginally in the second and third quarters of last year, there is no sign that consumers have decided to cut their savings significantly to cushion the price shock, which is consequently fully transmitted into lower real consumption.2
The most recent data paint a mixed picture of the ongoing dynamics in consumer spending. After three consecutive months of contraction, retail sales picked up again in January. Growth in consumer credit, while significantly below its 2006 peak, also accelerated moderately in December and January. However, price pressures have not abated so far. According to Eurostat’s flash estimate, annual euro-area headline inflation was running at 3.3% in February, 0.1 pp higher than in January; i.e. the highest rate of inflation since 1999. The latest detailed breakdown of the HICP showed no sign of clear deceleration in the main drivers of the inflation bulge in February: energy inflation remains very high (10.4%), though slightly lower than in January (0.2 pp) while food inflation picked up to 5.2% from 4.8% in January.
2 No data on households' savings is yet available for the fourth quarter.
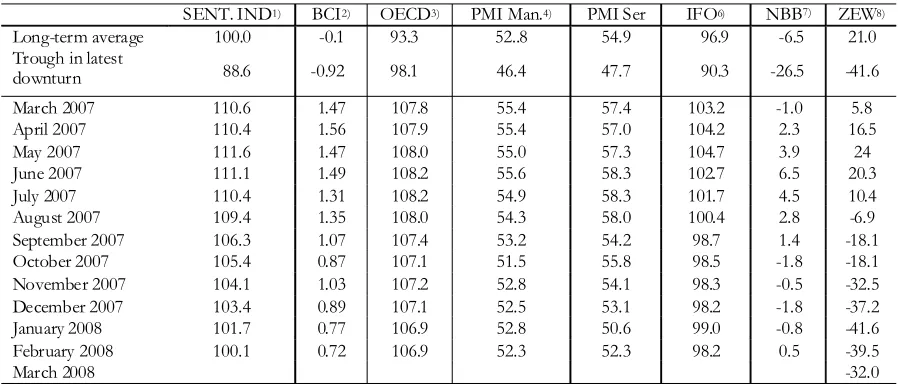
Table 2: Selected euro-area and national leading indicators, 2007-2008
SENT. IND1) BCI2) OECD3) PMI Man.4) PMI Ser IFO6) NBB7) ZEW8)
Long-term average 100.0 -0.1 93.3 52..8 54.9 96.9 -6.5 21.0 Trough in latest
downturn 88.6 -0.92 98.1 46.4 47.7 90.3 -26.5 -41.6
March 2007 110.6 1.47 107.8 55.4 57.4 103.2 -1.0 5.8 April 2007 110.4 1.56 107.9 55.4 57.0 104.2 2.3 16.5
May 2007 111.6 1.47 108.0 55.0 57.3 104.7 3.9 24
June 2007 111.1 1.49 108.2 55.6 58.3 102.7 6.5 20.3 July 2007 110.4 1.31 108.2 54.9 58.3 101.7 4.5 10.4 August 2007 109.4 1.35 108.0 54.3 58.0 100.4 2.8 -6.9 September 2007 106.3 1.07 107.4 53.2 54.2 98.7 1.4 -18.1 October 2007 105.4 0.87 107.1 51.5 55.8 98.5 -1.8 -18.1 November 2007 104.1 1.03 107.2 52.8 54.1 98.3 -0.5 -32.5 December 2007 103.4 0.89 107.1 52.5 53.1 98.2 -1.8 -37.2 January 2008 101.7 0.77 106.9 52.8 50.6 99.0 -0.8 -41.6 February 2008 100.1 0.72 106.9 52.3 52.3 98.2 0.5 -39.5
March 2008 -32.0
[image:9.595.71.520.104.298.2]Negative developments in purchasing power have clearly dented consumer sentiment. Consumer confidence has been gradually declining since May 2007 and now stands below its long-term average. The deterioration of sentiment has been primarily visible in rising worries about price developments and the general economic situation. Households have also reported a rise in perceived risks of unemployment but, reflecting continuous good news from the labour market, the weakening of confidence has been more modest in that area. Growth in employment remains robust and unemployment has continued its downward trajectory in recent months.
Graph 4: Consumer confidence, euro area (Balance in % – Jan 2000 to Feb 2008)
-25 -20 -15 -10 -5 0 5
Jan-00 Jan-01 Jan-02 Jan-03 Jan-04 Jan-05 Jan-06 Jan-07 Jan-08 0 10 20 30 40 50 60 70 Consumer confidence (lhs)
Price trends over last 12 months (rhs)
Source: Commission services.
Available data points to weak momentum in the other component of household spending, namely residential construction. Depending on the indicators considered, construction activity was either sluggish or contracting at the end of 2007 and the fall in residential building permits has accelerated since the beginning of 2007. Confidence in the construction sector has been on a clear downward path since the autumn and ECB data points to a steady easing of residential property prices. These negative developments
must however be interpreted against the background of robust growth in mortgage lending. The rate of expansion of mortgage lending has come down from its peak in 2006 but continues to be strong with the latest data showing stable annual growth at 7.0% in January.
…but also of world trade
Weaker global growth, on the back of the financial market turmoil and the US slowdown, is now clearly weighing on world trade. Indeed, world trade has softened further in the last quarter of 2007. According to the CPB indicator, q-o-q world trade growth decelerated from 2.6% in 2007Q3 to 0.6% in 2007Q4. The loss in import momentum was broad-based although sharper in industrialised countries than in emerging markets.
The softening of the world trade momentum, together with the appreciation of the euro, are weighing on euro-area exports but the extent of these effects is difficult to gauge. Euro-area q-o-q export growth decelerated sharply from 2.1% in 2007Q3 to 0.5% in 2007Q4 but quarterly data tend to be volatile and the deceleration in exports was accompanied by a drop in imports (-0.4% q-o-q in 2007Q4). As a result, net exports contributed strongly to GDP growth in 2007Q4 (0.4 pp). As euro-area exports in national accounts cover both intra- and extra-area exports, it is difficult to say to what extent the slowdown in the fourth quarter reflects weakness in domestic or external demand. But manufacturing data suggests that domestic factors have dominated. First, in recent months, business confidence has weakened more markedly in services (which are less exposed to trade) than in the manufacturing sector. The January reading of industrial production was actually rather strong with y-o-y growth at 3.8%. Second, in the first 2008 issue of the European
(Interim forecast February 2008) (1)
Quarterly GDP forecast
(%, quarter-on-quarter) Annual GDP forecast(%, year-on-year) 2007
2008/1 2008/2 2008/3 2008/4 forecast Nov. Autumn 2007
Interim forecast Feb. 2008
Germany 0.1 0.3 0.4 0.4 2.1 1.6
Spain 0.6 0.6 0.5 0.5 3.0 2.7
France 0.3 0.4 0.3 0.3 2.0 1.7
Italy 0.1 0.2 0.3 0.3 1.4 0.7
Euro area 0.3 0.3 0.4 0.4 2.2 1.8
(1) Where possible, the quarterly growth rates are working-day and seasonally-adjusted, whereas the annual projections are unadjusted.
[image:10.595.70.283.434.607.2]Commission's quarterly manufacturing survey, companies reported a rebound of export expectations for the months ahead.
Graph 5: World trade
(y-o-y % changes in volume ; 2001Q1 – 2007Q4)
-6 -4 -2 0 2 4 6 8 10 12
Jan-01 Jan-02 Jan-03 Jan-04 Jan-05 Jan-06 Jan-07
Source: Commission services
Looking ahead, surveys of the global economy point to a period of further moderation in trade growth in the coming months. The February reading of the quarterly World Economic Survey shows a further weakening of the current global economic situation but also a deterioration of its expectation component. In a similar vein, the February reading of the Global PMI indicator showed confidence in the global manufacturing sector at its lowest level since July 2003.
Capital spending, however, is holding up fairly well
A comforting development in the latest national accounts data was the continuation of strong growth in investment spending. Gross fixed capital formation increased by 0.8% q-o-q and contributed by 0.2 pp. to GDP growth. As developments in residential construction are likely to have been sluggish at best, the strong reading of investment can be primarily ascribed to the corporate sector.
The strength of business investment is also visible in recent loan data. The annual growth rate of loans to non-financial corporations stood at 14.6% in January, up from 14.5% in December, the highest rate since 1990. Although the strong reading may partly reflect a re-intermediation process in the wake of the
financial turmoil, this effect is likely to have remained small. 3
The resilience of investment can be explained by high capacity utilisation and the healthy financial position of the non-financial corporate sector. Capacity utilisation in the manufacturing sector, which has declined only slightly since the peak in the summer of 2007, remains well above its long-term average (83.9%). The profit share of non-financial corporations in the euro area has remained high (39.4% in 2007Q3).
Graph 6: Business confidence indicators, euro area (Balance in % – Jan 2000 – Feb 2008)
-1.5 -1.0 -0.5 0.0 0.5 1.0 1.5 2.0
Jan-00 Jan-01 Jan-02 Jan-03 Jan-04 Jan-05 Jan-06 Jan-07 Jan-08 -10 -5 0 5 10 15 20 25 30 35 Business climate indicator (lhs)
Service confidence indicator (rhs)
Source: Commission services.
Another factor which has supported investment spending is the fact that confidence in the manufacturing sector has generally held up fairly well in recent months. The IFO indicator has remained broadly stable in the past four months thanks to a stable assessment of both current conditions and business expectations. The Reuters PMI index for manufacturing activity has also remained broadly stable in the past few months. That neither the IFO nor the PMI shows a downward trend in expectations despite strong headwinds (financial markets, the US slowdown, etc.) is encouraging. In contrast, however, the European Commission's manufacturing survey has recently painted a more negative picture. It has pointed to a downward trend since April 2007 and has continued to decline in the past three months. Nevertheless, the latest reading remains at a fairly high level, consistent with moderate growth in the manufacturing sector.
Box 1: The impact of higher oil prices – simulations with the new version of the Commission's Quest model
This box revisits the issue of the macroeconomic impact of oil prices on the basis of new model simulations.(*) The simulations were run with the latest version of ECFIN's macroeconomic QUEST model. QUEST Version III is a new multi-region model that includes an energy production sector and in which energy serves as an intermediate input in final good production.(**) The euro area and the other EU Member States, as well as the US and Asia, are modelled as net importers of oil and gas, while the rest of the world is the oil-exporting region. As European natural gas prices are de facto indexed to oil prices with a lag of up to six months, the model treats oil and gas together as one aggregate. The model treats the relative oil price as exogenously determined.
Oil price shocks affect the economy through supply and demand channels. As terms-of-trade shocks, they have an impact on the economy through their effect on production decisions and relative prices. But oil price shocks also represent a shift in purchasing power between oil-exporting countries and oil-importing countries. An increase in energy prices leads to a loss in real income in oil-importing countries and affects consumers' and firms' spending on goods and services other than energy. The demand effects through this income channel are key to explaining the potentially significant impact of oil price changes on the economy. The model captures both supply and demand channels as energy serves as an input in the production process and is consumed directly by households.
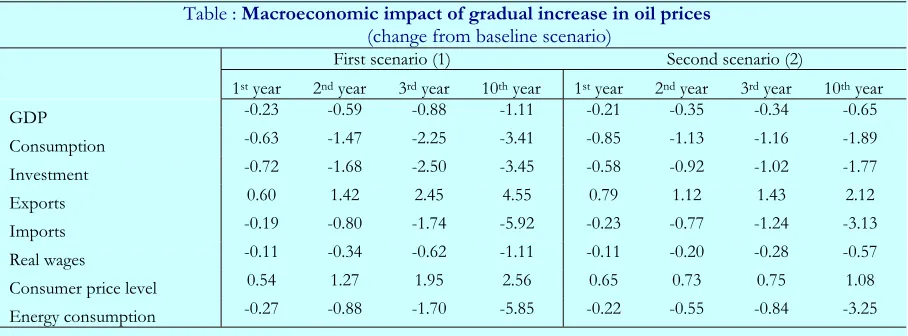
The table below presents two sets of simulations. The first one shows the impact of a gradual increase in oil prices of 100% over a period of three years. This broadly corresponds to the increase registered between mid-2004 (€29 based on quarterly averages) and end-2007 (€63 based on quarterly averages). The second scenario takes the previous simulation as a new baseline and shows the effects of a further oil price increase of 25%. It illustrates the non-linearities that characterise the growth effects of oil prices.
Table : Macroeconomic impact of gradual increase in oil prices (change from baseline scenario)
First scenario (1) Second scenario (2)
1st year 2nd year 3rd year 10th year 1st year 2nd year 3rd year 10th year GDP -0.23 -0.59 -0.88 -1.11 -0.21 -0.35 -0.34 -0.65 Consumption -0.63 -1.47 -2.25 -3.41 -0.85 -1.13 -1.16 -1.89 Investment -0.72 -1.68 -2.50 -3.45 -0.58 -0.92 -1.02 -1.77
Exports 0.60 1.42 2.45 4.55 0.79 1.12 1.43 2.12
Imports -0.19 -0.80 -1.74 -5.92 -0.23 -0.77 -1.24 -3.13 Real wages -0.11 -0.34 -0.62 -1.11 -0.11 -0.20 -0.28 -0.57 Consumer price level 0.54 1.27 1.95 2.56 0.65 0.73 0.75 1.08 Energy consumption -0.27 -0.88 -1.70 -5.85 -0.22 -0.55 -0.84 -3.25
1) the impact of a gradual increase in oil prices of 100 percent; 2) the impact of a further increase in oil prices of 25%
In the first scenario, real GDP falls by 0.9% below baseline after three years and slightly more than 1% after 10 years. The impact on consumption is much stronger, 2% lower after three years and 3% after 10 years. Investment declines by 2.5% after 3 years and 3.5% after 10 years. The increase in energy prices does not have a significant impact on energy consumption in the short run due to the small short-run elasticities of substitution, but energy consumption by households is 6% lower after ten years. The pass-through into consumer prices builds up gradually. Inflation picks up by 0.5 pp the first year and by 0.7 pp the second and third year so that consumer prices are 2% higher after three years. The current account deteriorates by up to 1.9% of GDP after three years due to the increasing deficit on the oil balance, but the non-oil balance improves due to higher exports to oil-exporting countries (recycling of oil revenues) and a depreciating exchange rate.
[image:12.595.71.525.387.555.2]In the second scenario, the negative impact on real GDP is around 0.2% in the first year, rising to 0.7% after 10 years. The shock raises inflation and consumer prices are 0.8% above base after 3 years. This is substantially higher – and proportionally so – than the impact on GDP and inflation in the first scenario, indicating that the effect of oil price shocks is non-linear, i.e. larger when the starting price level is higher. A 25% price hike when oil prices are already at €60 per barrel represents a larger shock in euros than when oil prices are at €30 per barrel. This leads to a stronger income effect and a relatively larger impact on demand.
As is the case with any simulations, the results of the simulations presented here should be interpreted with prudence as they are model-dependent and sensitive to some modelling assumptions. In that respect two sources of uncertainties should be highlighted. First, the impact of oil price shocks on the economy depends crucially on how wages respond to the worsening of the terms-of-trade. The increase in consumer prices puts upward pressure on wages, but lower economic activity reduces wage demands and counteracts this. The overall effect on wages is the net outcome from these opposing forces. In the default setting of the model, wages decline (relative to the baseline growth) in line with the fall in productivity. However, earlier experiences of large oil price shocks have shown that there can be strong resistance to such wage flexibility and wage demands could rise in response to sharp increases in energy prices. If wages were to rise, output and employment losses could be much larger. Second, the magnitude of the effects of oil price shocks on the economy also depends on the price elasticity of oil demand. If it is easier to substitute away from energy, the real impact on the economy will be smaller.
(*) For previous assessments of the impact of oil prices on the economy see:
European Commission (2004), 'How vulnerable is the euro-area economy to higher oil prices?', Quarterly Report on the Euro Area, Vol. 3 No. 2. European Commission (2005), 'The impact of higher oil prices on inflation', Quarterly Report on the Euro Area, Vol. 4 No. 4.
(**)QUEST III belongs to the modern class of Dynamic Stochastic General Equilibrium (DSGE) models that now serve as the foundation for macroeconomic policy analysis.
Commission's Interim Forecast points to a significant deceleration of growth in 2008
According to the Commission’s Interim Forecast of February 2008, economic growth in the euro area is expected to slow down to 1.8% for 2008 as a whole. This represents a 0.4 pp downward revision compared with the 2.2% projected in the 2007 Autumn Forecast. The revisions mainly reflect the impact of the ongoing financial turmoil, the sharp slowdown in the US and high commodity prices (for an assessment of the impact of high oil prices see model simulations presented in Box 1). The hard and soft data released since the publication of the latest interim forecast are consistent with these projections.
2. The Great Moderation in the euro
area: what role have economic policies
played?
Most OECD countries have experienced a sharp reduction in both output growth volatility and inflation volatility over the past three decades. In policy terms, a key issue is whether this ‘Great Moderation’ reflects a long period of luck in the form of milder shocks and could therefore be reversed rapidly or whether it is attributable to changes in the structures and the policies of the economies concerned and could thus be of a more permanent nature. Although there is not yet any firm consensus, in the case of the US economy – on which most of the empirical research has focused so far – several prominent authors have ascribed the dominant role to the good luck hypothesis.4 This note builds on
previous work presented in the Quarterly Report on the Euro Area and revisits, on the basis of an econometric panel analysis, the issue of what role changes in economic structures and policies have played in the great moderation.5
Key stylised facts
Over the past 30 years, the volatility of output has declined substantially in the euro area. When measured by the standard deviation of y-o-y GDP growth, it has dropped from over 2% in the 1970s to 1.1% in the most recent decade (1998Q1-2007Q3) (Graph 7). The decline was particularly pronounced in the late 1970s and early 1980s. It was brought to a temporary halt at the beginning of the 1990s but may have resumed its course in the 2000s.
A look at a range of GDP data for the euro area suggests some stylised facts and provides some clues as to the possible drivers of the Great Moderation in the euro area.
4 See for instance:
Stock, J. H., and M. W Watson (2003), 'Has the Business Cycle Changed? Evidence and Explanations', Federal Reserve Bank of Kansas City, pp. 9-56.
Gordon, R. J. (2005), 'What Caused the Decline in U. S. Business Cycle Volatility?', NBER Working Papers 11777.
5 See European Commission (2007), 'The reduced volatility of output growth in the euro area', Quarterly Report On the Euro Area, Vol. 6 No. 1; and European Commission (2007), 'The decline of inflation volatility in the euro area', Quarterly Report on the Euro Area, Vol. 6 No. 4.
First, the decline in growth volatility has been broad-based, affecting to various degrees all GDP components and most industrial sectors. This seems to rule out explanations exclusively centred on one or a few segments of the economy. Nevertheless, volatility has decreased more sharply in the most volatile segments of the economy, notably inventories (when looking at the composition of demand) and manufacturing (when looking at industrial sectors).
Graph 7: The volatility of GDP growth, euro area and US (standard deviation of y-o-y growth in % - 5 year
window – 1975Q4-2007Q3)
0 1 2 3 4
1975Q4 1979Q2 1982Q4 1986Q2 1989Q4 1993Q2 1996Q4 2000Q2 2003Q4 2007Q2 EA US
Source: Commission services.
Second, shifts in the composition of GDP have played only a modest role in the fall in growth volatility. The shares of GDP components have not changed sufficiently to affect noticeably the standard deviation of total growth. Shifts in the industrial structure, with the increasing importance of the most stable service sector, have been a more significant stabilisation force but this effect has remained rather limited. Third, the decomposition of GDP into its productivity and employment components indicates that the rise in output stability is attributable to lower volatility in productivity but not in employment. There has also been a decrease in the correlation between employment and productivity which could be an indication that changes in the functioning of the labour markets have helped to stabilise output.
Fourth, the moderation of output growth volatility has been accompanied by a decline in the level and volatility of inflation, which suggests that changes in the conduct of monetary policy have played a critical part.
magnitude and timing of the decline have differed substantially from one to another. This heterogeneity casts some doubts on explanations focusing exclusively on common shocks. Somehow, both changes in shocks and changes in economic policies and structures must have been at play.
Graph 8 illustrates country differences in the magnitude of the Great Moderation. The graph displays estimates of inflation and output volatility in a number of OECD countries for the 1970s (left panel) and the last ten years (right panel). Most countries now show a relatively similar performance in terms of growth and inflation volatility. In the 1970s, however, the range of performances was considerably larger. While most OECD countries have benefited from a drop in volatility over the past three decades, the drop has been comparatively much larger in countries which had very high volatility in the 1970s (e.g. EL, IT, NZ, PT, UK) than those where volatility was comparatively lower (e.g. DE, NL, US).
Macroeconomic policies and output stability
Changes in the conduct of macroeconomic policies over the pas three decades have been most visible in the area of monetary policy. The associated improvements in the efficiency of monetary policy are measurable against a broad range of indicators, including more counter-cyclical interest rates, an increased stability of inflation expectations and an improved trade-off between output and inflation volatility. Graph 9, for instance, displays the first-order autocorrelation coefficient of inflation (based on
the GDP deflator) for the 1970s and the most recent decade. The autocorrelation coefficient has dropped in most OECD countries pointing to a decrease in the persistence of inflation. Likely explanations include reduced inflation indexation and a shift from backward to forward looking inflation expectations in relation with a strengthening of the credibility of monetary policy. Interestingly, countries which have shown comparatively larger drops in the persistence of inflation have also tended to register larger falls in output volatility.
Graph 9: Autocorrelation of inflation (first-order autocorrelation coefficient in %) (1)
0.0 0.2 0.4 0.6 0.8 1.0 1.2
AT BE DE ES FI FR GR IE IT NL PT DK SE UK AU CA CH JP NZ US 1971-1980 1998-2007
(1) Inflation is calculated on the basis of the GDP deflator.
Source: Commission services
Evidence of the contribution of fiscal policy to the Great Moderation appears a priori more mixed. On the one hand, although the propensity to 'stop and go' has been considerably reduced, there are indications that discretionary fiscal policy retains pro-cyclical features in many OECD countries. On the other hand, empirical evidence points to a positive effect on output Graph 8: Inflation and output growth volatility
(standard deviation for the period in %)
1970-1979 1998-2007 NZ AU CH CA JP US UK SE FI PT AT NL IT FR ES EL IE DE DK BE 0.0 0.5 1.0 1.5 2.0 2.5 3.0 3.5 4.0 4.5 5.0
0 2 4 6 8 10
Inflation volatility G D P v ola tilit y NZAU CH CA JP UK SE FI PT AT NL IT FR ES EL IE DE DK BE 0.0 0.5 1.0 1.5 2.0 2.5 3.0 3.5 4.0 4.5 5.0
0 2 4 6 8 10
Inflation volatility G D P vo la tilit y
stability of the rise in government size observed in many OECD countries in the 1970s and 1980s, which could be an evidence of an increase in the smoothing power of automatic stabilisers.6
Structural policies and output volatility
Economic theory does not provide clear guidance as to the effects of product or labour
market rigidities on output stability. Some forms
of rigidities may dampen the initial impact of a shock but lengthen the ensuing adjustment phase with the net effect on output volatility remaining theoretically undetermined. The empirical literature on this subject is very limited, consisting – to the best of our knowledge – of a single study reporting a negative link between regulation and volatility.7
Trade integration can affect output volatility via
several, sometimes conflicting, channels. Increased trade integration means that a larger part of country-specific shocks are smoothed by being transferred to trading partners. However, trade integration may also foster production specialisation and therefore the occurrence of country-specific shocks. Empirical evidence for industrialised countries is relatively sparse and has so far failed to establish a significant link.8
By improving opportunities to diversify and share risks, financial liberalisation allows better consumption smoothing and should thereby help curb output volatility. Nevertheless, financial liberalisation may also facilitate production specialisation and therefore increase the risk of sectoral shocks. Furthermore, historical evidence also shows that phases of financial liberalisation may be associated with temporary spells of
6 Fatás, A. and I. Mihov (2001), 'Government size and automatic stabilizers: international and intranational evidence', Journal of International Economics, Elsevier, vol. 55(1), pages 3-28, October.
7 Kent, C., K. Smith and J. Holloway (2005), 'Declining output volatility: What role for structural change?, RBA Research Discussion Papers, 2005-08.
8 See Cecchetti, S. G., A. Flores-Lagunes and S. Krause (2006), 'Assessing the sources of changes in the volatility of real growth', NBER Working Papers 11946, National Bureau of Economic Research;
Kent et al. (2005), op. cit.;
Buch, C., J. Döpke. and C. Pierdzioch (2002), 'Financial openness and business cycle volatility', Kiel Working Papers 1121, Kiel Institute for the World Economy.
increased volatility as economic agents take time to come to grips with the full implications of the new financial environment. The few studies which have explored the question empirically have generally reported a positive link between financial developments and output stability.9
Results of a panel analysis
This section provides some quantitative substance to the discussion of the previous section by summarising the results of an econometric analysis of the determinants of output, consumption and investment volatility in a panel of 20 OECD countries. The econometric work is presented in more detail in Box 2.
One of the most critical findings of the regression work is that it brings support to the idea of a significant impact of macroeconomic policies on output volatility. Both monetary policy and fiscal policy – the latter via automatic stabilisers rather than discretionary policy – can help explain country differences in volatility developments over the past three decades.
The regression results suggest that changes in monetary policy have contributed to the Great Moderation process in OECD countries. The estimated contribution is particularly large in some euro-area Member States (e.g. EL, ES, IT, PT, FI) where monetary policy mismanagement was particularly acute in the 1970s. In these countries monetary policy could account for as much as 25 to 40% of the drop in output volatility. In contrast, the contribution of monetary policy is found to be small in the US – in line with past research on that country – as well as in Germany.
As regards budgetary policy, output growth volatility is found to be negatively correlated with the ratio of government expenditure to GDP, in line with results reported in Fatas and Mihov (2001). Provided that the size of government and the smoothing power of automatic stabilisers go hand in hand, this can be interpreted as evidence of a role of automatic stabilisers in the Great Moderation process. However, the relationship between government size and output stability
appears to be non-linear. According to point estimates, the effect of government size on stability is positive up to a ratio of government expenditure to GDP of 50% and turns negative above this level.10 Overall, the contribution of
government expenditure/automatic stabilisers to the drop in GDP volatility over the past three decades is found to be large only in few countries, mostly located in the euro area (e.g. EL, ES and PT). Finally, tests with a range of alternative public finance variables, including measures of the counter-cyclicality of discretionary fiscal policy, were unsuccessful. Hence, possible changes in the conduct of discretionary fiscal policy do not seem to have contributed sizeably to the rise in output stability.
By providing a framework geared at macroeconomic stability, EMU has helped to stabilise growth in euro-area Member States. In the regressions, this EMU effect is mostly captured by the monetary policy variable and can be related to the comparatively large role played by changes in monetary policy in some Member States. The regressions provide only mixed evidence of a specific role of EMU in addition to what is already encapsulated in the monetary policy variable. Tests with various dummies for participation in EMU and/or ERM generally indicate a positive but non-significant additional effect of monetary integration on the stability of GDP growth. In contrast, there is some indication that participation in ERM and EMU is associated with reduced consumption and investment volatility although further work would be needed to reconcile these results with the lack of impact of the variable in the case of GDP volatility.
The shift of production to services comes out as a significant regressor but the contribution of the variable to the fall in output volatility since the 1970s does not exceed 10-15% in those
10 Such a non-linear relation was first estimated empircally in Debrun, X., J. Pisani-Ferry and A. Sapir (2007), 'Government size and output volatility: Should we forsake automatic stabilization?', Paper presented at the workshop 'EMU@10: Achievements and challenges', DG ECFIN, November 2007.
For a theoretical explanation of this non-linearity, see Buti, M., C. Martinez-Mongay, K. Sekkat and P. van den Noord (2003), 'Automatic fiscal stabilisers in EMU: a conflict between efficiency and stabilisation?', CESifo Economic Studies, Vol. 49, 1.
countries where the shift has been the most pronounced (e.g. EL, FR, NL, UK and AU). The only exception is Germany, where the contribution reaches 30%. In contrast with most of the literature on this subject, openness to trade is found to be positively correlated with output volatility. But the effect is very small. Whereas conventional wisdom tends to give a prominent role to oil shocks in explanations of the high macroeconomic volatility of the 1970s and early 1980s, the hypothesis finds only mixed support in the panel regressions. Its effect is not statistically significant in the case of GDP volatility but it emerges as an important explanatory variable for the volatility of consumption growth. Thus, swings in oil prices could be a key source of consumption volatility while their impact on GDP volatility is limited as it depends on a range of other factors such as the credibility of monetary policy.
More stringent product market regulations are associated with lower output growth volatility. The result should however be considered with prudence as it appears statistically less robust than that for the macroeconomic policy variables. In addition the indicator of product market regulation used in the regression covers only some service sectors.
Likewise, results on financial liberalisation are mixed. The variable is not a statistically significant explanatory variable of GDP or consumption volatility but stands as a meaningful regressor in the case of investment. This could be an indication that financial liberalisation has so far contributed more to smooth investment than consumption or GDP. Nevertheless, caution is warranted as the proxy used for financial liberalisation is not very satisfying although widely used in the empirical literature.
Overall, the variables included in the regressions explain about 50% of the decline in output volatility since the 1970s, the rest being accounted for by time-fixed effects.11 Most of the
share is attributable to macroeconomic policy variables with monetary policy playing a leading role. The explanatory power of the model is somewhat higher for the euro area – particularly
Box 2: Quantifying the sources of the decline in output growth volatility
This box presents the results of a panel data exercise aimed at quantifying the possible contributions of a number of determinants to the decline in output volatility in OECD countries. Output growth volatility is regressed on a range of variables, including both structural and economic policy indicators. As regards structural changes, the main variables tested are: (i) the sectoral shift in production towards services (measured by the share of value added in the service sector in total value added); (ii) the degree of openness to international trade and (iii) changes in the exposure to oil prices. Economic policy variables include measures of changes in macroeconomic policies, both (iii) monetary policy and (iv) fiscal policy, as well as indicators aimed at capturing changes in structural policies in terms of (v) financial markets and (vi) regulation in the product markets.
The regression is estimated on a panel of 20 countries (the former EU15 Member States – except LU – US, JP, CA, AU, CH and NZ) with time- and country-fixed effects added when statistically appropriate. The analysis is carried out for the period 1973-2007 broken down into 7 sub-periods of 5 years each (1973Q1-1977Q4, 1978Q1-1982Q4, etc.). Volatility is measured as the standard deviation of year-on-year quarterly changes in the variable considered. Regression results are presented in the table below. The endogenous variable is the volatility of, respectively, GDP growth (Col. 1 and 2), consumption growth (Col. 3) and investment growth (Col. 4). All equations are estimated with time effects but country-fixed effects are found to be jointly non-significant in the case of the main specification (Col. 1), which is therefore estimated without them. Nevertheless, given that the test of statistical significance of the country-fixed effects does not point to a strong rejection of these effects, the equation obtained with country-fixed effects is also shown (Column 2) to allow to check the sensitivity of the results to the inclusion of country effects.
The sources of growth volatility – Results of a panel regression
Endogenous variable: GDP volatility
(no country FE)
GDP volatility (with country FE)
Consumption volatility Investment volatility
(1) (2) (3) (4)
Monetary policy variable 0.008 *** 0.007 *** 0.009 **
Gov. expenditures -0.200 *** -0.138 **
(Gov. expenditures) ^2 0.002 *** 0.001 *
Share of services in VA -0.025 ** -0.046 *
World trade volatility x trade openness 0.040 **
Participation in ERM / EMU -0.630 * -1.901 *
Ratio of private sector credit to GDP -0.022 *
Index of product market regulation -0.341 ***
Energy intensity x oil price volatility 8.511 **
Country fixed effects No Yes Yes Yes
Period fixed effects Yes Yes Yes Yes
Number of observations. 125 125 113 121
Notes – Estimation method: panel OLS regressions.***, **, * denote, respectively, statistical significance at 1, 5, and 10% level (based on White robust estimates of standard deviations).
The regressions include two dummies to cater for, respectively, the high level of growth volatility generally registered in Greece (only Col. 1) and the extreme volatility brought by the recession of the early 1990s in Finland (Col. (1) to (4)).
The monetary policy variable is calculated as the distance between the real interest rate gap (i.e. the actual real short-term interest rate minus the equilibrium real interest rate) and a weighted sum of deviations of inflation and GDP from their respective trends. A high level of the variable suggests that the level of the real rate is not in line with developments in inflation and the output gap. Regression results show a positive and significant effect of the variable on volatility, i.e. inadequate interest rates are associated with higher output volatility. The contribution of the monetary policy variable to growth volatility was particularly high in the 1970s and early 1980s in some countries (EL, ES, IT, PT, FI) pointing to inadequate monetary policies in those countries for that period. Tests with various dummies for participation in EMU and/or ERM generally indicate a positive but non-significant effect of monetary integration on the stability of GDP growth (this is in addition to the EMU effect already captured in the monetary policy variable). In contrast, participation in ERM and EMU – as captured by a dummy variable with a value of 1 in case of participation in either ERM or EMU – is associated with reduced consumption and investment volatility and the size of the estimated effect is far from negligible. However, even in the case of consumption and investment, there is no evidence that EMU has played a stronger role than ERM.
significantly associated with lower output volatility, suggesting a positive relationship between government size and the smoothing power of automatic stabilisers. The relationship appears, however, to be strongly non-linear. A test with a quadratic term points to a threshold for the share of government expenditure in GDP of about 50% (with a likely range of about 46% to 54% given estimated standard deviations). Above this threshold, an increase in government size is associated with an increase in GDP growth volatility. The threshold is slightly lower in the second specification in Column (2) (at 47%).
Looking at the coefficients of the variables capturing structural changes, the services indicator comes out significant and negative. However, the effect remains small: point estimates suggest that a 10% increase in the share of services in GDP results in a 0.3 percentage point decline in output growth volatility. Trade openness displays a positive but small sign. A country with a higher degree of openness faces higher output volatility but the effect is marginal. The coefficient on the oil intensity variable has the expected sign (i.e. an increase in oil intensity leads to higher output volatility in periods of swings in oil prices) but is not statistically significant in the case of GDP volatility. It only becomes meaningful in the consumption equation.
Finally, the two variables aimed at capturing changes in structural policies, i.e. the ratio of private-sector credit to GDP and the indicator of product market regulations, are both found to be statistically insignificant in the main regression (Column 1). There is, however, some evidence that increased financial developments have played a role in the reduction of investment growth volatility but the investment regression is not very robust statistically and the result should be viewed with caution. The index of product market regulation (PMR) is found to be negatively associated with GDP volatility (i.e. more regulations reduce volatility) but only in the specification which includes country-fixed effects. Furthermore, the PMR index (compiled by the OECD) only covers services. Again the result should be considered with considerable prudence and deserves further exploration.
southern Member States – than for the rest of the OECD, and is rather weak for the US.
Finally, it is worth stressing that estimation results suggest that it is difficult to interpret time effects purely in terms of shocks (good luck hypothesis). The estimated time effects show a clear and steady downward trend which suggests that they capture both common shocks and some missing explanatory variable. An obvious potential candidate for the latter would be the improvement in the management of inventories. There is indeed some correlation between the estimated time effects and the reduction of the contribution of inventories to GDP volatility as computed on the basis of the GDP accounting identity. Another potential candidate is financial market development which, due to lack of proper data, has only been crudely captured in the estimations.
Conclusion
Expanding on past Commission work on this issue, this section has looked into several drivers of the Great Moderation in OECD countries. Panel econometric analysis points to a significant role for changes in macroeconomic policies, particularly through more credible monetary policy but also possibly through an increasing smoothing power of automatic stabilisers. It also
indicates that changes in economic structures such as the rising weight of services in production, increased trade openness and reduced oil exposure have made little or no contribution.
An attempt to quantify the possible impact of the liberalisation of financial and product markets leads to mixed results. There is some evidence that product market liberalisation is associated with lower output stability while financial liberalisation helps enhance investment stability. These two results seem, however, somewhat less statistically robust than those listed above, something which may be explained by the low quality of the indicators used.
3. Recent labour market reforms in the
euro area: characteristics and
estimated impact
The recorded pace of structural reforms since the introduction of the euro has been somewhat mixed.12 The advent of the third stage of EMU
did not coincide with an acceleration of labour market reforms but with a continuation of reform strategy characterised by incremental reforms (i.e. a sequence of small changes), broadly heading towards better labour market adjustment capacity. A more in-depth analysis of labour market reforms enacted under the euro can be conducted using the LABREF database.13
This section describes the reforms enacted in the euro area in various areas. Based on the chronology of reforms, it explores the effect of certain policy measures taken for groups with low labour market attachment on the average employment and participation rates and their response over the cycle.
Labour market reforms enacted in the euro area
The structure of LABREF can be used to analyse the distribution of measures enacted between 2000 and 2006 by areas of policy intervention (Graph 10) and design characteristics (Graph 11). For the euro area as a whole, the majority of measures have been in the area of active labour market policies, taxation, unemployment and welfare-related benefits and pensions (Graph 10). Compared to the recently-acceded Member States, relatively few initiatives have been taken in the euro area in the area of employment protection legislation. About 15% of all reforms enacted in the euro area were in the area of pensions. As shown in Graph 11, a large number
12 A review of different arguments in support of (or against) a
change in the pace of structural reforms after the euro and some recent evidence can be found in QREA 2007 (Vol. 6 No 4).
13 LABREF is an inventory of labour market reforms jointly
managed by DG ECFIN and the Economic Policy Committee. It is a tool that provides a comprehensive description of qualitative features of the reform process, including the design of enacted reforms, their scope and durability. To date, the database covers the years 2000-2006 for the EU-27. Information for the year 2007 will be made available to the public in April 2008. The database can be freely accessed at:
http://ec.europa.eu/economy_finance/db_indicators/db_indica tors8638_en.htm.
For a description of LABREF, see European Economy Research Letter Vol. 1, Issue 3, November 2007.
of policy measures targeted specific groups, with no major differences between euro-area and non-euro-area countries. Finally, labour supply has been the main focus of policy intervention in a large number of countries. This reflects the prevalence of measures in the field of welfare benefits and pensions.
Graph 10: Distribution of labour market reforms by reform area
(in % of total reforms – 2000-2006)
0 5 10 15 20 25 30 Labour Taxation
Benefits ALMPs EPL Pensions Wage Bargaining
Working Time
Immigration Mobility Euro area 15
New Members States (excl. BG & RO) UK, SE and DK
Source: LABREF
Graph 11: Distribution of labour market reforms by reform characteristics
(in % of total reforms – 2000-2006)
0 10 20 30 40 50 60 70 80 Targeted (1) Embedded (2) Matching (3) Wages Labour supply Labour demand Euro area 15
New Members States (excl. BG & RO) UK, SE and DK
(1) Reforms targeting specific socio-economic groups. (2) Reforms embedded in a formal long-term policy programme. (3) Reforms aimed at a better match of the unemployed and vacancies.
[image:20.595.310.528.234.609.2]Source: LABREF
have made a positive contribution to the increase in labour utilisation, especially among groups with low participation rates, and enhanced the reallocation of labour.
Wage moderation has been observed since the launch of EMU. While this may have contributed to the improvements in the labour market trends registered so far, less clear is whether it has also made for a better response to country- and sector-specific shocks. In some countries, wage moderation has resulted from collectively agreed derogations to national contracts rather than from centrally-agreed income policies. This is particularly the case of Germany, where industry-level and company-industry-level collective agreements negotiated in the early 2000s paved the way for the introduction of long-term working time accounts and for a wide range of opening clauses, which allowed companies to deviate from collectively agreed standards. Similar agreements, leading to de facto decentralisation of wage bargaining, have also been registered to various degrees in Austria, the Netherlands, Spain and France.
Conversely, proper reforms of bargaining structures to make wage settlements respond
more to productivity gains at local and company level have been rare. More precise criteria to determine the general validity of collective agreements have been defined in Finland and France. In the latter country, the possibility was introduced at company level of departing from sector-level agreements. Changes in the collective bargaining procedure were also introduced in Portugal (2003), to enhance the responsiveness of wage settings to productivity and skill differentials across sectors. Some elements of flexibility have been introduced in the central income agreements in Spain and Slovenia to take account of productivity gains and local conditions on top of inflation.
Higher flexibility of working time organisation, either to reconcile work and family life or to adjust employees' working patterns more to the company's changing needs, has been observed in most euro-area countries. Measures in this field were either in support of labour supply – e.g. working parents (ES, AT), older workers (BE, DE, FR and AT) – or were intended to inject greater margins of flexibility into overtime schemes (EL, FR) and into working time arrangements (AT).
Table 4: Structural reforms in euro-area labour markets, 2006-2007
Policy area Main developments in the euro area as a whole Active labour market
policies •• Gradual shift from passive to active policies Shift towards more effective job search and early activation
• More focus on target groups
• Improved governance of public employment services (PES) and closer complementarities/ streamlining of PES activities with welfare benefit providers
Welfare benefits • Reducing the generosity and duration of unemployment benefits
• Tightening eligibility and availability to work criteria and reinforcing sanction mechanisms
• Increased use of in-work benefits to improve the work attachment of marginal workers
• Increased attention to family-related policies, including child-care support
EPL • Mainly increasing flexibility at the margin of the labour market with potentially detrimental segmentation effects
Taxation • Cuts in labour taxes targeting low-income levels to reduce inactivity and unemployment traps for low-income earners
• Reductions in social security contributions to boost labour demand, often targeting difficult to employ groups and older workers
Pensions • Little focus on reforms of early retirement, sickness and disability
• Some parametric reforms of pension systems and very few structural reforms, but substantial reform programmes (sometimes with gradual and long phasing-in) have been adopted in a number of Member States in previous years
Wage bargaining • Few efforts, mainly in Belgium, Germany and Spain, to make wages more responsive to sectoral and local cyclical conditions
Working time • Introduction of innovative working time arrangements, both to reconcile work and family life and to promote more flexible organisation of work at company level
Immigration and
mobility • Some measures to improve the integration of third-country nationals, to simplify the procedures for entry and regularisation or to develop a flexible employment permit system focusing on the economy’s skills and labour needs.
[image:21.595.81.521.104.406.2]Reforms of the tax and benefit systems allow time to be reallocated between market and non-market activities and labour supply to be sustained. Intervention in the benefit systems was inspired by the principle that the threat of losing benefits if a job offer is not accepted increases the incentive to search for a job. Thus, they have combined a lower level and shorter duration of benefits with tight availability-for-work criteria and more systematic controls and effective application of sanctions for refusal of suitable job offers. These measures were often supported by tax cuts, mainly targeting low incomes, and by more rigorous activation policies. Reforms have entailed, for instance, a sharp cut in the unemployment benefit maximum duration (NL) or substantial cuts in benefits (DE).
Some reforms of the tax systems were based on the idea that higher taxes and the withdrawal of means-tested benefits when income rises can be detrimental as to the decision to work longer hours and shift from part-time to full-time. Reductions in the marginal effective tax rate, at least for some family types at low to medium wage levels, have been obtained in Spain, France, Ireland, the Netherlands, Austria and Portugal. Reductions in the tax wedge have been adopted in Germany, Portugal, Austria and Ireland. In addition, cutting the tax wedge on labour has been a frequently used instrument to stimulate labour demand in the euro area. Targeted cuts in employers’ social security contributions have been introduced, usually on a short-term basis, to create incentives to hire those with the lowest probability of joining the labour market. Non-targeted reductions of employers' social security contributions were extensively used in Italy (to foster employment in regions with high unemployment rates) and in Spain (in case of conversion of fixed-term contracts into permanent ones). Substantial simplifications of the rebates of employers' social security contributions in favour of the lowest wage levels have been introduced in France and in Belgium.
In contrast, reforms of job protection legislation have been limited and piecemeal, mainly targeting flexibility for new entrants and marginal workers, while leaving the legislation on permanent employment unchanged. Finding a viable balance between flexibility and security
[image:22.595.312.526.325.410.2]also proved to be difficult on account of the complex interactions between institutions and the political sensitivity of the subject. As a significant exception to this general trend, important changes to job protection regulation were introduced in Slovenia in 2007. The lack of action observed in the field of employment protection legislation (EPL) seemed also to go together with substantial inactivity in the area of unemployment insurance in euro-area countries - such as Greece, Italy and Portugal - which have the most rigid EPL for open-ended contracts and the lowest level of protection in the market.14
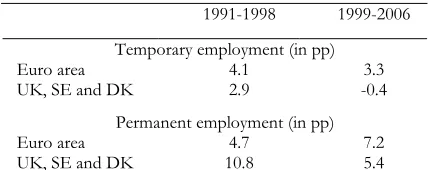
Table 5: Contribution of temporary and permanent employment to total average annual
employment growth (1)
1991-1998 1999-2006
Temporary employment (in pp)
Euro area 4.1 3.3
UK, SE and DK 2.9 -0.4
Permanent employment (in pp)
Euro area 4.7 7.2
UK, SE and DK 10.8 5.4
(1) The sum of the contributions of temporary and permanent employment for each group of countries gives the cumulated average employment growth over each sub-period based on the LFS. This can differ from the growth rate based on National Accounts.
Source:Commission services – Labour Force Survey.
As shown in Table 5, euro-area countries experienced a sizeable increase in employment after 1998, which took the form of both permanent and temporary work positions. Conversely, non-euro-area countries experienced an increase in employment only thanks to the increase in permanent employment. This different pattern is likely to have resulted from the ease of employment protection legislation for workers with a temporary contract and may be held responsible for an increasing labour market