Numerical investigation of the electric field
distribution induced in the brain by transcranial
magnetic stimulation
D.-H. Kim, N. Loukaides, J.K. Sykulski and G.E. Georghiou
Abstract: Results are presented on the prediction and optimisation of the electric field distribution obtained during transcranial magnetic stimulation (TMS) for deep neuron stimulation by using the finite-element method (FEM) in three dimensions. The effects of the geometrical models of the head on the distribution and penetration of the electric field induced in the brain during TMS are examined. For a magnetic field that can penetrate deeply and safely to activate the brain’s central structures, an iron core is introduced and its core shape is optimised using continuum design sensitivity analysis (CDSA) combined with the FEM. It is revealed that the incorporation of an accurate brain model in terms of shape as well as conductivity values is crucial for improved estimation of the field distribution. The introduction of an optimised iron core is shown to enhance the magnitude and localisation of the electric field induced inside the brain.
1 Introduction
There has been considerable interest over the years in the treatment of serious physiological and clinical conditions, such as depression and pain relief, by utilising electro-magnetic fields through transcranial electro-magnetic stimulation (TMS) of the human brain [1–5]. Most of the effort has recently focused on the attempt to stimulate neurons deep inside the brain mass and to limit any hazards posed by this treatment. However, present TMS delivery is somewhat crude and its energy efficiency of coupling to the brain is very low because the TMS stimulator is made out of a wire-wound coil, typically circular or in the shape of a figure of eight, or variations of these[4, 5], placed against the scalp. As a result, there is a need for new TMS coil configurations to generate sufficient and localised electric fields to achieve deep stimulation.
The advent of powerful computers and the emergence of more accurate models for the electric properties and shape of the human brain have enabled numerical modelling to become a significant and reliable tool for the design and optimisation of such new TMS devices to achieve these requirements. The experimental prediction of the electric field distribution is still a formidable task so simulation of the fields induced inside the brain is crucial in the optimisation and design of the stimulus coils.
This paper presents results on the simulation of TMS by using the FEM in three dimensions and looks at the effects
of the geometrical model of the head on the distribution and penetration of the electric field induced in the brain during TMS. To obtain sufficient and localised electric fields inside the brain, an iron core is introduced and its shape is optimised using the CDSA combined with the FEM [6, 7]. The results reveal that the incorporation of an accurate brain model in terms of shape as well as conductivity values is crucial for an improved estimation of field distribution. In addition, the stimulus coil with the optimised core demon-strates much better performance in terms of magnitude and localisation of the electric fields induced inside the brain.
2 Formulation
2.1
Field computation
The quasistatic approximation of electromagnetic fields generated inside the brain is valid for most biological tissues at low frequencies and linear material properties[1–3]and hence has been adopted here. The calculations of the three-dimensional electric field and current distributions induced in the brain have been performed by using the FEM and to reduce the computing time required without any loss of accuracy, the hybrid formulation has been implemented. In the air region linear tetrahedral elements have been used for the reduced scalar potential, whereas in the brain, quadratic tetrahedral elements have been employed for the magnetic vector potential.
2.2
Analytical sensitivity formula
Utilising the Lagrange multiplier method, the material derivative concept and the adjoint variable method, we have analytically derived the generalised design sensitivity formulas which have successfully been applied to the design optimisation of electrostatic and magnetostatic devices [6, 7]. An analytical sensitivity formula for steady-state eddy-current problems is developed, however a detailed expansion of the formula is omitted since it is somewhat complicated but otherwise a fairly routine process. Figure 1 illustrates the conversion relationship of the dual system of the CDSA in eddy current problems, which consists of the
D.-H. Kim is with the School of Electrical Engineering and Computer Science, Kyungpook National University, Daegu 702-701, Korea
J.K. Sykulski and G.E. Georghiou are with the School of Electronics and Computer Science, University of Southampton, Southampton SO17 1BJ, United Kingdom
N. Loukaides is with the Department of Engineering, University of Cambridge, Cambridge CB2 1BJ, United Kingdom
rIEE, 2004
IEE Proceedingsonline no. 20040861
doi:10.1049/ip-smt:20040861
primary and the adjoint systems. The optimisation of a local quantity distribution such as the electric field or eddy current in the region of interest, Of is mathematically formulated as shown in (1)–(3).
We minimise
F ¼
Z
Of
fðA1ÞdO ð1Þ
subject to
r ður AÞ josAþJs¼0 inO1;O2 ð2Þ
n ðr A2 r A1Þ ¼0
n ðu2r A2u1r A1Þ ¼0 on g
ð3Þ
where the subscripts 1 and 2 denote the two regions where the physical quantities are defined, respectively. In (1)fis an arbitrary function differentiable with respect to A. To deduce a design sensitivity formula and the adjoint system equation in a systematic way the variational of (2) including (3), referred to as the primary system, is added to (1) based on the augmented Lagrangian method. By taking the material derivative variation of a result of the procedure, called as the augmented objective function, an adjoint system shown in Fig. 1b, the counterpart of the primary system, is derived. Details can be found in[6, 7]. This gives r ður kÞ joskþf1¼0 inO1;O2 ð4Þ
n ðr k2 r k1Þ ¼0;
n ðu2r k2u1r k1Þ ¼0 ong ð5Þ
wheref1¼[@f/@Ax,@f/@Ay,@f/@Az] represents the pseudo-electric current in the adjoint system andk is the complex vector interpreted as the adjoint variable. The adjoint system is the core of the CDSA as the design sensitivity is computed ultimately by usingAandk.
Finally, the continuum sensitivity formula takes the surface integration form along the movable part ofg, which
is assigned for the design variables
dF=dp¼
Z
g
½ðu1u2Þr A1 r k2
þjoðs1s2ÞA1k2 ðJ1J2Þ k1ndG
ð6Þ
wherepis a vector of design variables. The three integrands on the right-hand side of (6) contribute to the sensitivity coefficients only when the design variables experience the difference of permeability, conductivity and current density across the interface boundary g.
2.3
Implementation of FEM and CDSA as a
design tool
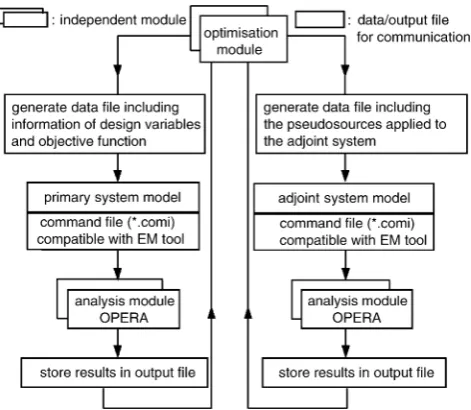
The derived formula (6), combined with a general FEM code, such as OPERA in this case, is used to compute the design sensitivity. A program architecture consisting of two independent modules as shown in Fig. 2 is employed. The optimisation module controls the overall design procedure and evaluates crucial quantities such as objective function, adjoint load term, and design sensitivity. The purpose of the analysis module is to estimate the performance of the dual system and to execute the command files that include the complete specification of the design model. The two modules are constantly communicating with each other and exchanging information about design variables, regions of interest and state variables through the data/output files. The sensitivity coefficients are evaluated from the analytical formula (6) using the two postprocessing output files of the dual system.
In Fig. 2, at every iterative design stage, the flow of the program makes two loops successively: the left loop for solving the primary system and then the right for the adjoint system.
3 Results
3.1
Effect of head shape
To look at the effects of the geometrical shape of the head, two different models have been used. The first is the traditional sphere model (HM 1) of radius 10 cm adopted in the majority of studies involving intracranial distribution of the induced electric fields and the second one (HM 2) incorporates different radii along the three axes as shown in
Fig. 1 Dual system of CDSA aPrimary system
bAdjoint system
[image:2.595.51.281.31.317.2] [image:2.595.312.548.378.583.2]Fig. 3. The stimulator consists of a 30-turn circular coil placed 2.0 cm above the vertex of the two models with a cross section of 1.01.0 cm and effective radius of 2 cm. The coil is excited with an amplitude of 1 A and frequency of 10 kHz. The homogeneous and isotropic conductivity of 0.4 S/m is assumed here.
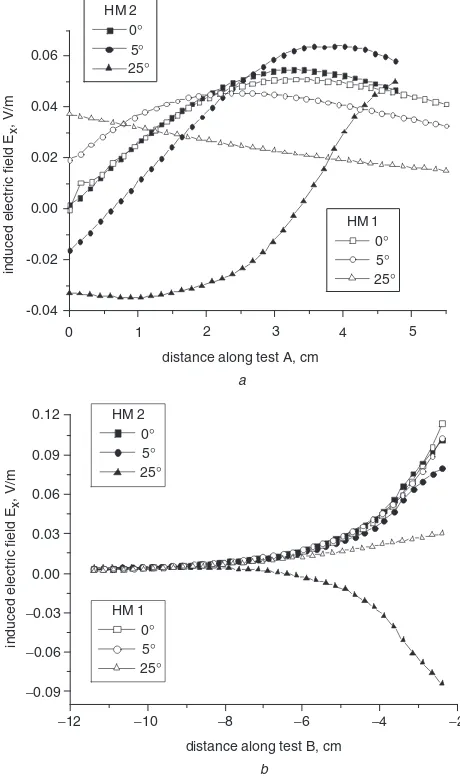
Figure 3 shows the induced electric field distribution over the surface of HM 2 when the coil is tilted by 251against the rotating axis parallel to thex-axis and passing through the centre of the brain located at (0,0,12 cm). It can be seen that the presence of ears in the head model affects the flow of the induced fields on the surface of the head. The effect of the tilting angle on the two head models is depicted in Fig. 4 where a major component of the electric field induced along the two test lines is parallel to thex-axis. It is apparent that the outer shape of the head model significantly alters the directions as well as the distributions of the electric fields induced inside the brain. As the tilting angle increases, the difference in the distribution and the direction of the field obtained by the two head models increases, as can be seen clearly in the case of the tilting angle of 251.
3.2
Shape optimisation of iron core
To obtain sufficient and localised electric field inside the brain an iron core inserted into the stimulus coil is thought to be the best choice in terms of degree of focusing, combined with simplicity and ease of use, rather than searching for a combination of several coils such as the slinky coil, butterfly coils etc, used by other authors[4, 5]. By means of the FE simulation it is ascertained that the electric field generated by a stimulus coil with a cylindrical core (without any use of optimisation) shown in Fig. 5 is increased by nearly two times compared with the coreless coil. This is effectively caused by the increase in flux linkage passed through the coil. However, to penetrate and concentrate the field deeply and locally into the brain the optimum shape of the iron core is still required. To achieve this, the optimisation algorithm described earlier is applied to the initial design model with HM 1 as shown in Fig. 5, where the effective centre of the coil is 4.0 cm above the vertex of the head.
The initial design goal is to produce the required electric field distributed over the 15 objective regions, which is chosen to be stronger by 30% than the initial field distribution and to have the maximum field position shifted towards the centre of the coil by 5 mm. A total of 13 grid points forming the bottom line of the core are selected as
design variables and allowed to move in they andz-axes. To facilitate the conformity of the FE mesh with the continued shape changes of the design during the
Fig. 3 Head model HM 2 aInduced electric field distribution bLateral views
0 1
-0.04 -0.02 0.00 0.02 0.04 0.06
0°
HM 2
5°
25°
induced electric field E
x
, V/m
distance along test A, cm
−12 −10 −8 −6 −4 −2
−0.06
−0.03
−0.09 0.00 0.03 0.06 0.09 0.12
induced electric field E
x
, V/m
distance along test B, cm
2 3 4 5
a
b
0°
HM 1
5° 25°
0° HM 2
5°
25°
0°
HM 1
5° 25°
Fig. 4 Comparison of induced electric field distributions between two head models HM 1 and HM 2
[image:3.595.313.543.32.420.2] [image:3.595.47.288.34.204.2] [image:3.595.316.536.478.725.2]optimisation process, the z-directional movement of each design variable is limited to 5 mm from the perimeter of HM 1.
After 11 iterations, the optimal core shape is obtained and compared with the initial one in Fig. 6a. Taking into account manufacturing constraints, a practical core is deduced as shown in Fig. 6bbased on the optimised shape. Figure 6cillustrates the optimised and practical core field distribution, which is approximately 30% stronger than the initial one. Furthermore, the maximum field position shifts by 3 mm compared with the initial core. This result clearly demonstrates that the electric field distribution induced inside the brain during TMS can be controlled in terms of magnitude and localisation by using a well-designed iron core.
The effect of the optimised practical iron core on the induced field distribution is presented in Fig. 7 for HM 2. The practical core causes a field increase of more than 230% in terms of maximum value of the fields and slightly improved field localisation, compared with the coreless coil. A transient FE simulation was finally carried out for the optimised core shape to establish whether the core operates
under magnetic saturation for the typical TMS operating conditions. The results reveal that the core operates under magnetic nonsaturation throughout and that the maximum field strength induced inside the brain is in the range of 50– 70 V/m, which is more than satisfactory. If laminated or amorphous silicon steel is used as the core material, the core loss is also predicted to be at acceptable levels for short operating times typical of TMS operation (50–200ms).
4 Conclusions
Three-dimensional results of the field induced during TMS of the brain have been presented. Two different geometrical head models were considered to establish the effect of the head geometry on the electric field distribution. The CDSA is used to establish an optimised core to be used in TMS to enhance the magnitude and localisation of the electric field induced inside the brain and the predicted optimised core is shown to lead to increased energy efficiency of coupling to the brain, increased induced electric field and improved field localisation compared with typical coreless stimulus coils for both head models.
Work is under way to incorporate realistic geometrical models of the human head and anisotropic, inhomogeneous conductivity values in conjunction with the new optimised TMS stimulation coil.
Fig. 6 Optimised and practical cores aOptimised shape
bPractical shape
cComparison of induced electric field along test line A
Fig. 7 Optimised practical iron core
[image:4.595.317.538.39.416.2] [image:4.595.49.279.291.725.2]5 References
1 Miranda, P.C., Hallett, M., and Basser, P.J.: ‘The electric field induced in the brain by magnetic stimulation: a 3-D finite-element analysis of the effect of tissue heterogeneity and anisotropy’,IEEE Trans. Biomed. Eng., 2003,50, pp. 1074–1085
2 Starzynski, J., Sawicki, B., Wincenciak, S., Krawczyk, A., and Zyss, T.: ‘Simulation of magnetic stimulation of the brain’,IEEE Trans. Magn., 2002,38, pp. 1237–1240
3 Davey, K.R., Cheng, C.H., and Epstein, C.M.: ‘Prediction of magnetically induced electric fields in biological tissue’,IEEE Trans.
Biomed. Eng., 1991,38, pp. 418–422
4 Ren, C., Tarjan, P.P., and Popovic, D.B.: ‘A novel electric design for electromagnetic stimulation-the slinky coil’,IEEE Trans. Biomed. Eng., 1995,42, pp. 918–925
5 Hsu, K., and Durand, D.M.: ‘A 3D differential coil design for localised magnetic stimulation’,IEEE Trans. Biomed. Eng., 2001,48, pp. 1162–1168
6 Kim, D., Park, I., Shin, M., and Sykulski, J.K.: ‘Generalised continuum sensitivity formula for optimum design of electrode and dielectric contours’,IEEE Trans. Magn., 2003,39, pp. 1281–1284