registered charity no 210355 All Rights Reserved.
This file is provided for personal use only.
This publication may not be reproduced or transmitted, in any form or by any means, electronic, mechanical, photocopying, recording, scanning or otherwise, by a third party without the permission in writing of the author(s) and the Society for the History of Natural History
Requests for permission for other kinds of use, such as copying for general distribution or for creating new works, should be addressed to the Honorary Editor.
This paper is published in
A
RCHIVES OFN
ATURALH
ISTORYThe Society for the History of Natural History c/o The Natural History Museum,
Cromwell Road, London SW7 5BD,
United Kingdom. Website – www.shnh.org
Southern Ocean circulation
STUART A. CUNNINGHAM
National Oceanography Centre, Southampton, Empress Dock, Southampton, SO14 3ZH, UK (email: [email protected])
ABSTRACT: The Discovery Investigations of the 1930s provided a compelling description of the main elements of the Southern Ocean circulation. Over the intervening years, this has been extended to include ideas on ocean dynamics based on physical principles. In the modern description, the Southern Ocean has two main circulations that are intimately linked: a zonal (west-east) circumpolar circulation and a meridional (north-south) overturning circulation. The Antarctic Circumpolar Current transports around 140 million cubic metres per second west to east around Antarctica. This zonal circulation connects the Atlantic, Indian and Pacifi c Oceans, transferring and blending water masses and properties from one ocean basin to another. For the meridional circulation, a key feature is the ascent of waters from depths of around 2,000 metres north of the Antarctic Circumpolar Current to the surface south of the Current. In so doing, this circulation connects deep ocean layers directly to the atmosphere. The circumpolar zonal currents are not stable: meanders grow and separate, creating eddies and these eddies are critical to the dynamics of the Southern Ocean, linking the zonal circumpolar and meridional circulations. As a result of this connection, a global three-dimensional ocean circulation exists in which the Southern Ocean plays a central role in regulating the Earth’s climate.
KEY WORDS: ocean circulation – hydrography – Antarctic Circumpolar Current – climate – meridional overturning – eddies.
INTRODUCTION
The Southern Ocean circulation has intrigued physical oceanographers for over a century (Mills, 2005). However, it is only in recent times that oceanographers have recognised its importance in regulating global climate and hence the Earth’s life-support system.
The global climate system involves the oceans and the atmosphere and, most importantly, the interactions between them. The global ocean-atmosphere circulation distributes heat from the equatorial regions to the poles. Although the oceans and atmosphere transport similar amounts of heat, a crucial difference exists in the time-scales of this heat distribution. The atmosphere circulates heat more rapidly, on time-scales of a month or so, while oceans respond over decades to thousands of years. The oceans’ capacity for storing heat is around four thousand times greater than that of the atmosphere: the top one metre of the ocean contains more heat than the entire atmosphere.
The Southern Ocean has an essential and unique role to play in the movement of heat around the planet. In the Southern Ocean water is drawn down from the surface to depths of around 1,000 metres (Intermediate Water) and deeper still to the ocean bottom (Bottom Water). This is signifi cant, as these waters absorb large amounts of heat and carbon dioxide from the atmosphere before their journey downwards. This water can remain out of contact with the atmosphere for decades, or even thousands of years, providing a potent mechanism
for climate stabilisation.
The main instrument for these processes is the interaction between the two giant currents: the Antarctic Circumpolar Current, circulating west to east around the continent, and the Meridional Overturning Circulation. The Meridional Overturning transports water south, into the Southern Ocean, at depth, whilst taking water north from both the deep ocean and from shallower layers.
This paper describes the connection between these two circulations and how oceanographers have arrived at this description since the end of the work of Discovery Investigations in the 1950s.
THE ANTARCTIC CIRCUMPOLAR CURRENT
The Antarctic Circumpolar Current (ACC) is the mightiest ocean current, transporting around 140 million cubic metres per second – 140Sv1 – west to east around Antarctica
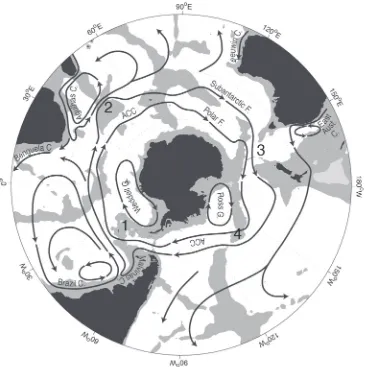
in a continuous path some 22,000 kilometres long. The ACC consists of two main fronts, the Polar and Subantarctic Fronts (Figure 1). Fronts in the ocean are boundaries between waters with different temperature, salinity and density characteristics. Density changes across fronts result in jets of water along a front, transporting water masses and their properties, such as heat, salt and dissolved carbon dioxide. This current effi ciently blends waters from the Atlantic, Indian and Pacifi c Oceans (Naveira-Garabato et alii, 2003), creating a global circulation. The Subantarctic Front marks the northern boundary of the Southern Ocean, where cold surface water from the south sinks beneath warmer subtropical waters. Around its circumpolar path the ACC meanders northward and southward defl ected by submarine topography: particularly the Scotia Arc; Kerguelen Plateau; Macquarie Ridge complex; and the Pacifi c Antarctic Ridge (Figure 1). Thus, the northern edge of the Southern Ocean varies in latitude, controlled strongly by topography. We will see later that submarine mountains play a key role in the dynamics of the zonal and meridional circulations.
The ACC passes through three choke points on its path around Antarctica where it is possible to unambiguously measure the total transport: through Drake Passage between South America and the Antarctic Peninsula; between South Africa and Antarctica; and between Australia and Antarctica (Table 1).
Measurements of the ACC in Drake Passage are most numerous as it is the narrowest choke point (by a factor of three) and is the access route to the most northerly land in Antarctica where most Antarctic science has been conducted.
ACC transport and variability through Drake Passage
Figure 1. Schematic map of major currents in the southern hemisphere oceans south of 20° S. Depths shallower than 3,500m are shaded. The two major cores of the Antarctic Circumpolar Current (ACC) are shown, the Subantarctic Front and Polar Front. Other abbreviations used are F = Front, C = Current, G = Gyre. Around its circumpolar path the ACC is defl ected from its zonal path by submarine topography: in particular 1. Scotia Arc; 2. Kerguelen Plateau; 3. Macquarie Ridge complex; 4. Pacifi c Antarctic Ridge (adapted from Rintoul et alii, 2001).
Table 1 Circumpolar choke points of the Antarctic Circumpolar Current, where it is possible to unambiguously measure the total transport. Width is taken as the track length of recent hydrographic sections measuring ACC transport, and may not be the shortest distance across the choke point.
Choke Point Longitude (° E) Latitude (° S) Approximate width (km)
Drake Passage 290–303 54–62 750
South Africa 18–28 35–70 3900
is preferred.
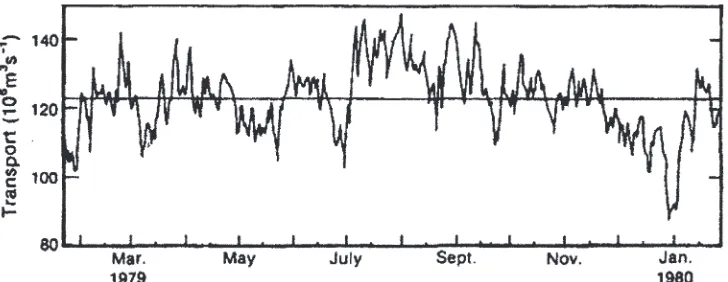
From the mid-1970s to the early 1980s, the International Southern Ocean Studies (ISOS) programme deployed arrays of current meters and obtained sections of the density distribution across Drake Passage. The most complete observations were obtained from January 1979 to February 1980, for which the average total transport was 134Sv (Figure 2) (Whitworth et alii, 1982; Whitworth, 1983; Whitworth and Peterson, 1985; Cunningham et alii, 2003). The error in this average is now thought to be 15–27Sv (10–20%), whilst the year-long variability (one standard deviation) about the average is 11.2Sv and the range of transport is 54Sv.
Whilst the ISOS current meter array gave a detailed picture of ACC transport and variability the measurements only covered one year. However, measurements of the density distribution, from which transport can be calculated, have been made occasionally over a number of decades. Between 1975 and 2005 the average transport shallower than 3000dbar is 107.3 ± 10.4Sv (Cunningham et alii, 2003). Over 25 years there has been no trend observed in these transports, implying that the vertical density structure of the ACC has not changed. If this is so, atmosphere-ocean-ice interactions, which can change water mass properties and distributions, must also have remained in balance.
Observations of the deep water mass properties exist back to the 1930s (Mills, 2005). Although it is not possible to calculate transport from the sparse early twentieth-century observations, the deep water masses also have constant properties over this period.2
ACC transport at choke points and exchanges with Atlantic, Indian and Pacific Oceans
[image:5.595.113.477.148.289.2]larger to balance export from the Pacifi c to Indian Oceans.
Ganachaud and Wunsch (2000) and Ganachaud (2003) used hydrographic sections, current meter arrays and atmospheric climatologies to calculate globally consistent estimates of ocean circulation. Transport (±uncertainty) through Drake Passage and South of Australia were 140±6Sv and 157±10Sv respectively and the Indonesian recirculation was 16±5Sv. These are consistent with the choke point fl ow estimates. Ganachaud and Wunsch (2000) emphasised that “signifi cant improvements in global transport estimates will only occur through the use of data sets permitting the true temporal averaging of the oceanic circulation”. The uncertainty in these estimates cripple our ability to precisely defi ne the role of the Southern Ocean in global climate, and the role the Southern Ocean may play in a changing climate. To reduce uncertainty, future Southern Ocean research requires sustained and systematic ocean-atmosphere observing systems to gather the necessary data.
What sets the size of the ACC and what balances energy input from the wind?
A circumpolar trough of low pressure around 60° S dominates the large-scale atmospheric pattern over the Southern Ocean. Frequent storms form at this trough (Figure 3), and the ACC transport is largely determined by the force exerted on the sea surface by the eastward wind (wind stress) (Figure 4). The wind stress is largest between 50° to 55° S and has a circumpolar maximum in the south-east Pacifi c.
Munk and Palmen (1951) fi rst suggested that constant acceleration imparted to the ACC by the wind was balanced by bottom form stress or mountain drag.3 A simple calculation
showed that the sum of bottom pressure drops across four principal submarine ridges (Kerguelen, Macquarie, South Pacifi c Ridges and the Scotia Arc) was suffi cient to balance the zonal momentum put in by the wind.
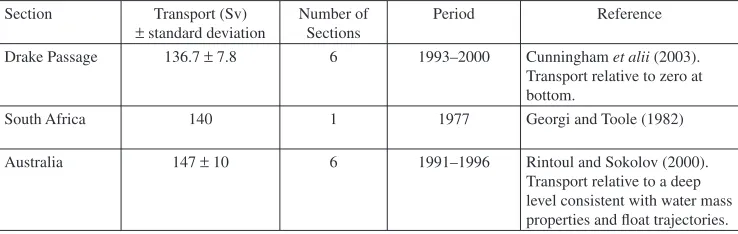
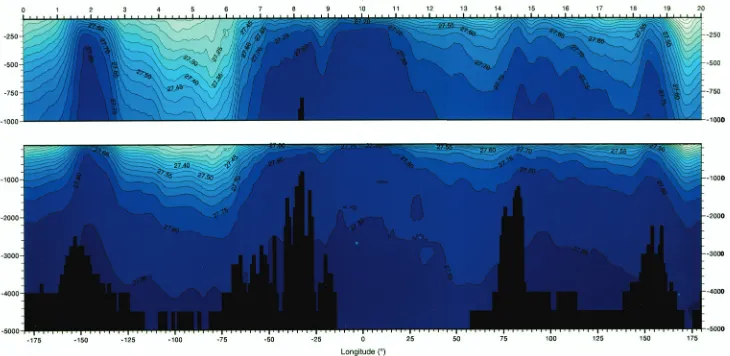
[image:6.595.116.485.174.291.2]Sea surface height drops as the ACC crosses submarine ridges (Figure 5), developing a barotropic form stress with high pressure on the upstream side of the ridge. This is similar to the case of air accelerating over the curved upper side of an aeroplane wing, creating low pressure on the top of the wing, thus generating an upward force (lift). A baroclinic form stress also forms as less dense water piles up ahead of the submarine ridges (Figure 6), and as the pressure beneath a column of water is given by the weight of water the less dense water gives lower bottom pressure on the upstream side of the ridge. However, the net effects of the barotropic and baroclinic form stress create high pressure on the upstream side of the Table 2: Baroclinic transport of the ACC through three circumpolar choke point sections
Section Transport (Sv)
± standard deviation
Number of Sections
Period Reference
Drake Passage 136.7 ± 7.8 6 1993–2000 Cunningham et alii (2003). Transport relative to zero at bottom.
South Africa 140 1 1977 Georgi and Toole (1982)
Figure 3. Wind speed and direction (vectors) and wind isotachs (shaded) in m/s at a height of 10m above sea level at 1800 GMT on Thursday 24 June 2004 (National Centers for Environmental Prediction reanalysis data provided by the NOAA-CIRES Climate Diagnostics Center, Boulder, Colorado, USA, from their web site at http://www.cdc.noaa.gov/).
[image:7.595.123.476.511.694.2]ridge, so the ACC exerts a net force on the ridge, thus removing energy from the fl ow: the drop in sea surface height downstream across the ridge is more important than the change in density across the ridge. The rate at which energy is removed from the ACC as it fl ows over the four main ridges equals the rate at which energy is supplied to the ACC by the wind. This balance has not been confi rmed by observations because we cannot measure the absolute pressure difference across the ridge with suffi cient accuracy. However, in numerical models (Stevens and Ivchenko, 1997), bottom form stress does remove energy from the ACC at the rate supplied by the wind.
[image:8.595.189.399.151.323.2]Charts of currents (such as Figure 1) give the impression of a stationary Southern Ocean, with fronts and water masses smoothly varying over large distances. However, hydrographic Figure 5. Schematic representation of bottom form stress (mountain drag). Wind stress imparted eastward momentum in the water column is removed by the pressure difference across the ridge. The geostrophic pressure balance across the ridge demands an equatorward fl ow ⊗ along the ridge (adapted from Johnson and Bryden, 1989).
[image:8.595.119.484.371.549.2]and satellite observations and numerical models show that the Southern Ocean is highly variable. The Polar and Subantarctic Fronts are unstable, forming eddies with scales of tens to hundreds of kilometres, entirely fi lling the Southern Ocean with eddying motion (the oceanic equivalent of the familiar atmospheric high and low pressure systems with scales of thousands of kilometres). Apart from at the Polar and Subantarctic frontal jets, these eddies mask the much slower long term mean circulation.
It is eddies that interact with the submarine topography regulating the zonal fl ow by transmitting the eastward wind stress downward through the water column where it is balanced by the bottom form stress (Munk and Palmen, 1951; Rhines and Young, 1982). In a process similar to the barotropic form stress described earlier, a downward fl ux of the ACC eastward momentum is achieved through interfacial form stress (Johnson and Bryden, 1989). Interfacial form stress occurs when eddies distort the density fi eld leading to high and low pressures on either side of a perturbation, creating a stress which is then passed downward through the water column, until a density surface intersects bottom topography where bottom form stress acts to decelerate the water column above. In a classic paper, Johnson and Bryden (1989) developed a simple model balancing eastward wind stress and the vertical fl ux of eastward momentum. Using current meter observations, they confi rmed that this model accurately describes the downward fl ux of momentum and that the ACC transport is proportional to the square root of wind stress.
The simple model above, which predicts that the ACC transport is proportional to the square root of wind stress, neglects other forcing mechanisms that are likely, to a lesser extent, to contribute to the total transport. For example, the vertical density structure in the water masses on either side of a front can change through ocean-atmosphere-ice buoyancy forcing.4 Bryden and Cunningham (2003) showed that in the Southern Ocean, combined wind
stress and air-sea heat exchange sets the horizontal temperature gradient and the vertical stratifi cation of the ACC, both of which are directly relevant to the total transport. Forming a complete theory describing the size and forcing of the ACC is a diffi cult challenge, and more observations of water mass distributions and the forcing fi elds are needed. These observations could then be used to initialise very high-resolution ocean models to explore the dynamics and response of the ACC.
We now turn our attention from zonal transport and forcing to the meridional/vertical ACC circulation, in which eddies have been found to play a profound role.
MERIDIONAL OVERTURNING CIRCULATION
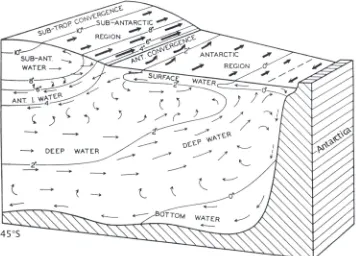
From north/south temperature sections, Deacon (1937) and Sverdrup et alii (1942) inferred (but did not quantify) a signifi cant Southern Ocean circulation in the meridional/vertical plane (Mills, 2005) (Figure 7). They knew that eastward winds around Antarctica drove a surface Ekman5 current away from Antarctica and they inferred that the deep water fl ows southward
and upward across the ACC to compensate. As the surface water is driven northward it sinks at the Antarctic Convergence6 forming Antarctic Intermediate Water. Some of the upwelling
swamps the net northward circulation driven by the wind. The principal consequence of the eddies is to drive a meridional overturning that is perhaps twice as large as would be implied by considering only the wind.
That the overturning circulation exists is well established by observations and models. However, attempts to quantify its circumpolar distribution and size are hindered by our limited understanding of the physical processes involved and more crucially a lack of observations.
The role of eddies in the meridional circulation
Imagine starting in Drake Passage at some depth shallower than the submarine ridges, making a circumpolar circuit and returning to your starting position. The average pressure gradient along this path must be zero, as you start and end at the same pressure; that is, pressure gradients cannot be driving meridional transport. In contrast, for oceanic gyres, transoceanic pressure gradients are supported between continents, driving meridional fl ows that are returned in western boundary currents (contrast the gyre and Southern Ocean circulations in Figure 1).
[image:10.595.123.479.150.406.2]extrapolated round Antarctica, transported 0.4PW and 0.9PW7 respectively. This heat fl ux
is suffi cient to balance the estimated ocean-atmosphere heat loss south of the ACC and is positive (but scanty) evidence that eddies are responsible for poleward transport across the ACC. Johnson and Bryden (1989) also considered evidence for the vertical distribution of the eddy-driven meridional mass transport, noting that the observations south of Australia implied that it reached 1,100m depth, and in Drake Passage 600m, thereby concluding that the observational evidence supported the idea that eddies do indeed transport deep water polewards across the ACC at depths above the submarine topography.
What is the size of the meridional overturning circulation?
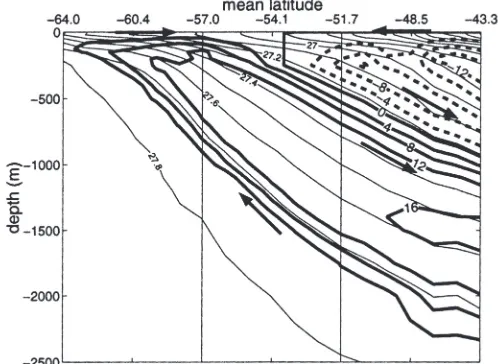
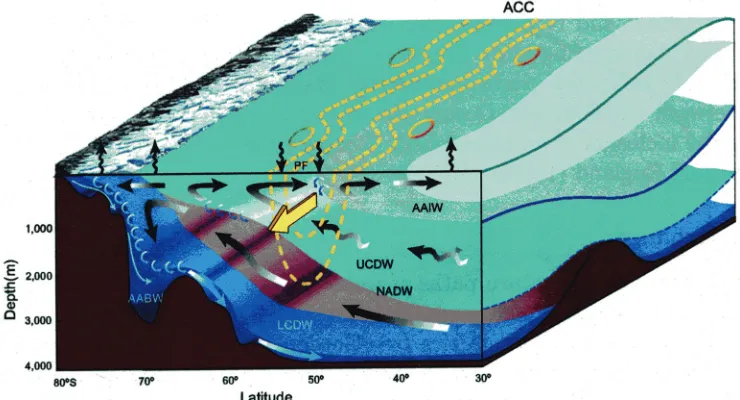
Quantifi cation of the meridional circulation in the Southern Ocean, other than through the scanty current meter measurements of the poleward eddy heat fl ux, has proved diffi cult. Karsten and Marshall (2002) used hydrographic data, satellite altimetry and climatological winds to estimate eddy fl uxes and the magnitude of the overturning circulation (also known as the Deacon circulation). Satellite data do not extend south of 64.5° S and their analysis ends at that latitude and so does not include the deep overturning cell (conversion of deep to Bottom water). Climatological winds drive an Ekman transport that increases northward to 24Sv at 51.7° S (Figure 8). The compensating eddy transport is southward, increasing to a maximum southward transport of 33Sv at 51.7° S. The residual circulation, the sum of the Ekman and eddy transports, shows that there is a convergence of mass into the ACC at 54.1° S, with approximately 6Sv fl owing equatorward and 10Sv fl owing poleward. Karsten and Marshall (2002) also calculated the overturning circulation at depth (Figure 9). The Deacon circulation has deep water from about 2,000m fl owing southward and upward to surface layers south of the ACC. Buoyancy fl uxes reduce the density of the surface water as it fl ows north and sinks at the Polar Front at 54.1° S. In this model, a northern overturning cell has subantarctic water carried southward by eddies swamping the northward Ekman transport converging on the Polar Front (this circulation is also inferred in Figure 7).
Sloyan and Rintoul (2000), combining hydrographic and air-sea buoyancy forcing observations, and allowing mixing across density surfaces, found a much weaker Deacon cell than Karsten and Marshall (2002); fi nding only 6Sv of northward fl ow at densities less than 27.4kgm-3 compared with more than 12Sv (Figure 9). The deep overturning circulation
in Sloyan and Rintoul (2000) is also much larger: 52Sv of upper deep water is imported to the Southern Ocean and is balanced by the export of 46Sv of lower Deep and Bottom water. Thus, the present best estimates of the size of the Southern Ocean overturning are uncertain, perhaps up to 52Sv, and certainly larger than that implied by only the wind driven Ekman transport. Establishing the magnitude of this circulation is one of the outstanding problems for modern physical oceanography.
Figure 8. The Southern Ocean zonally integrated surface transport (Sv). Dashed-dotted line is the Ekman transport calculated from the Southampton Oceanography Centre climatology (see Figure 4). Dashed line is the eddy induced transport and the solid line is the residual transport (the difference between the Ekman and eddy induced transport). Error bars on the eddy-induced transport are calculated from an estimated eddy diffusivity error (adapted from Karsten and Marshall, 2002).
Figure 9. The Southern Ocean zonally integrated residual circulation stream function (Sv) versus depth. Contour interval is 4Sv with solid (dashed) contours indicating positive (negative) values. The arrows mark the direction of fl ow. Thin solid lines are contours of (neutral) density surfaces (γn, in kg/m3) with a contour
[image:12.595.175.424.434.616.2]THE SOUTHERN OCEAN AND GLOBAL THERMOHALINE CIRCULATION
Beneath the wind driven upper ocean circulation, density differences between water masses are responsible for ocean circulation. The density of the water is a combination of its temperature (thermo) and salt (haline) content, and the global circulation driven by salt and temperature differences is the global thermohaline circulation (THC).
In the North Atlantic, warm water fl ows northward in the Gulf Stream and North Atlantic Current to the Arctic Ocean. Flowing rapidly northwards, the current cools as it heats the atmosphere above, particularly over the Gulf Stream extension, and this heat is transported north-eastwards toward Europe by the atmosphere. In the Arctic Ocean further cooling increases the ocean density until the water sinks, forming cold deep water that fl ows southwards out of the Arctic across the Greenland-Iceland-Scotland Ridges. This cold and salty deep water, known as North Atlantic Deep Water (NADW), spreads to the Southern Ocean and is subsequently distributed globally. At 24.5° N in the Atlantic between Florida and the Canary Islands, there is a maximum in the northward ocean heat fl ux of 1.3PW (Bryden and Imawaki, 2001). This heat transport is principally caused by the temperature difference between the Gulf Stream, carrying 32Sv of warm water northwards, and NADW carrying around 17Sv of cold water southwards. Palaeoclimate observations and numerical modelling experiments (Manabe and Stouffer, 1993; Schiller et alii, 1997; Vellinga and Wood, 2002) showed that average European air temperatures are 5°–10°C colder when this circulation does not exist, such as at the end of the last ice-age about ten thousand years ago.
Having formed NADW, somehow and somewhere it must be destroyed by mixing with less dense water, thus producing upwelling and closing the global THC, otherwise the ocean would fi ll with water of one density and the THC would grind to a halt. Based on the ideas in Stommel (1958) and Munk (1966) it was thought that deep water could upwell into the thermocline uniformly throughout the global ocean. However, recent direct observations of deep ocean mixing are an order of magnitude too small to account for this uniform upwelling (Wunsch and Ferrari, 2004). Hence there is a conundrum over how an overturning circulation of the magnitude given by the well-known volume of NADW can be maintained. Recently a solution has been proposed, arrived at through observations and modelling.
Rough topography, such as at mid-ocean ridges, has been shown to enhance mixing. Tides fl ow across the ridges generating internal waves that break on the rough topography, producing localised mixing hot-spots that greatly enhance the average deep mixing (Polzin et alii, 1995). However, the fate of NADW has also been studied using high-resolution global numerical models. Döös and Coward (1997) followed the paths of 1.58 million simulated parcels of NADW as they crossed the Equator in the Atlantic (Figure 10). They found that 9–12Sv of NADW (from at total of 15.8Sv) upwelled in the Southern Ocean south of 50° S into the mixed layer, where ocean-atmosphere-ice interactions can change the density of the water, completing the Deacon and deep overturning meridional circulations. Later, Webb and Suginohara (2001) argued on the basis of the total available wind and tidal energy that the remaining 5–8Sv of NADW could be mixed upward by breaking internal waves and mixing by internal tides.
Figure 10. Vertical velocity of NADW as it reaches the density surface of 1027.625 kg/m3 calculated from 1.58 million
trajectories made using data from the OCCAM model. On the right is the zonal and meridional integral of the vertical transport. The total transport of NADW in the model is 15.8Sv (adapted from Döös and Coward, 1997).
SUMMARY
[image:14.595.115.485.358.558.2]ridges. Hence, there is no average north/south fl ow driven by pressure gradients. The ACC is the largest ocean current, principally wind-driven, with a net transport of around 140Sv. Wind forcing is balanced by bottom form stress – a pressure difference across submarine ridges with high pressure on the upstream side. The bottom form stress is a small residual of two large and opposing forces: the barotropic form stress due to the sea-surface height drop across the ridge acting to decelerate the fl ow and the baroclinic form stress due to less dense water piled up ahead of the ridge, which acts to accelerate the fl ow.
The ACC is a deeply penetrating baroclinically unstable current that generates eddies. These eddies play two roles absolutely central to the dynamics of the ACC and structure of the Southern Ocean: they transmit wind stress down through the water column by means of interfacial form stress so bottom form stress balances the wind stress; and they effect a meridional heat fl ux that balances the heat lost to the atmosphere around Antarctica. It is also the vertical divergence of the interfacial form stress that drives the meridional overturning circulation. Deep water upwells across the ACC feeding the upper Deacon cell and a deep overturning cell.
Ocean-atmosphere-ice interactions modify the deep water forming Intermediate and Bottom Waters – the returning branches of the overturning cells. The overturning cells are considerably larger than would be driven by Ekman forcing alone, again emphasising the central role of eddies.
A global THC exists, with the Southern Ocean providing the pathway for transferring water masses and properties between the Atlantic, Indian and Pacifi c Oceans. These water masses are considerably altered in the Southern Ocean as they exchange with the surrounding oceans. The global THC is closed in the Southern Ocean. Eddies carry NADW as part of the deep water upwelling branch into the mixed layer south of the ACC, where atmosphere-ocean-ice interactions change its density, resolving a conundrum of why estimates of deep ocean mixing rates were a factor ten larger than indicated by observations – the majority of NADW is modifi ed in the upper layers of the Southern Ocean and not in the global deep ocean.
ACKNOWLEDGEMENTS
Owen Gaffney from the NERC press offi ce provided thoughtful amendments to the fi rst draft of this paper.
NOTES
1 Oceanographers use the unit “Sverdrup”, abbreviated to Sv, to denote a fl ow of 1,000,000 cubic metres of water
per second. Hence, 140,000,000 cubic metres per second is 140Sv.
2 A. Williams to S. Cunningham, pers. comm., October 2004.
3 Bottom form stress (or mountain drag) is the force exerted by the ocean against a bathymetric obstruction. In
this case as the ACC passes over sub-sea ridges the drag acts to slow the current, balancing acceleration imparted at the sea surface by the wind.
4 Buoyancy forcing is the effect of changing ocean density through heat exchange (warming and cooling) and
freshwater exchange (precipitation, evaporation, river and ice run off).
5 In the southern/northern hemisphere wind driven currents are 90° to the left/right of the wind. Termed the
Ekman current, this is confi ned to the near surface mixed layer, typically the top 100m.
6 The Antarctic Convergence is the name given by Deacon (1937) and subsequently by Sverdrup et alii (1942)
to what we now refer to as the Polar Front (Figure 2).
REFERENCES
BRYDEN, H. L. and IMAWAKI, S., 2001 Ocean heat transport, pp 455–474 in SIEDLER, G., CHURCH, J. and GOULD, W. J. (editors), Ocean circulation and climate: observing and modelling the global ocean. San Diego: Academic Press. Pp xix, 715.
BRYDEN, H. L. and CUNNINGHAM, S. A., 2003 How wind forcing and the air-sea heat exchange determine meridional temperature gradient and stratifi cation for the Antarctic circumpolar current. Journal of geophysical research 108: Doi:10.1029/2001JC001296.
CUNNINGHAM, S. A., ALDERSON, S. G., KING, B. A. and BRANDON, M. A., 2003 Transport and variability of the Antarctic circumpolar current in Drake Passage. Journal of geophysical research 108: Doi: 10.1029/2001JC001147.
DEACON, G. E. R., 1937 The hydrology of the Southern Ocean. Discovery reports15: 1–124.
DÖÖS, K. and COWARD, A., 1997 The Southern Ocean as the major upwelling zone of North Atlantic deep water.
International WOCE newsletter27: 3–4.
GANACHAUD, A., 2003 Large-scale mass transports, water mass formation, and diffusivities estimated from World Ocean Circulation Experiment (WOCE) hydrographic data. Journal of geophysical research 108: Doi: 10.1029/2002JC001565.
GANACHAUD, A. and WUNSCH, C., 2000 Improved estimates of global ocean circulation, heat transport and mixing from hydrographic data. Nature408: 453–457.
GEORGI, D. T. and TOOLE, J. M., 1982 The Antarctic circumpolar current and the oceanic heat and freshwater budgets. Journal of marine research40: 183–197.
GORDON, A. L., 2001 Interocean exchange, pp 303–314 in SIEDLER, G., CHURCH, J. and GOULD, W. J. (editors), Ocean circulation and climate: observing and modelling the global ocean. San Diego: Academic Press. Pp xix, 715.
JOHNSON, G. C. and BRYDEN, H. L., 1989 On the size of the Antarctic circumpolar current. Deep-sea research 36: 39–53.
JOSEY, S. A., KENT, E. C. and TAYLOR, P. K., 1998 The Southampton Oceanography Centre (SOC) ocean-atmosphere heat, momentum and freshwater fl ux atlas. Southampton Oceanography Centre internal report 6. KARSTEN, R. and MARSHALL, J., 2002 Constructing the residual circulation of the Antarctic circumpolar current
from observations. Journal of physical oceanography32: 3315–3327.
MANABE, S. and STOUFFER, R. J., 1993 Century scale effects of increased atmospheric CO2 on the
ocean-atmosphere system. Nature364: 215–218.
MILLS, E. L., 2005 From Discovery to discovery: the hydrology of the Southern Ocean, 1885–1937. Archives of natural history32: 246–264 (this volume).
MUNK, W. H., 1966 Abyssal recipes. Deep-sea research13: 707–730.
MUNK, W. H. and PALMEN, E., 1951 Note on the dynamics of the Antarctic circumpolar current. Tellus3: 53–55.
NAVEIRA-GARABATO, A. C., STEPHENS, D. P. and HEYWOOD, K. J., 2003 Water mass conversion, fl uxes, and mixing in the Scotia Sea diagnosed by an inverse model. Journal of physical oceanography33: 2565–2587. OLBERS, D., BOROWSKI, D., VOLKER, C. and WOLFF, J.-O., 2004 The dynamical balance, transport and
circulation of the Antarctic circumpolar current. Antarctic science 16: 439–470.
PHILLIPS, H. E. and RINTOUL, S. R., 2000 Eddy variability and energetics from direct current measurements in the Antarctic circumpolar current south of Australia. Journal of physical oceanography30: 3050–3076. POLZIN, K. L., TOOLE, J. M. and SCHMITT, R. W., 1995 Finescale parameterizations of turbulent dissipation.
Journal of physical oceanography25: 306–329.
RHINES, P. B. and YOUNG, W. R., 1982 A theory of the wind-driven circulation i: mid-ocean gyres. Journal of marine research: 40: 559–596.
RINTOUL, S. R., HUGHES, C. and OLBERS, D., 2001 The Antarctic circumpolar current system, pp 271–302 in SIEDLER, G., CHURCH, J. and GOULD, W. J. (editors), Ocean circulation and climate: observing and modelling the global ocean. San Diego: Academic Press. Pp xix, 715.
SCHILLER, A., MIKOLAJEWICZ, U. and VOSS, R., 1997 The stability of the North Atlantic thermohaline circulation in a coupled ocean-atmosphere general circulation model. Climate dynamics13: 325–347.
SLOYAN, B. M. and RINTOUL, S. R., 2000 Estimates of area-average diapycnal fl uxes from basin-scale budgets.
Journal of physical oceanography30: 2320–2341.
SPEER, K., RINTOUL, S. R. and SLOYAN, B. M., 2000 The diabatic Deacon cell. Journal of physical oceanography 30: 3212–3222.
STEVENS, D. P. and IVCHENKO, V. O., 1997 The zonal momentum balance in an eddy-resolving general-circulation model of the Southern Ocean. Quarterly journal of the Royal Meteorological Society 103: 929–951.
STOMMEL, H., 1958 The abyssal circulation. Deep-sea research5: 80–82.
SVERDRUP, H. U., JOHNSON, M. W. and FLEMMING, R. H., 1942 The oceans: their physics, chemistry and general biology. Englewood Cliffs: Prentice-Hall. Pp 1,087.
VELLINGA, M. and WOOD, R. A., 2002 Global climate impacts of a collapse of the Atlantic thermohaline circulation. Climatic change54: 251–267.
WEBB, D. W. and SUGINOHARA, N., 2001 The interior circulation of the ocean, pp 205–214 in SIEDLER, G., CHURCH, J. and GOULD, W. J. (editors), Ocean circulation and climate: observing and modelling the global ocean. San Diego: Academic Press. Pp xix, 715.
WHITWORTH III, T., 1983 Monitoring the transport of the Antarctic circumpolar current at Drake Passage. Journal of physical oceanography13: 2045–2057.
WHITWORTH III, T. and PETERSON, R. G., 1985 Volume transport of the Antarctic circumpolar current from bottom pressure measurements. Journal of physical oceanography15: 810–816.
WHITWORTH III, T., NOWLIN, W. D. and WORLEY, S. J., 1982 the net transport of the Antarctic circumpolar current through Drake Passage. Journal of physical oceanography12: 960–971.
WUNSCH, C. and FERRARI, R., 2004 Vertical mixing, energy and the general circulation of the oceans. Annual review of fl uid mechanics36: 281–314
EDITORIAL BOARD
Honorary Editor: Dr E. CHARLES NELSON ([email protected])
Associate Editor: Dr JOE CAIN
Associate Editor (Book reviews): Dr PETER BARNARD ([email protected])
Publication of Archives of natural history is the main way in which the Society for the History of Natural History fulfils its objectives. The journal provides an avenue for the publication of papers and short notes in all those areas of interest to the Society, and each issue contains a section of book reviews.
Archives of natural history is published twice a year, in April and October. Both parts contain at least 192 pages.
All papers submitted must be original; papers that have been also submitted elsewhere or are mere translations from another language cannot be considered. All papers are subject to peer review before acceptance. Instructions to authors, providing detailed information about the preparation of papers, are available on the Society’s web-site and from the Honorary Editor who can also advise authors about the suitability and format of papers. Papers must be submitted in typescript (two copies, double spaced throughout) to the Honorary Editor, but final edited copy will be requested on disc.
Subscriptions to Archives of natural history are welcomed from libraries and institutions.
Archives of natural history is typeset and published for The Society for the History of Natural History by
Science History Publications Ltd 16 Rutherford Road Cambridge, CB2 2HH.
SOCIETY FOR THE HISTORY OF NATURAL HISTORY
The Society, founded in 1936, is an international society of individual members who are interested in the history and bibliography of all disciplines within the biological and the earth sciences. This is taken to include botany, general biology, geology (including palaeontology) and zoology; the lives of naturalists, their publications, correspondence and collections; the institutions and societies to which they belonged; and bibliographic studies of rare books, manuscripts and illustrative material.
Membership is open to anyone interested in the objects of the Society. The principal benefit of membership is receipt of the international journal Archives of natural history. A Newsletter is issued three times a year. The Society also organizes evening meetings and conferences, visits to places of interest to members, and a biennial two or three day international conference. Members may also purchase back-numbers of the Society’s publications at reduced rates.
The Society has representatives in Central Europe, Italy, Japan, North America, Scotland, South America and South Asia.
Current membership details may be obtained from the Society’s website www.shnh.org and subscriptions can be paid by credit/debit cards.
Membership enquiries: please contact the Hon. Secretary [email protected].