Regular
Use of FBG Sensors for SHM in Aerospace Structures
Gayan C. KAHANDAWA
*, Jayantha EPAARACHCHI, Hao WANG, and K. T. LAU
Centre of Excellence in Engineered Fibre Composites, University of Southern Queensland, Toowoomba 4350, Queensland, Australia
*Corresponding author: Gayan C. KAHANDAWA E-mail: [email protected]
Abstract:
This paper details some significant findings on the use of the fiber Bragg grating (FBG)
sensors for structural health monitoring (SHM) in aerospace fiber reinforced polymer (FRP)
structures. A diminutive sensor provides a capability of imbedding inside FRP structures to monitor
vital locations of damage. Some practical problems associated with the implementation of FBG
based SHM systems in the aerospace FRP structures such as the difficulty of embedding FBG
sensors during the manufacturing process and interrelation of distortion to FBG spectra due to
internal damage, and other independent effects will be thoroughly studied. An innovative method to
interpret FBG signals for identifying damage inside the structures will also be discussed.
Keywords: Structural health monitoring, aerospace structures, fiber Bragg grating sensors
Received: 6 June 2012 / Revised version: 9 June 2012
© The Author(s) 2012. This article is published with open access at Springerlink.com
1.Introduction
Fiber reinforced polymer (FRP) composites have been used as an engineering material for more than six decades. The main attraction of the FRP is its superior strength-to-weight ratio. Aircraft and defense industries have been spending over billions of dollars on the investment of these composites to produce lightweight subsonic and supersonic aircrafts. The other desirable properties such as the ease of fabrication to complex shapes and the ability to tailor desirable properties to suit different engineering applications are enviable for an advanced material. Since the research and development (R&D) in the aircraft industry and space exploration agencies have been focused on the FRP for many years, most of the advanced fiber composites available today one way or another have their origins in these fields.
The weight-save or positive weight spiral in the
aircraft industry directly is translated to the enhancement of the load carrying capacity of an aircraft (mainly for civil aircraft) while for the fighters, it will be translated to the performance enhancement (mainly on the fuel carrying capacity versus the flying speed).
As composites are partially made of polymer-based materials, they possess very good damping and fatigue resistance properties as compared with traditional metallic materials.
criteria. Because of these undesirable properties, the FRP composite structures in the aircraft need to be closely monitored to prevent unexpected failure.
These structures can include stress-concentrated regions such as pin-loaded holes and other cutouts. These stress concentrations easily induce damage that concurrently includes splits, transverse cracks, and delamination [1–3]. It is essential to monitor the structure near stress concentrations in order to ensure the structural integrity. In view of aforementioned issues, the structural health monitoring (SHM) technique has recently been developed for these composite structures [4, 5].
1.1 SHM for FRP aerospace structures
The process of implementing the damage detection and characterization strategy for engineering structures is referred to as SHM. Here, damage is defined as changes to the material properties or changes to the structural response of the structure. The SHM process involves the observation of a system over time using periodically sampled dynamic response measurements from an array of sensors. Most of the offline non-destructive test (NDT) methods do not fall into SHM.
With the complex failure modes of FRP composites, the need of SHM becomes vital. With the increasing utilization of FRP composites in the aerospace industry for primary aircraft structures, such as wing leading-edge surfaces and fuselage sections, has increased. This led to rapid growth in the field of SHM. Impact, vibration, and loading can cause damage to the FRP composite structures, such as delamination and matrix cracking. Moreover, the internal material damage can be invisible to the human eyes, making inspection of the structures for damage and clear insight into the structural integrity difficult using currently available evaluation methods.
The SHM system developed to monitor aircraft and space structures must be capable of identifying multiple failure criteria of FRP composites [6].
Since the behavior of composites is anisotropic, multiple numbers of sensors must be in service to monitor these structures under multi directional complex loading conditions. The layered structure of the composites makes it difficult to predict the structural behavior only by using surface sensors. To address this issue, embedded sensors must be used, and the sensors used must be with the long enough life time since it is not possible to replace embedded sensors after fabrication of the parts.
The
fiber Bragg grating (
FBG) sensor is one of the most suitable sensors for the SHM of aircraft structures. The FBG sensors can be embedded in FRP composites during the manufacturing of the composite part with no effect on the strength of the part since the size of the sensor is diminutive. This sensor is suitable for networking since it has a narrowband with a wavelength operating range and hence can be highly multiplexed. This nonconductive sensor can operate in electromagnetically noisy environments without any interference. The FBG sensor is made up of glass which is environmentally more stable and with the long life time similar to FRP composites. Because of its low transmission loss, the sensor signal can be monitored from longer distances making it suitable for remote sensing [7, 8].Its capability to detect stress gradients along its length can be used to identify the stress variations in the FRP composites by means of chirp in the reflected spectra of the FBG sensor [9, 10]. This phenomenon can be used to detect damage in the composite structures [11, 12]. But it was reported that the chirp of the FBG spectrum was not limited to stress concentrations [13]. There are other causes of chirp, and it is necessary to eliminate such effects to identify damage accurately.
The PPP-BOTDA based system has been successfully used in various industrial applications. However, it was so far able to measure the static or quasi-static strain, only.
1.2 Use of FBG sensors for SHM in aerospace structures
FBG sensors has been using for SHM of FRP composites efficiently for more than two decades. Recent advances in FBG sensor technologies have provided great opportunities to develop more sophisticated in situ SHM systems. There have been a large number of research efforts on health monitoring of composite structures using FBG sensors. The ability to embed inside FRP composites in between different layers provides the closer look upon defects. The attractive properties such as the small size, immunity to electromagnetic fields, and multiplexing ability are some of the advantages of FBG sensors. The lifetime of the FBG sensor is well above the life time of the FRP structures, and also the sensor provides the measurement of multiple parameters such as load/strain, vibration, and temperature [15].
The use of FBG sensors to detect damage was first reported in 1984 by Crane et al. Since then, many researchers reported the use of FBG sensors for damage detection in FRP composites. FBG sensors have attracted much attention for health monitoring applications due to their great advantages, such as high accuracy in measuring strain and/or temperature and multiplexing capability.
Monitoring strain by measuring the wavelength shift of the light reflected from the FBG sensor has often been applied in conventional health monitoring [16]. Gumes and Menendez (2002)[17], Barton et al. (2001) [18], Okabe et al. (2004) [19], Yashiro et al. (2005) [20], and Epaarachchi et al. (2009) [21] have successfully used embedded FBG sensors to measure internal strain and investigated the change in spectral shapes and change in strain in
the vicinity of the damage. FBG sensors are also sensitive to the longitudinal strain distributions along the gauge sections [9-10]. Peters et al. (2001) [22] measured reflection spectra in a compact tension specimen with an embedded FBG sensor and simulated the change in the spectrum shape resulting from the large strain gradients. Okabe et al. (2000) [11] and Takeda et al. (2002) [12] first utilized this feature to detect internal damage in the carbon fiber reinforced polymer (CFRP) laminates. Yashiro et al. (2005) [20] also demonstrated that the reflection spectrum of an embedded FBG sensor was useful for identifying damage patterns within the gauge section for notched FRP laminates [23].
Furthermore, Okabe et al. (2004) [20] used a chirped FBG sensor, which had a gradual distribution of the grating period, to detect and locate transverse cracks in FRP cross-ply laminates. Their experimental results demonstrated that chirped FBG sensors could provide further information on damage locations. Takeda et al. (2008) [24] used a reconstructed spectrum to relate chirp in the spectrum to damage.
Yamauchi et al. (2008) [25] reported the successful detection of a crack using two FBG sensors. Two perpendicular FBG sensors were located near a crack, and using the spectra the crack was reported identified.
However, the chirp and distortion to the spectra of the FBG are also dependent on the loading condition. Wang et al. (2008) [13] reported that the transverse loading on the FBG sensor affected the spectra. Uncertainties of wavelength measurements were also pointed out by Dyer et al. (2005) [26]. It was reported that uncertainties of wavelength measurements using optical spectrum analyzers could lead up to the 1-nm calibration error.
2. Embedded FBG sensors
monitor internal damage effectively. The ability to embed FBG sensors inside FRP sandwich panels between different layers provides a closer look at defects such as delaminations and cracks. The FBG sensor is sensitive to stress gradients along the gauge length of the sensor and display it as a chirp from its response spectra.
2.1 Embedding process
A major advantage of using FRP composites is the possibility of deciding the number of layers and layup orientation. In an FRP composite aerospace structure, there are number of layers with multiple orientations. The layers are placed on one top on other, and hence it is possible to embed FBG sensors in any layer.
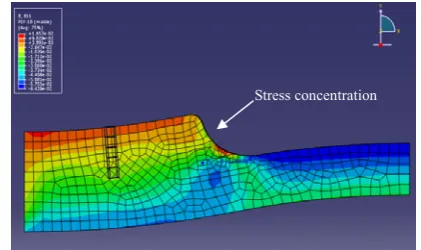
The process of embedding FBG sensors in FRP composites is quite complicated. The level of the difficulty is largely dependent on the geometry of the part, lay-up configuration, and embedding location of the sensors in the part. In general, FBG sensors will be placed closer to critical sections of the structure where high stress concentrations are predicted. However, in reality locating FBG sensors in predicted locations are not always possible. In those situations, many FBG sensors need to be embedded in the surrounding area closer to the critical locations of the structure in order to capture strain levels. As such, multiplexed FBG sensors play a critical role in SHM of aerospace structures. Normally, in FRP the damage starts from stress concentrations. In the process of implementing SHM systems, an identification of the locations that have the potential for damage is essential. Finite element analysis (FEA) techniques are widely being used to identify stress concentrations and hence to locate FBG sensors. It is less likely to place FBG sensors in simple planer structures in real applications apart from if the requirement is mere strain. Figure1 shows the FEA analysis on a base of a helicopter blade using the commercial FEA software,
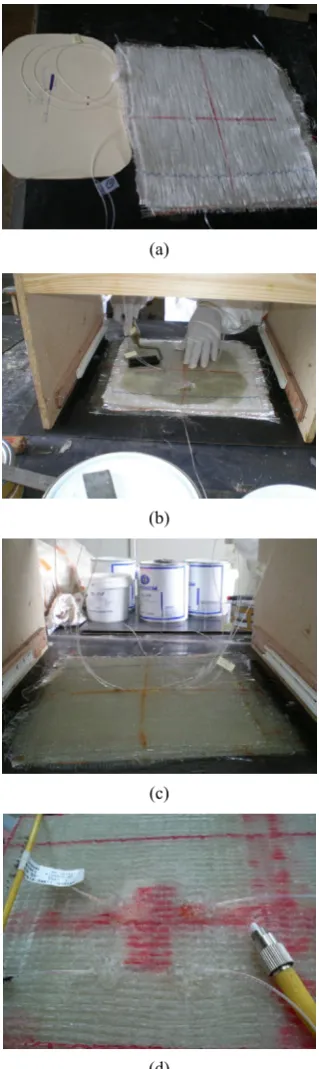
ABAQUS. From the FEA results, the stress concentrated points have been identified, and the ply with the maximum stress is selected to embed the FBG sensor. To monitor the stress concentration in Fig.1, the FBG sensor is placed as shown in the Fig. 2(a). Figure2(b) shows the completed part with embedded FBG sensors.
Stress concentration
Fig.1 FEA analysis of the helicopter blade base.
FBG Sensor
(a)
Support for the egress end of the sensor
(b)
[image:4.595.318.529.202.327.2] [image:4.595.326.523.341.672.2]The manufacturing difficulty is the main problem of placing FBG sensors in a complicated location. In advanced manufacturing technologies used in the aerospace industry, for an example the autoclave process creates hazardous environments for the brittle sensor. Every precaution needs to be taken not to apply loads on the sensor in the non-cured resin matrix during the process. With applied pressures as high as 700kPa, even the egress ends of the sensors need to be supported to avoid breakage. It is essential to develop methods to protect FBG sensors during the FRP composite manufacturing processes. Since there is no way of replacing damaged FBG sensors after manufacture of the component, a strict set of procedures must be developed to follow during the manufacture.
Figure2(a) shows a support given to the egress end of the sensor. Sometimes, it is helpful to have an extra protective layer of the rubber applied to the fiber to maximize the handling of samples without damage to the sensors.
Figure3 shows the use of the hand layup process to fabricate the FRP panel with embedded FBG sensors.
Since the FBG sensors are brittle, it is needed to be extra careful in the process. The silicon rubber is applied to the egress end of the sensors to have extra protection. Careful attention is essential when rolling near FBG sensors as shown in Fig.3(b).
For composites, a cheaper production method is needed that can characterize the process and produce less expensive composites with predictable traits. The autoclave process is extremely expensive. Quality control is very hard with the hand layup method. A cheaper alternative is the vacuum bag and oven process, which requires fewer and cheaper materials, and produces composites with similar traits. The vacuum used has the maximum pressure of 80kPa, which can still produce quality laminates. However, most of the aerospace grade composites use autoclave curing to get the required quality.
(a)
(b)
(c)
[image:5.595.345.505.83.619.2](d)
Fig. 3 Hand layup process to fabricate the FRP panel: (a) the glass fiber fabric with different fiber orientations, (b) rolling process, (c) egress ends of the FBG sensor, and (d) the cured panel with embedded FBG sensors.
2.2 Curing effect on FBG sensors
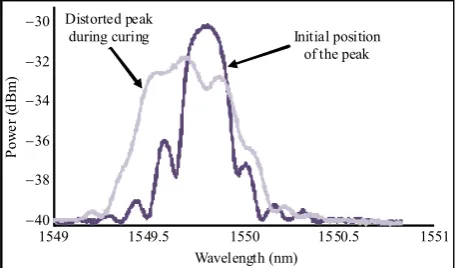
are subject to shrinkage. The shrinkage depends on the resin used and the fiber fraction. The shrinkage applies a compressive loading on the FBG sensor, and as shown in the Fig.4 the peak of the FBG sensor has moved to a new peak location after cured. It was found that pre-tensioning of the sensor was a possible solution to avoid this shrinkage effect or to locate the peak in a desirable position. The longitudinal shrinkage of the sensor does not lead to critical problems if the sensor is embedded in between unidirectional parallel fibers and parallel to the fibers.
40 38 36 34 32 30 28
1558 1559 1560 1561 1562
Wavelength (nm)
Initial position of the peak After cure position
of the peak
Po
w
er
(
dB
m
)
Fig.4 Movement of the peak during curing due to shrinkage of the thin FRP plate.
40 38 36 34 32 30
1549 1549.5 1550 1550.5 1551
Wavelength (nm)
Initial position of the peak Distorted peak
during curing
Po
w
er
(d
B
m
)
Fig. 5 Distortion of the peak during curing due to shrinkage of the thick (8mm) FRP plate.
If the FRP structure is a thin plate, the lateral shrinkage can be neglected. But in considerably thick structures, the lateral shrinkage is considerable and will distort the response spectra of the sensor. Especially, when the FBG sensor is embedded in between non parallel fibers, the sensor gets distorted
due to uneven transverse loads applied by adjacent fibers as discussed in Section 3.
2.3 Loading effect of the FBG sensor
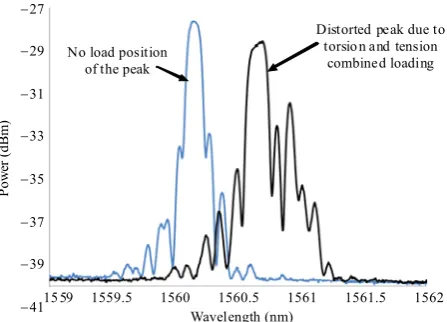
FBG sensors are suitable for strain measurement, and the linear unidirectional sensitivity in the axial direction of the sensor is desirable for accurate and reliable strain readings. In such applications, the FBG sensor undergoes pure elongation or contraction, and hence, the cross section always remains in circular shape. In multidirectional loading cases, the FBG sensor may be subject to torsional deformation other than linear elongation or contraction. For example, when a torque is applied to a composite sample which has an embedded FBG sensor, it undergoes a twist which may cause changes to its cross section. Another possibility of the changed cross section of FBG sensors under the torsional loading is due to micro-bending of the grating [25, 26]. The embedded sensor is not always laid on the matrix, and there is a possibility of laying an FBG between reinforced fiber mats. In that situation, when the structure is subject to the lateral pressure, the fiber sitting on the FBG sensor will press the FBG sensor against the fibers, causing the sensor to get the micro bending. These changes in the cross section of the FBG lead to changes in the refractive index of the core material of the sensor. Since the changes are not uniform along the grating length, the refractive index of the sensor unevenly varies along the grating length of the sensor causing distortion to the FBG spectra.
[image:6.595.53.287.285.423.2] [image:6.595.56.285.464.598.2]No load position of the peak
Distorted peak due to torsio n and tension
combined loading
27
29
31
33
35
37
39
41
P
ow
er (dB
m
)
[image:7.595.59.283.86.247.2]15 59 1559.5 1560 1560.5 1561 1561.5 1562 Wavelength (nm)
Fig. 6 Distortion of the peak due to the applied torsion and tension combined loading.
2.4 FBG interrogation
The basic principle of FBG interrogation generally is wavelength scanning. The light source can be a narrow linewidth tunable laser or a wideband light source covering the whole measurement band together with a tunable optical filter. The wavelength scanning can be realized through scanning the wavelength of the laser or tuning the filter. Recently, several new technologies have been implemented in FBG interrogation systems. However, some of these technologies show speed limitations, making the interrogators suitable for static, long-term monitoring only. Some applications are now pursuing adopting large number of sensors to be detected with a single interrogation system. In such case, a large dynamic range is needed in order to compensate for fiber losses in the installation and connection. To detect a large number of sensors simultaneously at the high speed is another challenge. Not all technologies can achieve high-speed interrogation and a large number of sensors.
Using a broadband light source to illuminate the FBG, part of the light that obeys the Bragg condition is reflected, and the rest of the light is transmitted. When an FBG undergoes a uniform strain along the grating, the FBG sensing principle becomes simply tracking the peak Bragg wavelength which shifts
proportionally to the strain and temperature. However in a non-uniform strain field, the Bragg wavelength condition is more complicated. Consequently, the reflected FBG spectrum is not only shifted as in uniform strain field, but also broadened and even split into multiple peaks. In such a case, the Bragg wavelength is difficult to track.
Among the FBG sensor interrogation mechanisms, the most widely used methods include wavelength scanning and various interferometric approaches. For interrogating a large number of sensors, there are wavelength domain multiplexing (WDM), time domain multiplexing (TDM) with modulated light source, and hybrid technologies. The wavelength interpretation can also be performed by different ways such as peak wavelength searching and tracking, curve fitting, and zero-crossing algorithms. Such interrogation technologies suffer from speed limitations; these limitations preclude their use for vibration, impact, and other dynamic measurement which require a high interrogation speed.
The main problem in the practical application of the FBG sensors is the development of methods and equipment for the high-accuracy measurement of small shifts of the Bragg peaks. Commercially, available optical spectrum analyzers (OSAs) exhibit a resolution of up to 1pm, which corresponds to a temperature variation of 0.1℃ and a relative strain of about 1.5μe (micro strain). However, the practical application of such devices is limited due to their relatively high price. Unfortunately, an OSA is often a poor choice if high-accuracy results are needed. One source of error is wavelength calibration.
limitation to use FBG sensors.
3. Self distortion of the FBG sensor
Embedding FBG sensors in between non parallel fiber layers will lead to the application of uneven transverse loads on the FBG sensor as shown in Figs. 7 and 8. The pressure load applied on the FBG sensor by the outer glass fiber layers can distort the cross section of the FBG to an oval shape. Since the FBG sensor is placed in between non-parallel fiber layers, the micro bending of the sensor is also possible. The top layer fibers undergo tension due to loading. Due to the large diameter of the FBG sensor compared to the diameter of glass fibers, there are additional transverse forces on the FBG sensors which lead to a micro bending as shown in Fig.8.
These effects will lead to a variation of the refractive index of the core material, causing the chirped spectrum. The variation of the Bragg wavelength λBragg, as a function of the change in the
refractive index Δδn and the grating period δΛo, is
given by
δλBragg= 2ΛoηΔδn + 2neffδΛo (1)
where η is the core overlap factor of about 0.9 times the shift of the Bragg wavelength, neff is the mean refractive index change, and Λo is the grating period [14].
Cylindrical cross section Torque
Oval cross section
Fig.7 Twist of the sensor due to the torsional loading.
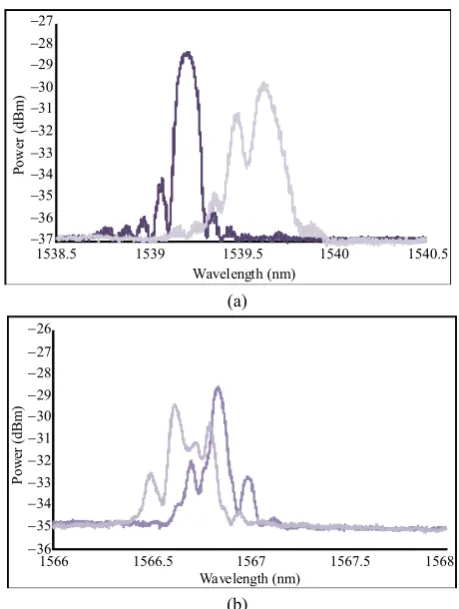
The effect of the twist and micro bending is independently identified by separately subjecting an embedded FBG sensor to the twist and micro bending. It has been observed that the micro bending causes small sharp peaks on FBG spectra [Fig.9(a)], and twisting causes chirp with smooth peaks [Fig. 9(b)] [27, 28].
90fibers
45 fibers
FBG sensor
Tensile load on fibers
Transverse forces on the FBG
Fig.8 Transverse loading on the FBG sensor causing the micro bending of the sensor.
37 36 35 34 33 32 31 30 29 28 27
1538.5 1539 1539.5 1540 1540.5
Wavelength (nm)
Pow
er (d
Bm
)
(a)
36 35 34 33 32 31 30 29 28 27 26
1566 1566.5 1567 1567.5 1568
Wavelength (nm)
P
ow
er (dBm
)
(b)
Fig. 9 Distortion to the FBG spectra during loading: (a) distortion of FBG spectra due to the micro bending and (b) distortion of FBG spectra due to twisting of the sensor.
4.
Reading FBG response and
identification of damage
[image:8.595.314.539.84.235.2] [image:8.595.306.536.268.573.2]order to identify damage from the distortions to the FBG response spectra, the individual effect from each effect needs to be identified and eliminated. To identify the pure effects from the damage, the extensive computational power is required for post processing of the spectral data. Figure10 shows FBG response spectra from an FBG embedded near a damaged location, and the part is under the complex multi-directional loading.
38 36 34 32 30 28
1560 1560.5 1561 1561.5 1562 1562.5 1563 1563.5 1564 Wavelength (nm)
Pow
er (dBm
[image:9.595.55.287.231.390.2])
Fig. 10 Distorted FBG spectra due to multiple effects.
As a consequence in the laboratory environment, it is possible to discuss and interrelate the spectra with the damage by creating an artificial damage and observing spectrum of an FBG which is embedded closer to the damage location. But in the real application if such spectrum is observed, it is very difficult to interpret the spectrum in order to identify the damage.
4.1 Processing FBG data
One approach to overcome the difficulties mentioned above is to develop a system to adapt to the initial conditions of the structure. The responses of the FBG during the undamaged states of the structure can be recorded, and this recorded data can be used as a “reference”. Therefore, the isolation of possible “reference” data from a distorted spectrum of any embedded FBG sensor will definitely provide the subsequent distortions to the spectra caused by accumulated damage. Historically, statistical methods such as artificial neural network (ANN) have been used to analyze the data associated with a
large number of random variables. The ANN can be successfully employed for the analysis of data from SHM systems which has a large number of associated random variables. The ANN can be trained with undamaged data, and subsequently, the trained ANN can distinguish any new spectral variation. The main drawbacks of this method are the difficulty of decoding distorted FBG spectra to feed in to the statistical algorithm ANN and the amount of data needed for the training stage. To address the above issues, the “fixed FBG filter decoding system” [29] was developed to capture the distortion to the FBG sensor response spectra.
4.2 Fixed FBG filter decoding system
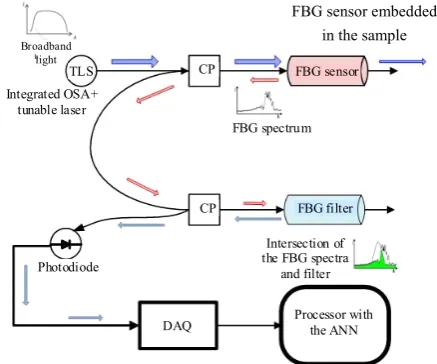
The system for decoding FBG spectrum using fixed FBG filters has been developed by several researchers, and the system used in this research work is shown in the Fig.11.
There are several attempts to fit the curves using mathematical functions, and one of the common methods used is the Gaussian curve fit. The sensor reflectivity can be expressed as
2
0 0
( , )s exp[ s( s) ]
S y S (2)
where y0is the added offset to represent the dark
noise, s is a parameter related to the full width at
the half maximum (FWHM), λ is the wavelength,
s
is the central wavelength, and S0 is the initial reflectivity of the fiber.
Integrated OSA+ tunable laser
CP TLS
FBG spectrum
Broadband light
FBG sensor
FBG filter CP
Photodiode
DAQ Processor with the ANN Intersection of the FBG spectra
and filter
Fig.11 FBG spectrum decoding system.
[image:9.595.308.527.541.723.2]Unfortunately, the Gaussian fit always gives an error for a distorted spectrum as shown in Fig.12(a). Realistically, the distorted spectrum must be considered as a piece wise continuous function, fpc,
in order to capture the distortion to FBG spectra [Fig. 12(b)].
Fig. 12 Fitting the FBG spectrum with mathematical functions: (a) the Gaussian fit and (b) the piece wise continuous function.
Consequently, the optical power P of the distorted signal can be obtained using following integral:
b
a
t
pc t
P
f dt (3)where is the constant depending on the power of the source, ta and tbare the integral limits in the time
domain. Apparently, the power integral at each point is proportional to the strain [Fig.12(b)].
The system consists of an FBG sensor, a fixed FBG filter, a photodiode (PD), two fiber optic couplersand data acquisition systems (DAQ), as shown in Fig.11. The reflected spectrum from the FBG sensor is input to the fixed external FBG filter through the couplers. The fixed FBG filter is used to get the wavelength reference to the corresponding decoded electric signal. Consequently, the intersection of the two spectrums will be outputted by the PD. The signal is captured by the high speed DAQ which is connected to the PD.
Figure13(a) shows the PD voltage in the time domain corresponding to the intersection of the spectra shown in Fig. 13(b). The tuneable laser frequency allows recording the voltage reading directly in the time domain. Since the filter spectrum is fixed, the intersection of the two spectra depends
only on the sensor spectrum position. The variation of the intersection is used to estimate the location of the peak and then the strain at the sensing point. Furthermore, any distortion to the spectrum is visible from the PD voltage-time plot.
FBG filter
FBG sensor
0 0.5
0 0.0005 0.001 0.0015 Time (s) PD output
1567 1567.5 1568 1568.5 1569
Wavelength (nm) 36.5
35.5 34.5
33.5 (a)
(b)
Fig.13 Intersection of the FBG spectra and the PD reading at 1550 N.
The system can be a set of similar unit systems which enables wider operating range.
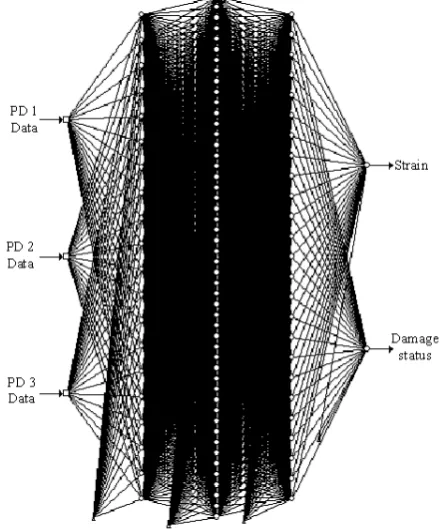
Data captured using the system is used to identify damage using an ANN. Figure14 shows an
[image:10.595.318.527.173.348.2] [image:10.595.54.289.177.295.2] [image:10.595.313.534.459.724.2]ANN used to estimate the damage status using the decoded data with three fixed FBG filters. With the adequate training, the damage was predicted with 0.3% RMS error.
Other statistical methods such as stochastic analysis may also be used for the spectral data analysis in order to identify damage to FBG response spectra.
5. Conclusions
The superior performances and the unique advantages of the FBG sensors have strongly established their place for the SHM of aerospace FRP composite structures. At this stage, the success of the SHM with FBG sensors are limited to the laboratory environment. However, to make this technology applicable in real life applications more research is warranted. The embedding technology, robustness of the sensors and FBG interrogation techniques must be critically addressed. The post processing of FBG spectral data needs to be developed with the recent advancements of statistical data analysis algorithms.
Acknowledgement
This work is created at the Centre of Excellence in Engineered Fiber Composites (CEEFC), University of Southern Queensland. The support of the Interdisciplinary Photonics Laboratory (iPL), the University of Sydney is gratefully acknowledged. The authors wish to thank the members of iPL for provision of FBG sensors and technical support during the course of the work.
Open Access This article is distributed under the terms
of the Creative Commons Attribution License which permits any use, distribution, and reproduction in any medium, provided the original author(s) and source are credited.
References
[1]F. K. Chang and K. Y. Chang, “A progressive damage
model for laminated composites containing stress-concentrations,” Journal of Composite Materials, vol. 21, no. 9, pp. 834–855, 1987.
[2]M. T. Kortschot and P. W. R. Beaumont, “Damage mechanics of composite materials: I-measurements of damage and strength,” Composites Science and Technology, vol. 39, no. 4, pp. 289–301, 1990.
[3]S. Kamiya and H. Sekine, “Prediction of the fracture strength of notched continuous fiber-reinforced laminates by interlaminar crack extension analysis,” Composites Science and Technology, vol. 56, no. 1, pp. 11–21, 1996.
[4]G. Zhou and L. M Sim, “Damage detection and assessment in fiber-reinforced composite structures with embedded fiber optic sensors-review,” Smart Materials and Structures, vol. 11, no. 6, pp. 925–939, 2002.
[5]F. K. Chang, Structural Health Monitoring. Lancaster: DESTechnol Publications, 2003.
[6]M. S. Reveley, T. Kurtoglu, K. M. Leone, J. L. Briggs, and C. A. Withrow, “Assessment of the state of the art of integrated vehicle health management technologies as applicable to damage conditions,” vol. NASA/TM—2010-216911, 2010.
[7]K. O. Hill and G. Meltz, “Fiber Bragg grating technology fundamentals and overview,” Journal of Lightwave Technology, vol. 15, no. 8, pp. 1263–1276, 1997.
[8]A. D. Kersey, M. A. Davis, H. J. Patrick, M. LeBlanc, K. P. Koo, C. G. Askins, M. A. Putnam, et al., “Fiber grating sensors,” Journal of Lightwave Technology, vol. 15, no. 8, pp. 1442–1463, 1997.
[9]P. C. Hill and B. J. Eggleton, “Strain gradient chirp of fiber Bragg gratings,” Electronics Letters, vol. 30, no. 14, pp. 1172–1174, 1994.
[10] M. LeBlanc, S. Y. Huang, M. M. Ohn, and R. M. Measures, “Tunable chirping of a fiber Bragg
grating using a tapered cantilever bed,” Electronics Letters, vol. 30, no. 25, pp. 2163–2165,1994.
[11]Y. Okabe, S. Yashiro, T. Kosaka, and N. Takeda, “Detection of transverse cracks in CFRP composites using embedded fiber Bragg grating sensors,” Smart Materials and Structures, vol. 9, no. 6, pp. 832–838, 2000.
[12]S. Takeda, Y. Okabe, and N. Takeda, “Delamination detection in CFRP laminates with embedded small-diameter fiber Bragg grating sensors,” Composites Part A: Applied Science and Manufacturing, vol. 33, no. 7, pp. 971–980, 2002.
[13]Y. Wang, H. Bartelt, W. Ecke, R. Willsch, J. Kobelke, M. Kautz, et al., “Fiber Bragg gratings in
small-core Ge-doped photonic crystal fibers,” in Proc. of Asia Pacific Optical Fiber Sensors Conference, Chengdu, China, Nov. 7–9, 2008. [14]L. I. Che-Hsien, K. Nishiguti, and M. Miyatake,
resolution in Brillouin distributed measuring technique,” in Proc. OFT2008-13, May 15–16, pp. 1–6, 2008.
[15]R. Kashyap, Fiber Bragg gratings. San Diego:
Academic Press, 1999.
[16]A. D. Kersey, M. A. Davis, T. A. Berkoff, D. G. Bellemore, K. P. Koo, and R. TJones,
“Progress towards the development of practical fiber Bragg grating instrumentation systems,” in Proc. SPIE, vol. 2839, pp. 40–63, 1996.
[17]J. A. Guemes and J. M. Menéndez, “Response of Bragg grating fiber-optic sensors when embedded in composite laminates,” Composite Science and Technology, vol. 62, no. 2, pp. 959–966, 2002. [18]E. N. Barton, S. L. Ogin, A. M. Thorne, G. T. Reed,
and B. H. Le Page, “Interaction between optical fiber sensors and matrix cracks in cross-ply GRP laminates- part 1: passive optical fibers,” Composite Science and Technology, vol. 61, no. 13, pp. 1863–1869, 2001.
[19]Y. Okabe, R. Tsuji, and N. Takeda, “Application of chirped fiber Bragg grating sensor for identification of crack location in composites,” Composites Part A: Applied Science and Manufacturing, vol. 35, no. 1, pp. 59–65, 2004.
[20]S. Yashiro, N. Takeda, T. Okabe, and H. Sekine, “A new approach to predicting multiple damage states in composite laminates with embedded FBG sensors,” Composites Science and Technology, vol. 65, no. 3–4, pp. 659–667, 2005.
[21]J. A. Eparrachchi, J. Canning, and M. Stevenson, “The response of embedded NIR (830 nm) fiber Bragg grating (FBG) sensors in glass fiber composites under fatigue loading,” Journal of Composite Structures, vol. 44, no. 7, pp. 809–819, 2009.
[22]K. Peters, M. Studer, J. Botsis, A. Iocco,
H. Limberger, and R. Salathé, “Embedded optical fiber Bragg grating sensor in a nonuniform strain field: measurements and simulations,” Experimental Mechanics, vol. 41, no. 1, pp. 19–28, 2001.
[23]M. Wu and W. P. Winfree, “Fiber optic thermal detection of composite delaminations,” in Proc. SPIE,vol. 8013, pp. 801314, 2011.
[24]S. Takeda, Y. Okabe, and N. Takeda, “Monitoring of delamination growth in CFRP laminates using chirped FBG sensors,” Journal of Intelligent Material Systems and Structures, vol. 19, no. 4, pp. 437–444, 2008.
[25]I. Yamauchi, S. Minakuchi, N. Takeda, and Y. Hidose, “Detection of arrested crack in foam core sandwich structures using embedded FBG sensors,” Kanagawa: DEStech Publications Inc., 2008.
[26]S. D. Dyer, P. Williams, R. J. Espejo, J. D. Kofler, and M. Etzel, “Fundamental limits in fiber Bragg grating peak wavelength measurements,” in Proc. SPIE, vol. 5855, pp. 88–93, 2005.
[27]G. C. Kahandawa, J. A. Epaarachchi, H. Wang, and J. Canning, “Effects of the self-distortions of embedded FBG sensors on spectral response due to torsional and combined loads,” in Proc. of APWSHM3, Tokyo, Japan, Nov. 30–Dec. 2, 2010. [28]G. C. Kahandawa, J. A. Epaarachchi, H. Wang,
D. Followell, P. Birt, J. Canning, and M. Stevenson, “An investigation of spectral response of embedded fiber Bragg grating (FBG) sensors in a hollow composite cylindrical beam under pure torsion and combined loading,” in Proc. of ACAM 6, Perth, Australia, , Dec. 13, 2010.