UNIVERSITY OF SOUTHERN QUEENSLAND
COMPETING TASKS AS MEASURES OF INTELLIGENCE
AND PREDICTORS OF JOB PERFORMANCE
A Dissertation submitted by
Bradley Dolph
For the award of
Doctor of Philosophy
Abstract
This series of studies investigated a new measure of cognitive ability, the Multi-Tasks
test, its place within the structure of intelligence and its usefulness in predicting job
performance. The Multi-Tasks test employed a competing task methodology, being the
simultaneous performance of two cognitive tasks, which has been shown to have a significant
relationship with intelligence and job performance, particularly for complex jobs. The
competing tasks methodology has a long history in psychology research and has recently
experienced a resurgence of interest as technological advances (e.g., the Internet) have made
it easier to administer these measures within the workplace. In the pilot study (Part A of
Study 1) the means, reliability and demographic group differences of the measure were
investigated. In Part B of Study 1 and Studies 2 and 3, the reliability and predictive validity
of the test was compared to measures of general mental ability (crystallized and fluid
intelligence) which have been widely used in personnel selection. Crystallized intelligence
measures are language based and influenced by culture and education, whereas fluid
intelligence tasks typically draw on non-verbal reasoning and are unaffected by education.
These measures feature prominently in the Cattell-Horn-Carroll Theory of Cognitive
Abilities, which forms the theoretical basis for these studies. In Study 2 and Study 3,
additional cognitive measures were added to further elucidate the place of Multi-Tasks within
the intelligence model, including a measure of short-term memory (Gsm in the CHC Theory).
Previous research shows short-term memory and a related concept working memory, to be
important in performance on the Multi-Tasks test. Further, the reliability and predictive
validity of Multi-Tasks was compared to a personality measure (the Big Five model of
personality) in Study 2, which is also widely used in job selection.
In all studies the Multi-Tasks test had high reliability, and it was found to be a more
Study 3. In Study 1 (Part B) it was more highly correlated with the fluid than the crystallized
intelligence measure. The addition of the short-term memory task in Study 2 revealed that
the highest correlation was between Multi-Tasks and Gsm, however this factor did not appear
in Study 3 and Multi-Tasks was, as per Study 1, a Gf measure. These findings support
previous research demonstrating that the measure is likely to be relatively independent of the
influence of culture and language and that it draws on working memory ability. All studies
showed Multi-Tasks to be a good predictor of job performance. It strongly predicted two of
three measures of job performance in Study 1 (Part B), three of four measures in Study 2 and
it was positively associated with 1 out of 3 job performance indicators in Study 3. The other
cognitive measures also predicted some measures of job performance in all studies, but not as
strongly or consistently as Multi-Tasks. Study 3 demonstrated that the factor structure and
reliability of the measure in a sample of Chinese workers was comparable to previous studies,
which indicates that the measure is not affected by culture and can be employed
cross-culturally. Other group differences in performance on the Multi-Tasks test were not
consistent between studies, however where they did exist they showed older and more highly
educated workers to perform better. This supports research showing that the Multi-Tasks test
shows promise as a predictor of performance in complex jobs and managerial potential.
There were a number of limitations discussed and many opportunities for further
research. Overall the results of these studies indicate that the Multi-Tasks test shows promise
as a valid, reliable, culturally unbiased measure of job performance that is suitable for a
variety of job roles, both in Australia and cross-culturally, and may be particularly useful as
an indicator of management potential. As a new test, further research to replicate these
findings is encouraged.
Keywords: competing tasks, multi-tasks, CHC Theory, attention, working memory,
CERTIFICATION OF DISSERTATION
I certify that the ideas, experimental work, results analyses, software and conclusions
reported in this dissertation are entirely my own effort, expect where otherwise
acknowledged. I also certify that the work is original and has not been previously submitted
for any other award, expect where otherwise acknowledged.
Signature of Candidate Date
ENDORSEMENT
ACKNOWLEDGEMENTS
First and foremost I want to thank my principal supervisor, Professor Gerard Fogarty for your
unwavering support and guidance throughout my PhD journey. Finding you was a Godsend.
To my associate supervisor Professor Lazar Stankov whose career inspired me to begin my
research. Thank you for all your encouragement over the last decade.
In the early days of my dissertation and planning, I must give a special thanks to my friends
Dr Richard Roberts and Dr John Crawford for their enthusiasm and guidance.
A special thanks to my programmer and Web wizard Giles Wycherley. There is nothing you
cannot do when it comes to software.
Many thanks to those organisations who helped provide the data for this research program.
Without you, this PhD would not be possible. Specifically, I would like to thank HAYS,
Bankwest and Goodyear for their support.
I would like to dedicate this PhD to my son Toby and wife Melinda, the most important
people in my life. To my Mum and Dad who taught me to never give up and encouraged me
Table of Contents
Abstract ... II
Certification of Dissertation ... IV
Acknowledgements ... V
Table of Contents ... VI
List of Tables ... XV
List of Appendices ... XXII
CHAPTER 1 ... 23
1.1 STRUCTURE ... 24
1.2 STATEMENT OF OBJECTIVES ... 24
1.3 BROAD STUDY AIMS ... 25
CHAPTER 2 ... 27
2.1. DEFINITION OF COMPETING TASKS ... 28
2.1.1 Mechanisms underlying performance on competing tasks. ... 29
2.1.1.1 Capacity models of attention. ... 29
2.1.1.2 Individual differences... 31
2.1.1.3 Timesharing. ... 31
2.2. THE CHCTHEORY OF COGNITIVE ABILITIES ... 34
2.2.1 Definitions of broad abilities. ... 37
2.2.2 Working memory and the CHC Theory... 40
2.2.3 Mental speed- the key to understanding intelligence? ... 41
2.3. COMPETING TASKS AND INTELLIGENCE ... 42
2.3.2 Competing tasks, Gf and WM. ... 42
2.3.2.1 Competing tasks and processing speed... 45
2.3.3 Cognitive mechanisms underlying competing tasks. ... 46
2.3.3.1 Complexity. ... 46
2.3.3.2 Pools of resources. ... 48
2.3.3.3 Attention. ... 49
2.4. INTELLIGENCE AND JOB PERFORMANCE ... 51
2.5. COMPETING TASKS AND JOB PERFORMANCE ... 53
2.5.1 Methodological considerations. ... 57
2.5.1.1 Task properties... 57
2.5.1.2 Practice. ... 59
2.5.1.3 Feedback and incentives. ... 59
2.5.1.4 Internet based testing. ... 60
2.6. SUMMARY AND RATIONALE ... 62
2.7. STUDY AIMS ... 64
2.8 METHOD ... 69
2.8.1 Participants. ... 69
2.8.2 Materials. ... 70
2.8.3 Procedure. ... 72
2.9 RESULTS ... 73
2.9.1 Preliminary Procedures. ... 73
2.9.1.1 Outlier checks. ... 73
2.9.1.2 Descriptive statistics and reliabilities of the measures... 73
2.9.1.3 Multi-Tasks scores across demographic groups. ... 74
2.9.1.3.2 Level of education. ... 75
2.9.1.3.3 Age. ... 75
2.10. METHOD ... 77
2.10.1 Participants. ... 77
2.10.2 Materials. ... 78
2.10.2.1 Digit Sequence test. ... 78
2.10.2.2 Word Reasoning test. ... 79
2.10.2.3 Multi-Tasks test. ... 80
2.10.2.4 Job performance measures. ... 81
2.10.3 Procedure. ... 81
2.11. RESULTS ... 82
2.11.1 Preliminary Procedures. ... 82
2.11.1.1 Outlier checks. ... 82
2.11.1.2 Descriptive statistics and reliabilities of the measures... 82
2.11.1.3 Correlations among variables. ... 83
2.11.1.4 Multi-Tasks scores across demographic groups. ... 86
2.11.1.4.1 Gender. ... 86
2.11.1.4.2 Level of education. ... 86
2.11.1.4.3 Age. ... 87
2.11.2 Results of Measurement and Structural Model Tests. ... 88
2.11.2.1 Parcels for measurement and structural model tests. ... 88
2.11.2.2 Multi-Task parcels. ... 88
2.11.2.3 Digit sequence and word reasoning parcels. ... 89
2.11.2.4 Normality of parcels. ... 89
2.11.3.1 Procedure for model evaluation. ... 90
2.11.3.2 Confirmatory factor analysis of the Multi-Tasks test. ... 91
2.11.3.3 Confirmatory factor analysis of the full measurement model. ... 93
2.11.4 Predictive Validity of the Intelligence Measures. ... 97
2.12. DISCUSSION ... 101
2.13. CONCLUSION ... 104
CHAPTER 3 ... 105
3.1 COMPETING TASK RESEARCH ... 106
3.2 MULTI-TASKS,GSM AND WORKING MEMORY ... 107
3.3 GF,GSM AND TASK COMPLEXITY ... 109
3.4 PERSONALITY ASSESSMENT ... 110
3.5 PERSONALITY AND COGNITIVE ABILITIES ... 110
3.5.1 Extraversion and WM. ... 111
3.5.2 Implications for Performance on Multi-Tasks and job performance. ... 113
3.6 PERSONALITY ASSESSMENT AND JOB PERFORMANCE ... 114
3.6.1 Personality Research in the 20th and 21st Centuries. ... 114
3.6.2 The Five Factor Model of Personality. ... 115
3.6.3 Early Meta-Analytic Evidence for the Relationship between the FFM and job performance. ... 117
3.6.4 Relationship between each of the Five Factors and Job Performance. ... 118
3.6.4.1 Conscientiousness. ... 118
3.6.4.2 Emotional Stability... 119
3.6.4.3 Agreeableness, Openness to Experience and Extraversion. ... 119
3.7 IMPLICATIONS AND METHODOLOGICAL CONCERNS ... 120
3.9 METHOD ... 128
3.9.1 Participants. ... 128
3.9.2 Materials. ... 129
3.9.2.1 Digit Sequence Test... 130
3.9.2.2 Matrices. ... 130
3.9.2.3 Reading Comprehension. ... 131
3.9.2.4 Word Reasoning Test. ... 132
3.9.2.5 Digit Span. ... 133
3.9.2.6 Multi-Tasks Test. ... 134
3.9.2.7 OCEANIC Personality Inventory. ... 134
3.9.2.8 Job Performance Measures. ... 136
3.9.3 Procedure. ... 136
3.10 RESULTS ... 137
3.10.1 Preliminary Procedures. ... 137
3.10.1.1 Outlier checks. ... 137
3.10.1.2 Descriptive Statistics and Reliabilities for the Multi-Tasks Subscales. ... 137
3.10.1.2.1 Word Recall. ... 138
3.10.1.2.2 Placement Keeping. ... 138
3.10.1.3 Descriptive Statistics and Reliability Measures for the other Intelligence Scales. ... 138
3.10.1.3.1 Matrices. ... 138
3.10.1.3.2 Reading Comprehension. ... 138
3.10.1.3.3 Digit Sequence... 139
3.10.1.3.4 Word Reasoning. ... 139
3.10.1.4 Descriptive Statistics for the Five Personality Subscales. ... 140
3.10.1.5 Descriptive Statistics for the Job Performance Measures. ... 140
3.10.1.6 Correlations between variables. ... 141
3.10.2 Multi-Tasks Scores across Demographic Groups. ... 142
3.10.2.1 Gender... 143
3.10.2.2 Level of Education. ... 143
3.10.2.3 Age. ... 144
3.10.3 Results of Measurement and Structural Model Tests. ... 145
3.10.3.1 Parcels for Measurement and Structural Model Tests. ... 145
3.10.3.1.1 Multi-Tasks Parcels... 145
3.10.3.1.2 Parcels for the other Intelligence Test Scales. ... 146
3.10.3.2 Model Evaluation. ... 147
3.10.3.3 Confirmatory Factor Analysis of Multi-Tasks Tests. ... 147
3.10.3.4 Confirmatory Factor Analysis of the Full Measurement Model. ... 149
3.10.3.5 Predictive Validity of the Intelligence Measures. ... 155
3.10.3.5.1 Job Performance. ... 155
3.10.3.5.2 Years of service. ... 157
3.10.3.5.3 Employment Status. ... 158
3.10.3.5.4 Job Level. ... 159
3.10.3.6 Predictive Validity of the Multi-Tasks and Personality Measures. ... 161
3.10.3.6.1 Job Performance. ... 163
3.10.3.6.2 Years of Service. ... 163
3.10.3.6.3 Employment Status. ... 164
3.10.4 The relationship between the Multi-Tasks measure and the Five Personality
Subscales. ... 166
3.11 DISCUSSION ... 167
CHAPTER 4 ... 179
4.1 SUMMARY OF STUDY 1 AND STUDY 2 ... 180
4.2 THE MULTI-TASKS TEST AND THE CHCTHEORY OF COGNITIVE ABILITIES ... 181
4.3 HISTORY OF COGNITIVE TESTING IN CHINA ... 182
4.3.1. Use of cognitive ability tests cross culturally. ... 184
4.3.2. Challenges associated with using foreign ability tests. ... 184
4.3.3. Successful adaptation of measures and ‘culture-fair’ assessments. ... 187
4.3.4. Performance of Chinese participants with specific cognitive domains. ... 188
4.3.4.1 Working memory. ... 188
4.3.4.2 Attention. ... 189
4.4 GROUP DIFFERENCES IN COGNITIVE ABILITY WITHIN CHINA ... 191
4.4.1. ‘Single’ children... 191
4.4.2. City vs. rural... 191
4.4.3. Gender differences. ... 192
4.5 INTELLIGENCE AND LATER SUCCESS ... 192
4.6 STUDY AIMS ... 192
4.7 METHOD ... 198
4.7.1 Participants. ... 198
4.7.2 Materials. ... 199
4.7.2.1 Digit Sequence test. ... 200
4.7.2.2 Matrices. ... 200
4.7.2.4 Word Reasoning test. ... 202
4.7.2.5 Number Series test. ... 202
4.7.2.6 Digit Span test. ... 203
4.7.2.7 Multi-Tasks test. ... 203
4.7.2.8 Job Performance measures. ... 204
4.7.3 Procedure. ... 204
4.8 RESULTS ... 206
4.8.1 Preliminary Procedures. ... 206
4.8.1.1 Outlier checks. ... 206
4.8.1.2 Descriptive statistics and reliabilities for the Multi-Tasks subscales. ... 206
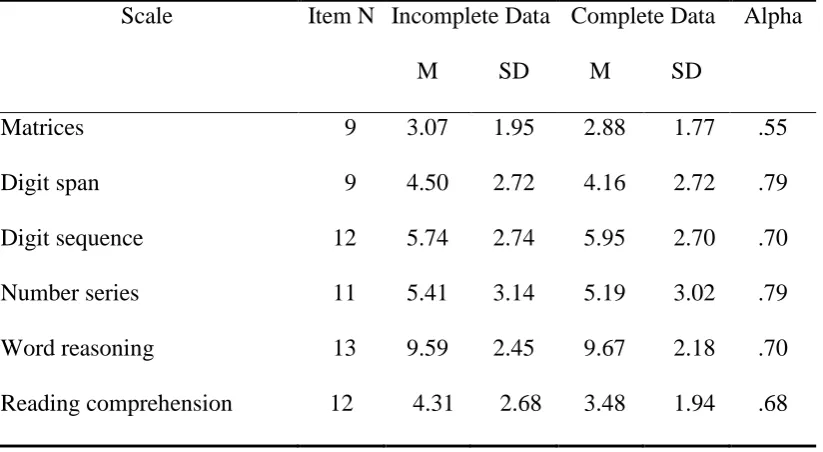
4.8.1.3 Descriptive statistics for the other cognitive ability measures. ... 207
4.8.1.4 Descriptive statistics for the Job Performance measures. ... 208
4.8.2 Correlations amongst the Variables. ... 210
4.8.3 Multi-Tasks Scores across Demographic Groups. ... 210
4.8.3.1 Gender... 211
4.8.3.2 Age. ... 211
4.8.3.3 Levels of education. ... 212
4.8.4 Multi-Tasks and Job Performance Measures. ... 214
4.8.4.1 Absenteeism... 214
4.8.4.2 Unreliability. ... 214
4.8.4.3 Job Level. ... 215
4.8.5 Results of Measurement Model Tests. ... 216
4.8.5.1 Creation of parcels. ... 216
4.8.5.2 Assessment of multivariate normality. ... 217
4.8.5.4 Confirmatory factor analysis for the Multi-Tasks measurement model. ... 218
4.8.5.5 Results for the confirmatory factor analysis of the full measurement model. . ... 220
4.8.6 Predictive Validity of the Intelligence Measures. ... 224
4.8.6.1 Correlations between intelligence and Job Performance. ... 224
4.8.6.2 Predictors of Job Level. ... 225
4.9 DISCUSSION ... 227
CHAPTER 5 ... 233
GENERAL DISCUSSION ... 234
5.1 GENDER ... 234
5.2 EDUCATION... 234
5.3 AGE ... 235
5.4 DEMOGRAPHIC EFFECTS BETWEEN THE STUDIES ... 236
5.5 CORRELATIONS BETWEEN TESTS AND CONFIRMATORY FACTOR ANALYSIS ... 237
5.6 KEY STATISTICAL STRENGTHS OF MULTI-TASKS ... 239
5.7 JOB PERFORMANCE OUTCOMES ... 239
5.7.1 Quality of job performance data. ... 240
5.8 IDIOSYNCRASIES OF DATASETS AND OTHER CHALLENGES ... 241
5.9 CROSS CULTURAL CONSIDERATIONS ... 242
5.10 CONCLUSION ... 243
List of Tables
TABLE 1.1CHC BROAD ABILITY DOMAIN TERMS, CORRESPONDING CATTELL–HORN AND
CARROLL BROAD ABILITY TERMS, AND DEFINITIONS. ... 39
TABLE 1.2AGE OF PARTICIPANTS ... 69
TABLE 1.3EDUCATION LEVEL OF PARTICIPANTS ... 70
TABLE 1.4DESCRIPTIVE STATISTICS AND ALPHA COEFFICIENTS FOR THE VARIABLES ... 74
TABLE 1.5MEANS AND STANDARD DEVIATIONS FOR MULTI-TASKS SCORES OF MALES AND FEMALES ... 74
TABLE 1.6MEANS AND STANDARD DEVIATIONS FOR MULTI-TASKS SCORES ACROSS LEVELS OF EDUCATION ... 75
TABLE 1.7MEANS AND STANDARD DEVIATIONS FOR MULTI-TASKS SCORES ACROSS AGE GROUPS ... 76
TABLE 1.8AGE OF PARTICIPANTS ... 77
TABLE 1.9EDUCATION LEVEL OF PARTICIPANTS ... 78
TABLE 1.10DESCRIPTIVE STATISTICS AND ALPHA COEFFICIENTS FOR THE VARIABLES ... 83
TABLE 1.11KENDALL TAU CORRELATIONS BETWEEN VARIABLES... 85
TABLE 1.12MEANS AND STANDARD DEVIATIONS FOR MULTI-TASKS SCORES OF MALES AND FEMALES ... 86
TABLE 1.13MEANS AND STANDARD DEVIATIONS FOR MULTI-TASKS SCORES ACROSS LEVELS OF EDUCATION ... 87
TABLE 1.14MEANS AND STANDARD DEVIATIONS FOR MULTI-TASKS SCORES ACROSS AGE GROUPS ... 88
TABLE 1.15FIT INDICES FOR THE MULTI-TASKS MEASUREMENT MODELS ... 92
TABLE 1.16FIT INDICES FOR THE INTELLIGENCE MODEL ... 94
TABLE 1.18PATH COEFFICIENTS FOR THE STRUCTURAL MODEL ... 100
TABLE 1.19SQUARED MULTIPLE CORRELATIONS FOR THE ENDOGENOUS CONSTRUCTS OF THE STRUCTURAL MODEL ... 100
TABLE 2.1DESCRIPTIONS OF BIG FIVE FACTORS ... 116
TABLE 2.2AGE OF PARTICIPANTS ... 128
TABLE 2.3EDUCATION LEVEL OF PARTICIPANTS ... 129
TABLE 2.4DESCRIPTIVE STATISTICS AND ALPHA COEFFICIENTS FOR THE MULTI-TASKS SUBSCALES ... 138
TABLE 2.5DESCRIPTIVE STATISTICS AND ALPHA COEFFICIENTS FOR THE INTELLIGENCE SCALES ... 140
TABLE 2.6DESCRIPTIVE STATISTICS AND ALPHA COEFFICIENTS FOR THE PERSONALITY SUBSCALES ... 140
TABLE 2.7FREQUENCIES AND PERCENTAGES FOR JOB PERFORMANCE MEASURES ... 141
TABLE 2.8DESCRIPTIVE STATISTICS FOR JOB PERFORMANCE MEASURES ... 141
TABLE 2.9KENDALL TAU CORRELATIONS BETWEEN STUDY VARIABLES... 142
TABLE 2.10MEANS AND STANDARD DEVIATIONS FOR MULTI-TASKS SCORES OF MALES AND FEMALES ... 143
TABLE 2.11MEANS AND STANDARD DEVIATIONS FOR MULTI-TASKS SCORES ACROSS LEVELS OF EDUCATION ... 144
TABLE 2.12MEANS AND STANDARD DEVIATIONS FOR MULTI-TASKS SCORES ACROSS AGE GROUPS ... 145
TABLE 2.13FIT INDICES FOR THE MULTI-TASKS MEASUREMENT MODELS ... 148
TABLE 2.14FIT INDICES FOR THE INTELLIGENCE MODEL ... 153
TABLE 2.16LINEAR REGRESSION RESULTS FOR THE JOB PERFORMANCE MODEL ... 156
TABLE 2.17PEARSON CORRELATIONS BETWEEN INTELLIGENCE MEASURES AND YEARS OF SERVICE ... 157
TABLE 2.18LINEAR REGRESSION RESULTS FOR THE YEARS OF SERVICE MODEL ... 158
TABLE 2.19LOGISTIC REGRESSION RESULTS FOR THE EMPLOYMENT STATUS MODEL ... 159
TABLE 2.20LOGISTIC REGRESSION RESULTS FOR THE EMPLOYMENT STATUS MODEL ... 160
TABLE 2.21PEARSON CORRELATIONS AMONGST THE PERSONALITY SUBSCALES ... 161
TABLE 2.22PEARSON CORRELATIONS AMONGST THE PERSONALITY SUBSCALES ... 162
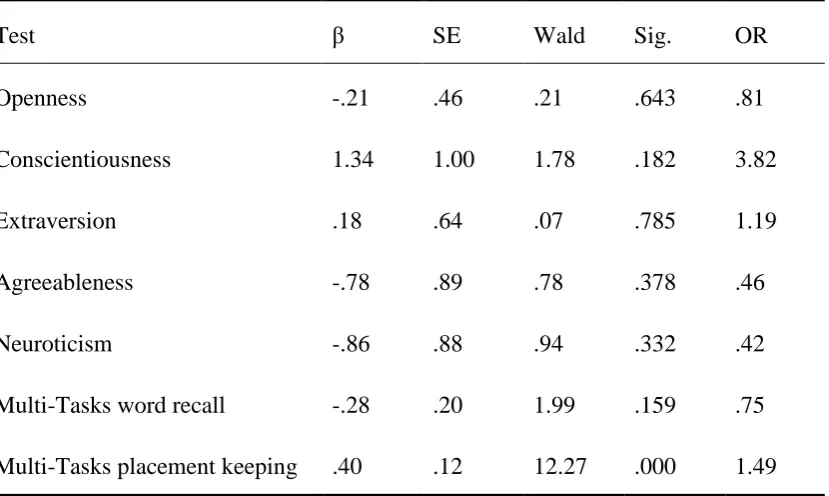
TABLE 2.23LINEAR REGRESSION RESULTS FOR MULTI-TASKS,PERSONALITY TRAITS, AND JOB PERFORMANCE ... 163
TABLE 2.24LINEAR REGRESSION RESULTS FOR MULTI-TASKS,PERSONALITY TRAITS, AND YEARS OF SERVICE ... 164
TABLE 2.25LOGISTIC REGRESSION RESULTS FOR MULTI-TASKS,PERSONALITY TRAITS, AND EMPLOYMENT STATUS ... 165
TABLE 2.26LOGISTIC REGRESSION RESULTS FOR MULTI-TASKS,PERSONALITY TRAITS, AND JOB LEVEL ... 166
TABLE 3.1AGE OF PARTICIPANTS ... 198
TABLE 3.2EDUCATION LEVEL OF PARTICIPANTS ... 199
TABLE 3.3DESCRIPTIVE STATISTICS AND ALPHA COEFFICIENTS FOR THE MULTI-TASKS SUBSCALES ... 207
TABLE 3.4DESCRIPTIVE STATISTICS AND ALPHA COEFFICIENTS FOR THE OTHER INTELLIGENCE SCALES ... 208
TABLE 3.5JOB PERFORMANCE MEASURES ... 209
TABLE 3.7MEANS AND STANDARD DEVIATIONS FOR MULTI-TASKS SCORES OF MALES AND
FEMALES ... 211
TABLE 3.8MEANS AND STANDARD DEVIATIONS FOR MULTI-TASKS SCORES ACROSS AGE
GROUPS ... 212
TABLE 3.9MEANS AND STANDARD DEVIATIONS FOR MULTI-TASKS SCORES ACROSS LEVELS
OF EDUCATION ... 213
TABLE 3.10MEANS AND STANDARD DEVIATIONS FOR MULTI-TASKS SCORES ACROSS LEVELS
OF ABSENTEEISM ... 214 TABLE 3.11MEANS AND STANDARD DEVIATIONS FOR MULTI-TASKS SCORES ACROSS LEVELS
OF UNRELIABILITY ... 215 TABLE 3.12MEANS AND STANDARD DEVIATIONS FOR MULTI-TASKS SCORES ACROSS JOB
LEVELS ... 216
TABLE 3.13CHI-SQUARE RESULTS AND FIT INDICES FOR THE MULTI-TASKS MEASUREMENT
MODELS ... 220
TABLE 3.14CHI-SQUARE RESULTS AND FIT INDICES FOR THE FULL MEASUREMENT MODELS
... 221
TABLE 3.15KENDALL TAU CORRELATIONS BETWEEN THE INTELLIGENCE MEASURES AND JOB
PERFORMANCE ... 225 TABLE 3.16MULTIPLE LINEAR REGRESSION RESULTS FOR INTELLIGENCE AND JOB LEVEL... 226
TABLE 3.17MULTIPLE LINEAR REGRESSION RESULTS FOR WEIGHTED INTELLIGENCE MEASURE
AND JOB LEVEL ... 226
TABLE 4.1EFFECT SIZES FOR MULTI-TASKS SCORES ACROSS GENDER,LEVELS OF EDUCATION,
List of Figures
FIGURE 1.1SCHEMATIC REPRESENTATION AND COMPARISONS OF CARROLL'S THREE-STRATUM,
CATTELL–HORN'S EXTENDED GF–GC, AND THE INTEGRATED CATTELL–HORN–CARROLL
MODELS OF HUMAN COGNITIVE ABILITIES. ... 36
FIGURE 1.2.PROPOSED MULTI-TASKS MODEL. ... 65
FIGURE 1.3PROPOSED MODEL FOR MULTI-TASKS,GF, AND GC MEASURES. ... 67
FIGURE 1.4PROPOSED MODEL TESTING THE PREDICTIVE VALIDITY OF THE INTELLIGENCE MEASURES AGAINST THE JOB PERFORMANCE MEASURES. ... 68
FIGURE 1.5.MULTI-TASKS TEST PLACEMENT KEEPING SUB-TASK (LEFT), THEN WORD RECALL SUB-TASK (RIGHT). ... 72
FIGURE 1.6SAMPLE OF A DIGIT SEQUENCE TEST ITEM. ... 79
FIGURE 1.7SAMPLE OF WORD REASONING TEST ITEM. ... 80
FIGURE 1.8.THREE-FACTOR MEASUREMENT MODEL FOR MULTI-TASKS (STANDARDISED COEFFICIENTS). ... 93
FIGURE 1.9.FULL MULTI-TASKS MEASUREMENT MODEL INCLUDING SINGLE TESTS. ... 95
FIGURE 1.10.REVISED MEASUREMENT MODEL FOR INTELLIGENCE. ... 96
FIGURE 1.11.PREDICTIVE VALIDITY MODEL FOR MULTI-TASKS TEST. ... 99
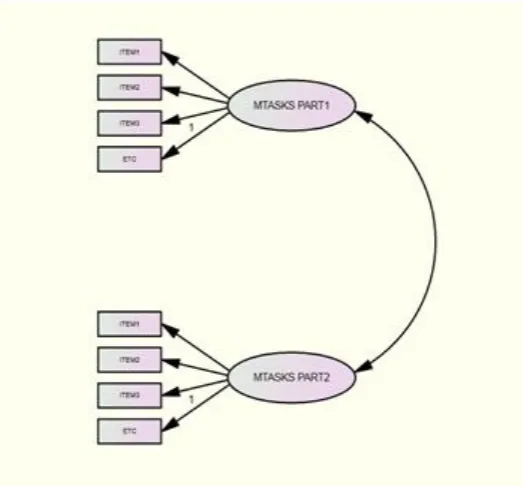
FIGURE 2.1.PROPOSED MEASUREMENT MODEL FOR MULTI-TASKS. ... 124
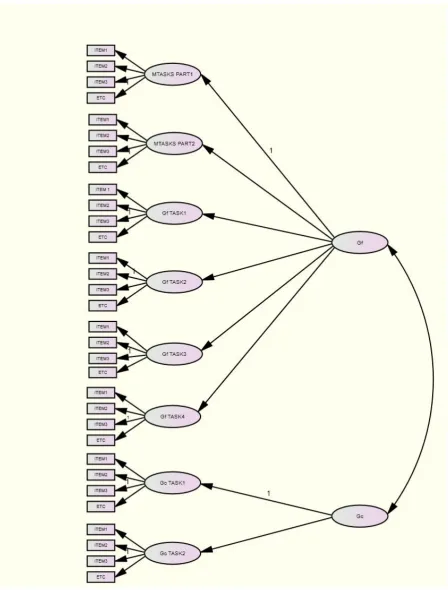
FIGURE 2.2.PROPOSED MEASUREMENT MODEL FOR MULTI-TASKS AND OTHER INTELLIGENCE MEASURES. ... 125
FIGURE 2.3.PROPOSED MEASUREMENT MODEL FOR MULTI-TASKS AND OTHER INTELLIGENCE MEASURES (2). ... 127
FIGURE 2.4.DIGIT SEQUENCE TASK ... 130
FIGURE 2.5.MATRICES TASK ... 131
FIGURE 2.7WORD REASONING TASK. ... 133
FIGURE 2.8.MULTI-TASKS PLACEMENT KEEPING COMPONENT (LEFT) AND THEN WORD RECALL COMPONENT (RIGHT) ... 134
FIGURE 2.9.MULTI-TASKS TEST ANSWER OPTION WHEREBY THE PARTICIPANT MUST RECALL THE NUMBER OF BALLS IN EACH BOX AND THEN THE ORDER OF ONE OF THE WORDS SHOWN IN THE DISPLAY ... 134
FIGURE 2.10.PERSONALITY MEASURE ... 135
FIGURES 2.11TWO-FACTOR MODEL FOR MULTI-TASKS TEST (STANDARDISED COEFFICIENTS) 149 FIGURES 2.12.PROPOSED TWO-FACTOR MEASUREMENT MODEL. ... 151
FIGURES 2.13.PROPOSED THREE-FACTOR MEASUREMENT MODEL. ... 152
FIGURES 2.14.REVISED MEASUREMENT MODEL. ... 154
FIGURE 3.1.PROPOSED MEASUREMENT MODEL FOR MULTI-TASKS. ... 194
FIGURE 3.2.PROPOSED MEASUREMENT MODEL FOR MULTI-TASKS AND OTHER INTELLIGENCE MEASURES. ... 195
FIGURE 3.3.PROPOSED MEASUREMENT MODEL FOR MULTI-TASKS AND OTHER INTELLIGENCE MEASURES (2). ... 197
FIGURE 3.4.DIGIT SEQUENCE TASK ... 200
FIGURE 3.5.MATRICES TASK ... 201
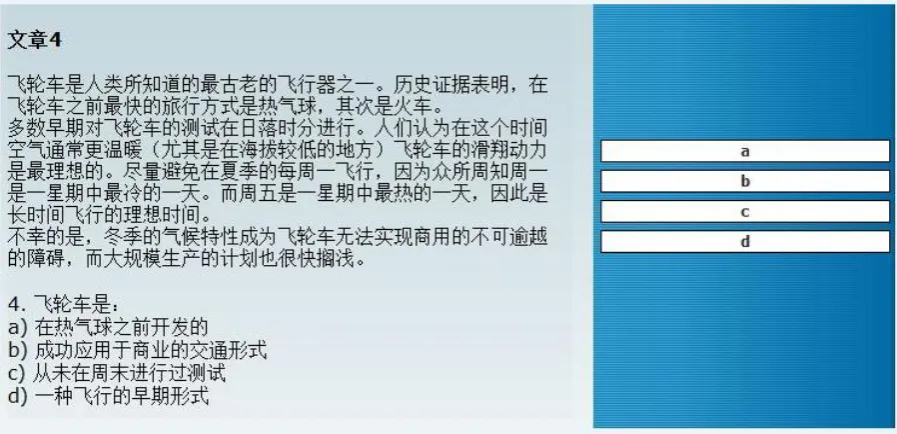
FIGURE 3.6.READING COMPREHENSION TASK ... 201
FIGURE 3.7.WORD REASONING TASK ... 202
FIGURE 3.8.NUMBER SERIES TASK ... 203
FIGURE 3.10.MULTI-TASKS TEST ANSWER OPTION WHEREBY THE PARTICIPANT MUST RECALL
THE NUMBER OF BALLS IN EACH BOX AND THEN THE ORDER OF ONE OF THE WORDS SHOWN IN THE DISPLAY ... 204 FIGURE 3.11.RESULTS FOR THE PROPOSED TWO-FACTOR MODEL (WITH STANDARDISED
COEFFICIENTS). ... 219
FIGURE 3.12.RESULTS FOR THE PROPOSED SECOND-ORDER TWO-FACTOR FULL MEASUREMENT
MODEL (WITH STANDARDISED COEFFICIENTS). ... 222
FIGURE 3.13.RESULTS FOR THE ALTERNATIVE SECOND-ORDER SINGLE-FACTOR FULL
List of Appendices
APPENDIX 1A ... 268
APPENDIX 1B ... 274 APPENDIX 1C ... 276
APPENDIX 1D ... 279 APPENDIX 2A ... 281
APPENDIX 2B ... 290
APPENDIX 2C ... 292 APPENDIX 2D ... 294
APPENDIX 2E ... 296 APPENDIX 2F ... 300
APPENDIX 3A ... 302
APPENDIX 3B ... 307 APPENDIX 3C ... 310
CHAPTER 1
INTRODUCTION
COMPETING TASKS AS MEASURES OF INTELLIGENCE
1.1 Structure
This dissertation comprises five chapters. This chapter briefly sets the scene for the
next four chapters. Chapters two, three and four cover the four studies undertaken for this
dissertation. Each chapter is devoted to a separate study with the exception of Study 1, which
comprises two parts; Part A (the pilot study) and Part B (the first study to include job
performance data). Study 1 is covered in Chapter 2, Study 2 is covered in Chapter 3 and
Study 3 is covered in Chapter 4. Chapter 5 forms the general discussion and conclusion.
1.2 Statement of Objectives
The competing task paradigm refers to tasks that require simultaneous performance of
two cognitive activities (Stankov, 2003), such as remembering the number and location of
balls in cups while, at the same time, the order of presentation of words. One task may be
presented in one modality (e.g., a visual presentation of balls moving between cups) and one
in another (e.g., spoken words), or both may be presented in the same modality; the key
requirement is that mental operations need to be carried out within the same period of time.
Competing task paradigms have a long history in psychology research. They have
been used in different domains of psychology, from cognitive to organisational,
neuropsychology and studies of individual differences; in both experimental and human
factors settings to test theories of attention and to explore aspects of applied cognition
(Kahneman, 1973; Sauer, Wastell, & Hockey, 1999; Shirey & Reynolds, 1988; Spelke, Hirst,
& Neisser, 1976). Their use has been widespread and varied but also sporadic, largely
because they have traditionally been difficult and costly to construct and administer (Moreno
& Mayer, 1999; Schmitt & Mills, 2001). For instance, to conduct research in this area in the
1970s expert assistance from technicians in acoustic laboratories was required (Stankov &
Horn, 1980) or it was confined to settings equipped with sophisticated technology such as
These difficulties are easing as the technology required for competing task
construction becomes available to people working outside well-equipped laboratories
(Moreno & Mayer, 1999; Wickens & Seidler, 1997). Increasingly, the value of this paradigm
in applied settings is being realised, and in recent times competing tasks have been used in
research related to job selection (Stankov, Fogarty & Watt, 1989).
A question of particular interest to this research study was the potential of competing
tasks to predict job performance. To explore this question, it was necessary to explain how
the abilities measured by competing tasks related to other well-established predictors of job
performance, notably general mental ability and personality. The pilot study (Study 1 Part A)
established the general test properties of the competing task measure, Study 1 (Part B)
explored the relationship between competing task performance and other ability measures.
Study 2 expanded the research to include personality measures and Study 3 investigated
cross-cultural differences. The literature review that follows will further explore the
competing task paradigm, outline the theory of intelligence that served as the framework for
this research study, and explain how competing tasks relate to the various components of the
this theory.
1.3 Broad Study Aims
The broad aims for the three studies are as follows:
1. To determine whether the Multi-Tasks test is a reliable measure.
2. To investigate the underlying factor structure of the Multi-Tasks test.
3. To determine the place of Multi-Tasks within the model of intelligence, with
reference to The CHC Theory of Cognitive Abilities.
4. To determine the predictive validity of Multi-Tasks with reference to job
5. To compare the predictive validity of Multi-Tasks with other well-known
measures of job performance, including cognitive ability tests and personality
measures.
6. To investigate the cross-cultural validity of the Multi-Tasks tests within the
Chinese workforce.
7. To investigate group differences in performance on Multi-Tasks, including
CHAPTER 2
STUDY 1
PILOT STUDY (PART A)
AND
COMPETING TASKS AS MEASURES OF INTELLIGENCE
Competing Tasks, the Multi-Tasks Test, Intelligence and Job Performance
2.1. Definition of Competing Tasks
Competing tasks are tasks that are performed simultaneously or with a short delay
between them. It should be noted that ‘competing-task’ or similar terms such as ‘dual-task’
are sometimes used in methodologies where one task is a distractor or is secondary to the
other (e.g., listening to music whilst working) or requires a motor rather than a cognitive
response (e.g., pushing a button) (Schumacher & Schwarb, 2009). These are not the
paradigms of interest in the current dissertation. The paradigms that are of interest involve
demanding tasks which compete for attention, thus producing an information ‘overload’
(Stankov, 1983b). Good examples of such tasks are those from the aviation industry which
has a long history of using competing task paradigms in their personnel selection processes.
The industry requires in their pilots and air traffic controllers an ability to attend and respond
to numerous pieces of information simultaneously, thus they have incorporated these tasks
into psychometric testing for job candidates. Most recently, the US Federal Aviation
Administration Air Traffic Controller Selection and Training battery (AT-SAT) includes two
multi-tasking tasks, one which is directly relevant to the job role and involves an air traffic
control scenario whereby candidates are required to keep track of numerous flights and one
which is not directly job related but involves categorising letters and prioritising tasks
according to a set of rules (Dattel & King, 2010; King, Manning, and Drechsler, 2006).
Detailed explanations of these tasks are not provided, presumably so as not to give potential
job applicants the opportunity to practice these tasks in advance.
The other area where competing tasks have been long been employed is in
university-based research where such tasks have been developed and trialled on university students with
a view to these tasks being adopted in personnel selection outside the university. In such
recalling the order of presentation of a target word/letter or the number of times a certain
word or letter string occurs), mental calculations (e.g., adding numbers, mentally swapping
the order of numbers or letters) and auditory monitoring (e.g., recalling the number of times a
tone of a certain pitch is presented) (Stankov, 2003; Wang, Proctor, & Pick, 2007).
Participants are initially asked to do a single task, and then later they are given items from
two of the tasks at the same time, either presented through different modalities, or both
through the same modality with a short delay between presentation of the first and second
task (Stankov, 2003). Participants are instructed to attend to both tasks equally. Task
parameters such as speed of presentation and number of items in each task are manipulated in
order to increase difficulty. Performance on the competing task paradigm is then compared to
performance on the single tasks.
The mechanisms underlying performance on such tasks will be discussed in the next
section.
2.1.1 Mechanisms underlying performance on competing tasks.
2.1.1.1 Capacity models of attention.
A significant amount of research has been devoted to the underlying mechanisms of
competing task performance and numerous theories have emerged to explain this type of
performance. Some theorists argue that two tasks can only be performed simultaneously by
rapidly switching attention between them, while others argue that these tasks can be
performed by dividing attention (see Fogarty & Stankov, 1982). Capacity models of attention
discuss competing tasks in relation to the distribution of available limited resources. Theorists
differ in terms of their focus in relation to the implications of a limited capacity system.
Kahneman (1973) and later Hockey (1997), building on Kahmeman’s model, discussed the
functional implications of limited capacity such as the way task demands are managed in
goals, motivation, strategies and allocation of mental effort determine whether they will use
adaptive or maladaptive strategies in the face of competing demands. For example, when
faced with a need to perform two tasks simultaneously, individuals can intensify their mental
effort; however the trade-off becomes increased anxiety and fatigue. Alternatively, they may
lower their goals or adopt less effortful strategies, but at the cost of impaired performance.
These theories also propose that the way tasks are processed, whether they can be
processed in parallel, or whether one task assists or interferes with the other depends on
features of the tasks such as task similarity, temporal overlap or length of time between task
presentation and perceptual overlap (Ellenbogen & Meiran, 2011; Miller, Ulrich, & Rolke,
2009).
Bottleneck theories are also limited capacity models but they focus on the structural
implications of limited attentional resources. Bottleneck theorists propose that processing
resources are scarce and can only deal with one task at a time, therefore information must be
processed serially, rather than in parallel (Ruthruff, Van Selst, Johnston, & Remington,
2006). In their study using a competing task paradigm, Ruthruff et al.found that most
participants responded to tasks in a serial manner. However, interestingly, four participants
demonstrated the ability to bypass the bottleneck and respond to both tasks simultaneously.
The assumptions of capacity models of attention have been refuted by Stankov
(1989), who provided examples in the competing tasks literature of findings that did not
support them. This included research showing that performance on competing tasks can
improve with practice, thus questioning the concept of a bottleneck and limited processing
resources (Stankov).
While the theoretical mechanism underlying competing tasks may not be clear, it is
apparent from any theoretical standpoint that task characteristics are important determinants
instance, performance is likely to be better if one or both tasks can be processed quickly and
autonomously, the delay between tasks or the modality of presentation allows for rapid
attention switching, or if tasks do not compete for the same processing structures (Ellenbogen
& Meiran, 2011; Fogarty & Stankov, 1982; Stankov, 1988). Tasks that place a higher burden
on working memory may also be more likely to cause interference in multi-task processing
than those that do not (Ketelsen & Welsh, 2010). This is unsurprising given that working
memory has been shown to be strongly related to g (Kyllonen & Christal, 1990). This
proposition will be further explored in the sections that follow. Strategy use can also be
affected by task instructions, meaning that whether a person attends equally to each task or
devotes most resources to one task at the expense of the other, or prioritises performing tasks
quickly rather than accurately, for instance, may depend on what they are asked to do
(Janssen & Brumby, 2010).
2.1.1.2 Individual differences.
There is also evidence of individual differences in the ability to use processing
resources to undertake competing tasks. It has been argued that people differ in the amount of
processing resources they possess, and that these differences in processing resources may
account for individual differences in intelligence (Ben-Shakhar & Sheffer, 2001). That is,
people with more overall processing resources may be more capable of performing
competing tasks, as they have more resources to dedicate to the processing of each task
(Stankov, 2003). Further, some individuals may utilise available resources more efficiently
and therefore perform better than others, and some will find certain combinations of tasks
easier than others (Fogarty & Stankov, 1982; Watson & Strayer, 2010).
2.1.1.3 Timesharing.
It has been hypothesised that a ‘time-sharing’ factor may explain individual
1981 as cited in Fogarty & Stankov, 1982). Time-sharing is a hypothetical factor for which
there is currently no conclusive proof. For this reason it is difficult to define. It has been
referred to as a factor associated exclusively with performance on competing tasks, which is
not apparent when the same tasks are undertaken independently and which is not an artifact
of task instructions or presentation (Fogarty, 1987).
Fogarty and Stankov (1982) found some tentative support for a time-sharing factor in
a study where they compared performance on individual psychometric tests with performance
on a subset of these tests presented in a competing task format. Following the competing task
presentation participants were asked to respond to one task initially (which was cued after its
presentation to avoid participants focusing on what they considered to be the easier task), and
to only provide the answer for the second task if they were sure of their response to the first.
Performance on single tasks and the cued task in the competing task paradigm (primary
scores) were highly correlated, indicating that they were measuring the same underlying
construct, but another factor emerged that was unique to the secondary scores in the
competing task paradigm. It appeared to represent a ‘time-sharing’ factor present only in
situations where attention was divided between tasks. They cautioned, however, that this
factor could also represent something to do with instructions or strategy use.
Evidence for a time-sharing factor was also found by Salthouse and Miles (2002).
They explored individual differences in the ability to perform two tasks simultaneously
across age groups. In their study participants performed three demanding ‘primary’ tasks
independently and then each in combination with a visual tracking task. The primary tasks
were: (a) keeping track of directions which involved verbal instructions as to current
direction then a number of shifts after which the participant was to indicate the final
direction; (b) competing number series which involved auditory presentation of a series of
series; and (c) word pairs during which participants were presented with a set of word pairs
and were asked to recall the second member of the pair when presented with the first. The
competing task component was kept to a single task in an effort to maximise the opportunity
to reveal a time-sharing factor by removing variability caused by having a range of measures.
The visual tracking task involved manipulating a trackball in an attempt to keep a cursor on a
randomly moving target. Participants were instructed to focus on performing the primary task
but also to perform the visual tracking task to the best of their ability given that constraint.
They found that measures of performance decrement in the competing task paradigms were
correlated strongly with each other but relatively weakly with other cognitive measures. They
concluded that the performance decrement represented a distinct time-sharing ability.
Expanding on the work of Fogarty and Stankov (1982), Fogarty (1987) investigated
the existence of this factor using a similar methodology and a large selection of task
combinations covering a range of broad abilities from different levels of the CHC Theory of
Cognitive Abilities. A factor was extracted that encompassed a reasonable number of
competing task measures, but almost half the competing task measures did not load onto this
factor, indicating that the factor did not capture something unique to the competing task
paradigm (Fogarty). Support for a time-sharing factor was therefore equivocal in this study.
Research on time-sharing has been hampered by a number of issues, including the vague and
somewhat contradictory use of this term in the literature. For instance, time-sharing has been
assumed to exist in the context of competing tasks (and used interchangeably with terms such
as multi-tasking and dual-task performance) rather than being empirically tested (e.g.,
Anderson, Taatgen, & Byrne, 2005; Watson & Strayer, 2010), or it has been defined as the
ability to switch attention (rather than divide attention as per Stankov and Fogarty’s work)
between tasks (Brown, 1998), or defined broadly as a set of skills unique to the competing
processing (Wickens, 1992). Studies have been criticised for using inappropriate
methodologies such as exploratory factor analysis which may be inadequate to detect a
time-sharing factor (Fogarty, 1987). In addition to methodological and theoretical issues, there are
other difficulties that make it a hard factor to extract and measure, including individual
differences in ways people approach the same competing tasks (Fogarty).
Individual differences in performance on competing tasks are therefore an important
area of research. This will be explored within the context of the CHC Theory of Cognitive
Abilities, a prominent theory which provides the theoretical framework for this dissertation.
The following sections will introduce the CHC Theory and explain its relevance to competing
tasks.
2.2. The CHC Theory of Cognitive Abilities
In the second half of the 20th Century, a theory of intelligence emerged that has been
given a prominent position amongst intelligence theories. This is the Cattell-Horn-Carroll
(CHC) theory of cognitive abilities (McGrew, 2004), which is an amalgamation of Cattell
and Horn’s Gf-Gc theory (Horn & Noll, 1997) and Carroll’s three-stratum theory (Carroll,
1997). The CHC Theory has been described as the “consensus psychometric-based model for
understanding the structure of human intelligence” (McGrew, 2009, p.1). It is the theoretical
basis for most of the most widely used psychometric tests of intelligence (McGrew, 2009).
Extensive factor analysis by Cattell and Horn revealed the existence of ten broad
abilities in the intelligence literature (Horn & Noll, 1997), including fluid and crystallized
intelligence (Gf and Gc, respectively). Other factors uncovered include a broad visualisation
function (Gv), broad auditory function (Ga), short-term acquisition and retrieval (memory)
(SAR), tertiary or long-term storage and retrieval (TSR), broad speediness function (Gs),
correct decision speed (CDS) and in the extended model, quantitative (mathematical)
Noll, 1997). These factors formed the basis of the Gf-Gc theory. When it was developed, the
Gf-Gc theory was described as being the most empirically grounded available theory of
intelligence (Carroll, 1993).
Carroll (1997) also employed factor analysis in order to analyse data sets from
intelligence research, and found that the range of human abilities fit neatly into three levels,
or strata. The first stratum comprises specific abilities that people possess, such as reasoning
and comprehension, while the second stratum contains eight broad structures, similar to those
found in the Gf-Gc theory, that describe the first stratum abilities. Stratum three simply
contains a general factor of intelligence.
Due to their similarities, as well as the amount of research that supported the
conclusions made by Horn and Cattell (Horn & Noll, 1997; McGrew, 2004), and Carroll
(1997), these theories were combined to create a single comprehensive theory of human
cognitive abilities, called the CHC Theory of Cognitive Abilities (McGrew, 2004). The CHC
theory is a hierarchical framework consisting of three strata: general intelligence or g
(stratum III), broad cognitive abilities (stratum II) and narrow cognitive abilities (stratum I).
The CHC broad abilities are similar to those factors in the Gf-Gc theory, with the
following alterations: SAR has been replaced with the term Gsm (short-term memory), TSR
has been replaced with the term Glr (long-term memory) and the speediness (correct decision
speed) factor has been broken into two factors, Gs which refers to cognitive processing speed,
and Gt which is decision and reaction speed (McGrew, 2009). Thus, the CHC theory of
cognitive abilities consists of Gc, Gf, Ga, Gv, Gsm, Glr, Gs, Gt, Gq and Grw (McGrew,
2004). The model also includes six “tentatively identified broad ability domains” (McGrew,
2009). These were added following a comprehensive review of the factor analytic research on
intelligence between 1993-2003 (McGrew, 2005), the results of which suggested that all
domains are general domain specific knowledge (Gkn), tactile abilities (Gh), kinesthetic
abilities (Gk), olfactory abilities (Go), psychomotor abilities (Gp) and psychomotor speed
(Gps) (McGrew, 2009).
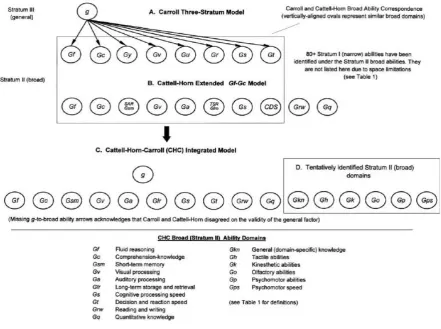
Figure 1.1 outlines the structure of the three theories, lists their components, and
[image:36.595.77.519.221.550.2]demonstrates how they relate to each other.
Figure 1.1. Schematic representation and comparisons of Carroll's Three-Stratum, Cattell–
Horn's Extended Gf–Gc, and the integrated Cattell–Horn–Carroll models of human cognitive
abilities.
2.2.1 Definitions of broad abilities.
All three theories (The CHC Theory, Cattell and Horn’s Gf-Gc theory and Carroll’s
three-stratum theory) include Gf and Gc as key components of intelligence. Gc, or
comprehension-knowledge in the CHC model (referred to as crystallized intelligence in
Carroll’s theory), refers to knowledge that is gained through formal education (Horn & Noll,
1997; Stankov, 1988). Individual differences in Gc reflect differences in its acquisition and
storage. Gc is thus measured by tests that call upon learned information from long-term
memory (Stankov, 1988).
Gf (named fluid reasoning in the CHC model and fluid intelligence in Carroll’s
theory) is an outcome of personal experience and incidental learning that is unaffected by
education (Stankov, 1988), and is tested with tasks that involve working memory, attention,
reasoning and deduction (Stankov, 2003). As described by Horn and Noll (1997), Gf refers
to abilities that are measured in tasks requiring inductive, deductive, conjunctive, and
disjunctive reasoning to arrive at understanding relations among stimuli, comprehend
implications, and draw inferences (p. 69).
A third component of intelligence that is important in the current dissertation in
relation to its role in competing tasks performance is Gsm. This component is simply the
ability to apprehend and maintain awareness of a limited number of events that have occurred
very recently (McGrew, 2009). It is limited in capacity and loses information quickly unless
other cognitive resources are employed to maintain the information in immediate awareness
(McGrew, 2009). Gsm is measured through tests of immediate memory span (Stankov,
1988). Gsm is the ‘passive’ component of working memory (WM) (Stankov, 1988). WM is
composed of a temporary memory store (Gsm) which includes a mechanism for the cognitive
rehearsal of information, and an executive mechanism which manages attention and active
presence of interference (Engle, 2002; Engle, Tuholski, Laughlin, & Conway, 1999; Kane &
Engle, 2002; Stankov, 1999). Refer to Table 1.1 for brief definitions of the other key broad
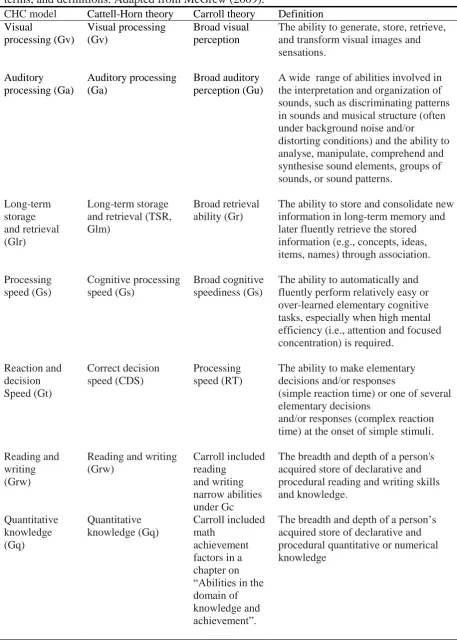
Table 1.1
CHC broad ability domain terms, corresponding Cattell–Horn and Carroll broad ability terms, and definitions. Adapted from McGrew (2009).
CHC model Cattell-Horn theory Carroll theory Definition
Visual processing (Gv) Visual processing (Gv) Broad visual perception
The ability to generate, store, retrieve, and transform visual images and sensations. Auditory processing (Ga) Auditory processing (Ga) Broad auditory perception (Gu)
A wide range of abilities involved in the interpretation and organization of sounds, such as discriminating patterns in sounds and musical structure (often under background noise and/or
distorting conditions) and the ability to analyse, manipulate, comprehend and synthesise sound elements, groups of sounds, or sound patterns.
Long-term storage and retrieval (Glr)
Long-term storage and retrieval (TSR, Glm)
Broad retrieval ability (Gr)
The ability to store and consolidate new information in long-term memory and later fluently retrieve the stored information (e.g., concepts, ideas, items, names) through association.
Processing speed (Gs) Cognitive processing speed (Gs) Broad cognitive speediness (Gs)
The ability to automatically and fluently perform relatively easy or over-learned elementary cognitive tasks, especially when high mental efficiency (i.e., attention and focused concentration) is required.
Reaction and decision Speed (Gt) Correct decision speed (CDS) Processing speed (RT)
The ability to make elementary decisions and/or responses
(simple reaction time) or one of several elementary decisions
and/or responses (complex reaction time) at the onset of simple stimuli.
Reading and writing (Grw)
Reading and writing (Grw) Carroll included reading and writing narrow abilities under Gc
The breadth and depth of a person's acquired store of declarative and procedural reading and writing skills and knowledge. Quantitative knowledge (Gq) Quantitative knowledge (Gq) Carroll included math achievement factors in a chapter on “Abilities in the domain of knowledge and achievement”.
2.2.2 Working memory and the CHC Theory.
WM has received significant attention in the intelligence literature due to its
relationship with processing concepts such as sustained attention, memory span, and
processing speed (McGrew, 2004). The WM system must hold a substantial amount of
information, often to be manipulated, which is necessary for solving complex problems
(McGrew, 2004). Therefore is it strongly associated with Gf. Neuropsychological and
intelligence research studies have reported correlations of 0.6 to 0.8 between WM and Gf
(Conway, Cowan, Bunting, Therriault, & Minkoff, 2002; Engle, et al., 1999; Kane,
Hambrick, & Conway, 2005; Kyllonen & Christal, 1990). The importance of WM is also
demonstrated by its strong relationship with overall intelligence. In a series of three studies,
Colom, Rebollo, Palacios, Juan-Espinosa, and Kyllonen (2004) found an average correlation
of .96 between WM and g for 594 participants (psychology undergraduates and Air Force
recruits).
There has been some debate about whether working memory (WM) should be
included as a component of the CHC theory (McGrew, 2004). However, research has shown
that while it is an important cognitive construct, WM is not comparable to the other narrow
trait-like CHC components. It does not depend on factor analysis for its identification and it
was not developed as an individual differences factor but a construct to explain experimental
findings from memory studies (McGrew, 2004; 2009). McGrew (2009) discusses its
importance in understanding new learning and performance of complex cognitive tasks.
2.2.3 Mental speed- the key to understanding intelligence?
Mental speed or the speed at which one can perform basic mental operations as an
indicator of intelligence has been prominent in the study of human cognitive abilities
(Nettelbeck, 1994; Nyborg, 2003; Stankov & Roberts, 1997). Indeed, some researchers have
suggested that mental speed may be the key process underlying intelligence (e.g. Kail, 1991).
The claim arises from the information processing model of human intelligence, whereby
cognition is constrained by limited processing resources, particularly in working memory,
and that the speed with which information is processed is critical because it determines how
quickly and efficiently resources can be allocated to cognitive tasks (Kail, 1991). Further,
processing speed has been found to account for a large proportion of age-related decline in
ability to perform complex mental operations (Hambrick, Oswald, Darowski, Rench & Brou,
2010).
Correlational findings amongst speed measures, Gf and Gc, do support this assertion
about the importance of processing speed, however. Correlations between the speed
component of the CHC theory of cognitive abilities (i.e., Gs), and Gc, have been found to be
non-significant (Roberts, Beh, Spilsbury, & Stankov, 1991; Stankov & Roberts, 1997). If
correlations between mental speed and Gc were non-significant, one would then expect speed
to correlate with Gf measures. Stankov (2003) reports that this is not the case. Further, the
authors found that mental speed alone, or indeed any other cognitive process (Hunt, 1980),
could not explain correlations between cognitive tasks and intelligence (Stankov & Roberts,
1997). Correlations between components of cognitive ability, such as mental speed, and
intelligence appear to reach a barrier of approximately 0.30, above which a single component
cannot explain any more of the variance in intelligence (Stankov & Roberts, 1997). Lastly,
both theories of intelligence which have been combined to produce the CHC theory of
Processing speed is considered amongst these other abilities in both theories, rather than
being singled out as the main process.
The relationship between intelligence as described above and the competing tasks
paradigm will now be outlined in some detail. This outline will then lead into a discussion
about how competing tasks can be useful in predicting job performance.
2.3. Competing Tasks and Intelligence
2.3.1 CHC theory and competing task performance.
One of the aims of previous research has been to examine in more detail the
relationship between competing task performance and the various components of
intelligence.
A number of studies have examined the relationship between competing tasks and
various components of intelligence. Gf, processing speed and WM have received the most
research attention, with the strongest associations being found between Gf, WM and
competing task performance. The role of processing speed remains unclear, though worthy of
discussion because of the attention this concept has received in both intelligence and
competing tasks research.
2.3.2 Competing tasks, Gf and WM.
Research indicates that the Gf component of the CHC model plays the greatest role in
predicting performance on competing tasks (e.g., König, Bühner, & Mürling, 2005; Stankov,
1988). WM has also been found to play an important role in competing task performance,
largely resulting from its relationship with Gf.
König, et al., and Mürling (2005) investigated WM and Gf using the competing task
paradigm. These authors found that WM, attention and Gf emerged as the most important
predictors of performance on the competing task measure, with WM resulting in the highest
the competing task measure and explained incremental variance in the hierarchical regression
analysis that could not be explained by Gf. They surmised that because of the complexity of
the competing task paradigm it was the higher level cognitive processes, specifically
executive control of attention that accounted for most of the individual differences in
performance. They concluded that WM tasks may be important in job selection for roles
requiring a high amount of multi-tasking.
In a number of studies the higher level ‘central executive’ function (as opposed to the
passive component) of WM has been tested by introducing interference into tasks; thereby
assessing the ability of participants to maintain goals in the presence of this interference
(Engle, 2002; Newman, Keller, & Just, 2007). Competing tasks are one such paradigm.
Neuropsychological research has found an interesting set of relationships amongst WM, Gf
and competing task performance. Specifically, studies have found that tasks testing WM and
Gf result in similar activation of the prefrontal cortex (PFC), particularly the dorsolateral PFC
(dPFC) (Kane & Engle, 2002, 2003), which is thought to perform as a central executive
mechanism, allowing for the coordination and management of goals and task-relevant
information in the presence of interference (Dempster & Corkill, 1999; Engle, 2002; Kane &
Engle, 2002, 2003). Interestingly, performance on competing tasks has also been found to
result in activation of the PFC, although the pattern of activation has been found to differ
across studies (Adcock, Constable, Gore, & Goldman-Rakic, 2000; Bunge, Klingberg,
Jacobsen, & Gabrieli, 2000; Collette et al., 2005; D'Esposito et al., 1995; Just et al., 2001;
Klingberg, 1998; Newman, et al., 2007; Szameitat, Schubert, Müller, & von Cramen, 2002).
A number of studies using functional magnetic resonance imaging (fMRI) have demonstrated
that the brain adapts to competing task performance (where the tasks are of sufficient
complexity to be unable to be processed automatically) by employing additional resources
were presented individually and were thus unique to the competing task paradigm (Buchweitz
et al., in press; Jaeggi et al., 2003; Kondo, Osaka, & Osaka, 2004)
The correlation between Gf and WM is not always supported by findings from
intelligence research. Stankov and Myors (1990) found that WM load was more strongly
associated with short-term memory (or SAR, renamed Gsm in later models) and Gc than Gf.
Increases in WM load were not found to lead to increased correlations with intelligence, in
fact the more complex the task and the higher demands on working memory, the lower the
correlation with IQ.
Conflicting research findings may be due to variations in the definition of WM used
in individual differences versus neuropsychology research, as well as to differences in the
focus of the research, the intelligence tests used, the nature of the competing tasks, and the
way performance is measured. Stankov and Myors (1990), for instance, did not use the
competing task paradigm in their study and their intelligence measure (WAIS-R) was not
developed with the CHC theory as the key underlying theoretical model. The WAIS-R has
also been claimed to be primarily a measure of Gc and not Gf (Kane & Engle, 2002). While
both branches of psychology define WM in terms of two components – the passive short-term
store and the active executive control mechanism – the focus of the neuropsychological
research has been on the processes associated with the active component. Meanwhile, much
of the individual differences research has focused on WM as a limited capacity system,
related to theories of attention (Oberauer & Göthe, 2006).
There is reason to believe that there may be a relationship between WM and
competing task performance but that further research is required, particularly tasks that
2.3.2.1 Competing tasks and processing speed.
Processing speed measures have been commonly used in studies of competing tasks,
likely because of their relationship with WM and because they have received much research
attention in explaining individual differences in intelligence. The theory is that individuals
who can process information quickly possess a more efficient processing system and are
therefore better able to deal with increases in complexity and/or demands on WM, as is the
case with competing tasks measures. This suggests that when there is a large information
flow, as is the case with competing tasks, faster speed of processing is likely to be beneficial.
However, in a review of the literature, Stankov and Roberts (1997) reject the notion of
mental speed as the process that can explain competing task performance. Mental speed on its
own has been unable to explain correlations of competing tasks with intelligence (Roberts, et
al., 1991), and is often studied in conjunction with other confounding factors such as
complexity. Mental speed itself is often hard to isolate from other types of speed, such as
decision speed or reaction time (Stankov & Roberts, 1997).
While research suggests a positive relationship between Gf and performance on
competing tasks, it is important to consider why such a link might exist, and whether, if this
is the case, a competing tasks measure has any advantage over traditional Gf measures. The
following sections explain the relationship between competing tasks and Gf in terms of the
underlying cognitive processes, thereby demonstrating the importance of competing task
measures over traditional ability measures in terms of their complexity and utilization of a
range of cognitive abilities including processing resources and attention, skills which are
2.3.3 Cognitive mechanisms underlying competing tasks.
2.3.3.1 Complexity.
It may be that added complexity of competing tasks compared with single tasks
explains the higher correlation of competing tasks with intelligence, particularly fluid
intelligence.
It is important to distinguish between complexity and difficulty, terms which are often
used interchangeably in the competing task literature but which refer to distinctly different
concepts (Spilsbury, Stankov, & Roberts, 1990). According to Stankov (2003), difficulty is
conceptualised as the percentage of people who can accurately answer an item, while
complexity involves any manipulation that increases the WM load and correlation of the task
with measures of intelligence.
To illustrate what is meant by complexity manipulation, the Swaps test is a
psychometric test where participants are presented with three letters and are instructed to
mentally swap two of the letters around (Stankov, 2000, 2003). This task can be used as a
measure of complexity by adding up to three more swaps that the participant must mentally
perform before answering. This test is thought to be a good measure of fluid intelligence
(Stankov, 2003), as Stankov (2000) found a uniform increase between Gf and the complexity
of the task.
Studies with the Swaps test have found that performance decreases as the number of
swaps increases (see Stankov, 2003). However, correlations with measures of fluid
intelligence have been found to increase as more swaps are added to the task. Furthermore,
studies with this test have revealed a fanning-out effect in the data, such that, as the number
of swaps increased, the difference between individuals with high- and low-Gf also increased
Further evidence to support the relationship between complexity and intelligence
comes from information processing research. This domain differs from other competing task
research in that it considers complexity in terms of ‘bits’ of information (Roberts, et al.,
1991). There appears to be a linear relationship between intelligence and the number of bits
of information that are able to be processed (Roberts, et al., 1991). Importantly, Roberts et al.
found that adding another task so that two tasks were presented in a competing manner adds
one extra bit of complexity. This finding was supported by Spilsbury et al. (1990), who also
found that competing tasks were manipulations of complexity, while other tasks often used in
the literature to test intelligence appear to be more related to difficulty (e.g., making the text
smaller on a perceptual task makes it more difficult, but not more complex) (Spilsbury et al.,
1990). To help differentiate, there appears to be a quantitative change in a task when
difficulty is increased, and a qualitative change when complexity is manipulated
(Ben-Shakhar & Sheffer, 2001; Roberts, et al., 1991).
Research by Roberts et al. (1988) found that competing tasks resulted in higher
correlations with Gf than the two components of the competing task presented separately.
Furthermore, correlations between Gf and competing tasks increased as extra bits of
information were added. Roberts et al. (1991) replicated these findings, as increasing
complexity related to an increase in correlations of the task with Gf measures. However,
correlations of performance with Gc while showing a positive trend, were mostly
non-significant, and when Gf was partialled out all approached zero. SAR (short-term acquisition
and retrieval, renamed Gsm in later models) was not strongly correlated with performance
and correlations reduced under the competing task paradigm compared with the single task
presentation (Roberts et al., 1991).
It would appear, therefore, that complexity manipulations have the strongest impact
increasing the number of components involved) increases the correlation with Gf. It has been
suggested that WM may play a mediating role in the relationship between complexity and Gf.
Spilsbury et al. (1990) suggest that increasing the complexity of a task increases its WM load,
which then strengthens the relationship with Gf. Evidence to support this relationship has
been found in the intelligence literature. For example, Carpenter, Just and Shell (1990) found
that commonly used tests of Gf, the Raven’s Standard Progressive Matrices and the Tower of
Hanoi, measure abilities which are thought to be associated with WM load, such as executive
control of attention and the generation and maintenance of goals, particularly as the tests
progress and becomes more complex. Their analysis of those individuals who were able to
perform both tasks well, compared to those who performed poorly, lead the authors to
conclude that successful completion of the more complex items requires employing these
higher level processes (executive control and goal maintenance), which then results in better
performance on tasks of Gf (Carpenter et al., 1990).
2.3.3.2 Pools of resources.
Another theory that has been put forward to explain performance in competing tasks
is the multiple pools of resources theory (see Kramer, Wickens, & Donchin, 1985). This
theory comes from the finding that competing tasks do not all interfere with each other to
cause performance decrements (Stankov, 1983), and that some task combinations actually
enhance performance. This pools of resources theory posited that there were many different
clusters of resources which can be utilised when processing multiple tasks at the same time.
Evidence for the existence of multiple pools of resources comes from multimedia
research, in which audio visually presented information was found to result in greater
knowledge acquisition than information presented in either an auditory or visual manner
(Mayer & Moreno, 1998; Moreno & Mayer, 1999). This is explained in the literature in terms
processing systems for visual and auditory information that can be used concurrently to
process information (Brünken, Steinbacher, Plass, & Leutner, 2002; Mayer & Moreno, 1998).
This was further supported by the finding of decreases in performance when information is
presented in a visual-visual manner (Brünken, et al., 2002; Mousavi, Low, & Sweller, 1995).
Research relating to competing tasks and intelligence has also reported an effect of
task modality. Fogarty and Stankov (1988), for example, found that audiovisual competing
tasks loaded higher on intelligence than did auditory-only competing tasks. Structural
interference is likely to have introduced an additional difficulty element in the
auditory-auditory split. These results have important ramifications for the optimal design of competing
tasks tests as measures of intelligence.