Teacher Moderation Systems
Martin Taylor
August 2005
TEACHER MODERATION SYSTEMS
Summary
There are two parts to this study. The first part is concerned with internally-assessed coursework. In most current GCE, VCE, GCSE and GNVQ examinations, each centre’s standard of marking of coursework is monitored by inspecting a sample of candidates’ work. Where a centre’s marking is found to be at odds with the national standard, adjustments can normally be made to the marks based on the evidence from the sample. This procedure is known as moderation by inspection. A possible alternative method of monitoring and, where necessary, adjusting centres’ marking is to compare the marks of the internally-assessed component with those of one or more externally-assessed components. This procedure is known as statistical moderation, and the study investigated how it might affect candidates’ marks and grades in a number of GCE and GCSE examinations.
It was found that different methods of statistical moderation had surprisingly similar effects. In all of them there was considerable variation, across centres and candidates, in the differences between the actual marks for the internally-assessed component in the operational examination and the marks generated by statistical moderation. By including an appropriate term (called the ‘allowed difference’) in the statistical moderation formula, it was possible to ensure that the mean of these differences (across all candidates) was approximately zero,
with the consequence that there was little effect on the number of candidates at each grade at subject level, but many candidates would have obtained different grades (some higher and
some lower), particularly in specifications in which coursework accounts for a large proportion of the total assessment.
The second part of the study was concerned with teacher assessment. In recent years this term has come to mean the assessment by teachers of the general work of candidates in part or all of their course of study, rather than the type of assessment associated with current coursework components, which usually involve a particular task or set of tasks. This more general form of teacher assessment was modelled by using centres’ estimated grades, which are routinely provided for GCE units. The study investigated the effect on candidates’ overall (subject) grades of replacing one or more of the six unit marks awarded operationally by centres’ estimates. The effect of applying statistical moderation to the estimates was also considered.
TEACHER MODERATION SYSTEMS
1. INTRODUCTION
In most current GCE, VCE, GCSE and GNVQ specifications, coursework comprises one or more defined tasks (either set by the awarding body or based on criteria defined by the awarding body) and is marked by centres. Because the assessment is of an end-product, the work of a sample of candidates from each centre can be re-marked by a moderator, and adjustments to the centre’s marks of all candidates at that centre can be determined, where necessary, based on a comparison of the centre marks and moderator marks for the candidates in the sample. This is known as moderation by inspection.
Although major changes to coursework are not now expected, the Working Group on 14-19 Reform (2004) had favoured a move away from set-piece coursework tasks to a more open-ended style of teacher assessment, possibly based on the general work of candidates during the course. One of the consequences of such a move would have been to remove the possibility of moderation in the manner described above. Thoughts therefore turned to the use of statistical methods as part of the monitoring process, to check whether centres appear to be marking to the correct standard.
The present study has two parts. The first part investigates the use of one or more externally-assessed components to moderate an internally-assessed coursework component, using statistical methods. The second part uses centres’ estimated grades as a proxy for teacher assessment and investigates the effect on candidates’ overall results of replacing operational marks with these ‘teacher assessments’, either moderated or unmoderated.
2.
SCOPE OF THIS STUDY
Dhillon (2005), although evidence of how these estimates vary across units in one subject is presented in Appendix D.
3.
PART 1: STATISTICAL MODERATION
3.1 Methods
used
The following methods of statistical moderation were used in the modelling:
(i) adjustment of centre mean marks (ie where the internally-assessed
marks for the centre are adjusted to have the same mean as the moderating instrument marks for the centre);
(ii) linear scaling (ie where the internally-assessed marks for the centre
are adjusted to have the same mean and standard deviation as the moderating instrument marks for the centre);
(iii) linear regression within centre (ie where the regression line of
moderating instrument marks on internally-assessed marks for the centre is used to calculate adjusted internally-assessed marks – this should not be confused with the use of regression to adjust a centre’s internally-assessed marks in the context of moderation by inspection1);
(iv) mapping ranks (ie where each candidate’s moderated internally-assessed mark is set to the mark on the moderating instrument which is in the appropriate position in the rank order).
The moderating instrument, which may be a single (externally-assessed) component or the aggregation of two or more components, must be scaled to have the same maximum as the internally-assessed component.
Methods (i), (ii) and (iii) are all variations on a theme in the sense that method (i) takes account of centre means only, method (ii) also adjusts for spread and method (iii) takes account of the correlation between the internal assessment marks and the moderating instrument marks at the centre (so would be expected to produce moderated internally-assessed marks which are close to the moderating instrument mean if the correlation is low). Different versions of these methods were modelled, for example using a tolerance (whereby no adjustments are made if the differences between the original centre marks and the statistically moderated marks are within a pre-defined tolerance).
A further method was considered, involving the use of linear regression, across all centres, to calculate the marks for the internally-assessed component from the marks of the other components. This method is part of the screening process currently used for Speaking & Listening in GCSE English to identify centres for possible moderator visits. However, it ignores altogether the marks awarded for the component which needs to be
1 The use of regression to make adjustments in this context is merely automating a process which is carried out
moderated. Therefore, while it may be used as a screening device to identify centres for further investigation, it does not provide adjusted marks, and it was therefore excluded from the study.
3.2 Example
Table 3.2a Marks at a centre for an internally-assessed component and for the moderating instrument
cand
centre mark for int-ass component
(max 50) (c)
moderating instrument (max 150)
1 42 87
2 2 20
3 36 89
4 17 43
5 37 69
6 23 70
7 16 74
8 24 78
9 38 101
10 9 58
11 12 43
int-ass component
(max 50)
moderating instrument (max 150)
mean for centre 23.27 (
c
) 66.55standard deviation for centre 13.39 (
s
c) 23.80mean for all centres 29.69 (
μ
c) 71.56 correlation for centre 0.84 (r)In order to use the moderating instrument data, they must be converted to the same maximum as the internally-assessed data. Since the maximum for the centre-assessment and the moderating instrument are, respectively, 50 and 150, the moderating instrument data have to be multiplied by 50/
150, equivalent
to dividing by 3. Thus, summary statistics for the scaled moderating instrument marks w are as follows:
mean for centre = 66.55 ÷ 3 = 22.18 (
w
)In addition to the notation already defined, denote (for the internally-assessed component) moderated marks by y (centre marks are denoted by c).
No tolerance
First, methods (i), (ii) and (iii) are used with no tolerance applied.
Under method (i) y = c -
c
+w
,under method (ii) y = (c -
c
) xs
w/s
c +w
,and under method (iii) y = (c -
c
) x r xs
w/s
c +w
(equivalent to y =
s
cw/s
c2 x (c -c
) +w
) .The moderated marks generated in this case are shown in Table 3.2b.
Table 3.2b Statistically moderated marks under methods (i), (ii) and (iii)
with no tolerance applied
internally-assessed component mark moderated mark cand
centre mark
method (i) method (ii) method (iii)
1 42 41 33 32
2 2 1 10 12
3 36 35 30 29
4 17 16 18 19
5 37 36 30 29
6 23 22 22 22
7 16 15 18 19
8 24 23 23 23
9 38 37 31 30
10 9 8 14 15
11 12 11 16 17
With tolerance applied
Second, methods (i), (ii) and (iii) are used again, now applying the normal tolerance currently used operationally in the moderation of internally-assessed components (defined as 6% of the maximum component mark, rounded up, and equal to 3 in this example). The formulae for calculating the moderated marks are the same as in Table 3.2b. Then, for each centre, the tolerance is used in two ways:
(1) where the difference between
c
andw
is within tolerance, the moderated marks are set equal to the centre marks;The moderated marks generated in this case are shown in Table 3.2c. Note that, in all cases, the moderated marks revert to centre marks because the difference between
c
andw
is within tolerance.Table 3.2c Statistically moderated marks under methods (i), (ii) and (iii),
with tolerance applied
internally-assessed component mark moderated mark cand
centre mark
method (i) method (ii) method (iii)
1 42 42 42 42
2 2 2 2 2
3 36 36 36 36
4 17 17 17 17
5 37 37 37 37
6 23 23 23 23
7 16 16 16 16
8 24 24 24 24
9 38 38 38 38
10 9 9 9 9
11 12 12 12 12
With tolerance and ‘allowed difference’ applied
Third, methods (i), (ii) and (iii) are used again, now incorporating an ‘allowed difference’ between the centre means (
c
andw
) equal to the difference between the corresponding means for all centres (μ
candμ
w). For example, if the difference between the all-centre means is 10 marks, the expectation isthat the difference between the means for individual centres should be 10 marks, with the potential for adjustments to be made to the internally-assessed marks if not. A tolerance is again applied in two ways, as in Table 3.2c:
(1) where (
c
-w
) is within tolerance of (μ
c-μ
w), the moderated marks are set equal to the centre marks;(2) where all of the calculated moderated marks are within tolerance of the centre marks, these calculated marks are ignored and the moderated marks are set equal to the centre marks.
Table 3.2d Statistically moderated marks under methods (i), (ii) and (iii), with an ‘allowed difference’ between centre means and
tolerance applied
internally-assessed component mark moderated mark cand
centre mark
method (i) method (ii) method (iii)
1 42 47 39 37
2 2 7 15 17
3 36 41 36 34
4 17 22 24 25
5 37 42 36 35
6 23 28 28 28
7 16 21 24 24
8 24 29 28 28
9 38 43 37 35
10 9 14 20 21
11 12 17 21 22
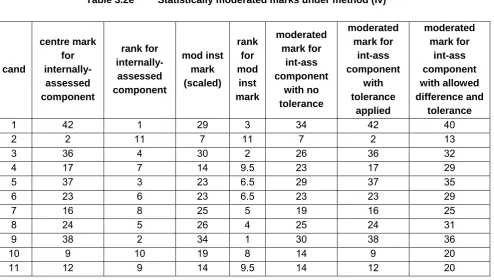
Method (iv) – mapping ranks
Finally, method (iv) is used. This method is quite different from methods (i), (ii) and (iii). In Table 3.2e each candidate’s moderated mark is set equal to the moderating instrument mark which has the same rank as the centre mark for that candidate. For example, candidate 3 is in position 4 in the rank order for centre marks, so his/her moderated mark is the mark which is in position 4 in the moderating instrument marks, ie 26. (The moderating instrument marks in Table 3.2e have been scaled from the corresponding marks in Table 3.2a by dividing by 3, as described earlier.) Tied ranks in the centre marks (not present in this example) are easy to deal with – for example, where ranks 6 and 7 are tied the candidates receive the mean of the moderating instrument marks in positions 6 and 7. It is less obvious how tied ranks in the moderating instrument marks should be treated. In Table 3.1.2e candidates 10 and 11, who are in positions 10 and 9 respectively in the centre marks, both receive the mark which is at the tied 9-10 position in the moderating instrument rank order. There are other, possibly better, ways of dealing with tied ranks in the moderating instrument marks, but it would be futile in this project to pay undue attention to this issue, which has no more than a marginal effect on the outcomes.
Table 3.2e shows the moderated marks generated using mapping ranks with the three approaches. Note that, when the tolerance is applied, the moderated marks revert to centre marks (as in Table 3.2c) and that the incorporation of an allowed difference increases the moderated marks by 6 (as in Table 3.2d).
Table 3.2e Statistically moderated marks under method (iv)
cand centre mark for internally-assessed component rank for internally-assessed component mod inst mark (scaled) rank for mod inst mark moderated mark for int-ass component with no tolerance moderated mark for int-ass component with tolerance applied moderated mark for int-ass component with allowed difference and tolerance
1 42 1 29 3 34 42 40
2 2 11 7 11 7 2 13
3 36 4 30 2 26 36 32
4 17 7 14 9.5 23 17 29
5 37 3 23 6.5 29 37 35
6 23 6 23 6.5 23 23 29
7 16 8 25 5 19 16 25
8 24 5 26 4 25 24 31
9 38 2 34 1 30 38 36
10 9 10 19 8 14 9 20
11 12 9 14 9.5 14 12 20
3.3
Specifications used in the analysis of statistical moderation
The AQA specifications included in this part of the study are listed below. Mark data from Summer 2004 were used. The approximate proportions of centres which, operationally, had their marks for the internally-assessed component adjusted in Summer 2004 are shown in brackets.
GCSE Business Studies Specification A (17%)
GCSE Design & Technology (Food) (12%)
GCSE History Specification A (17%)
GCSE History Specification B (16%)
GCSE Humanities (16%)
GCSE Music (two components – 42% and 27%)
GCSE Religious Studies Specification A (15%)
GCE Geography Specification B (4%)
GCE Psychology Specification A (27%)
In the case of GCE Biology, only the AS units were included in the study.
Each of the GCE Geography specifications has a coursework component but in Specification A the coursework is externally-assessed (therefore there is no figure for the proportion of centres adjusted). Although the coursework marks should not therefore need to be moderated, this specification was included in the study in order to compare the effects of statistical moderation of the coursework component in the two specifications.
4.
PART 2: TEACHER ASSESSMENT
4.1 Background
In GCE, centres currently provide estimated grades (A-E or U) for every unit. These estimates, though on a rather coarse scale, can be used as a proxy for teacher assessment, thus giving the opportunity to model the effects of replacing operational marks by teacher assessments.
In the modelling, candidates’ uniform marks for selected units were replaced by the centres’ estimated grades (‘teacher assessments’). These estimated grades were converted to a numerical scale proportional to the uniform mark scale, with a nominal maximum of 5 (see Table 4.1a). Note that the numerical values are placed at approximately the mid-point of the grade range (except for U, which is placed at zero). For example, grade B is converted to 3.75, which as a percentage of the nominal maximum (5) is 75%.
Table 4.1a Conversion of estimated grades to a numerical scale
grade uniform mark range (as percentage of the maximum uniform mark)
numerical equivalent for
grade
A 80-100 4.5
B 70-79 3.75
C 60-69 3.25
D 50-59 2.75
E 40-49 2.25
U 0-39 0
(adjustment of the teacher assessments to have the same centre mean as the moderating instrument – see section 3.1).
The use of teacher assessments for various numbers of units was trialled. Where the uniform marks for just one unit were replaced by teacher assessments, there was likely to be a relatively small effect on candidates’ overall grades, but the scale for the teacher assessments was very coarse (with only six points, corresponding to U, E, …, A). Where (at the other extreme) the uniform marks for five units were replaced by teacher assessments, the effects on candidates’ overall grades were likely to be greater, but in this case there was a twenty-six point scale for the aggregated teacher assessments (with a nominal maximum of 25).
Two procedures for carrying out statistical moderation were trialled:
(i) the teacher assessments for the other component(s) were compared with the actual uniform marks for the moderating instrument;
(ii) the teacher assessments for the moderating instrument were compared with the actual uniform marks for the moderating instrument.
Although approach (ii) appears more logical, it could in practice lead to abuse. Because the teacher assessments for the moderating instrument would not directly affect candidates’ results (they would be used only for determining adjustments), centres could manipulate the system by giving unduly low assessments for this element, causing upward adjustments to be made to the teacher assessments for the other component(s) (ie the components for which the teacher assessments mattered). Approach (i) does not lend itself to abuse or manipulation but has the disadvantage that the teacher assessments and external assessments which are being compared are for different components. However, this is the procedure which was used in Part 1 of the study (see section 3.1).
For this part of the study, it is largely irrelevant whether a unit is internally-assessed or externally-internally-assessed.
4.2
Example
In this example, estimated grades are used as a proxy for teacher assessment for units 1, 2 and 4 (combined) in a six-unit GCE. The teacher assessments for these units are aggregated with the uniform marks for units 3. 5 and 6 to produce overall A level grades. This aggregation is carried out twice, for both the unmoderated and the moderated teacher assessments.
units 3, 5 and 6. Under approach (ii), estimated grades are also used as a proxy for teacher assessment for units 3, 5 and 6. The teacher assessments for units 1, 2 and 4 are statistically moderated by making an adjustment based on a comparison of the teacher assessment for units 3, 5 and 6 and the actual (total) uniform mark for these units.
Table 4.2a shows the initial details for one centre of five candidates. Further details of the outcomes of statistical moderation and aggregation follow in later tables.
Table 4.2a Teacher assessments at a centre (using estimated grades as a proxy) and uniform marks for the moderating instrument (units 3, 5 and 6 combined).
cand tch ass for units 1+2+4 (max 15)
tch ass for units 3+5+6 (max 15)
total um for units 3+5+6 (max 270)
1 10.25 10.75 141 2 10.25 10.75 157 3 12.00 12.00 122 4 9.25 9.75 161 5 11.00 10.75 180
mean for centre 10.55 10.80 152.20
In order to use the moderating instrument data, they must be converted to the same maximum as the teacher assessments. Since the maxima for the teacher assessment and the moderating instrument are, respectively, 15 and 270, the moderating instrument data have to be multiplied by 15/270
(equivalent to dividing by 18). Thus
scaled mod inst mean for centre = 152.20 ÷18 = 8.46.
In Table 4.2b statistical moderation is carried out by comparing the actual uniform marks for the moderating instrument (units 3+5+6) with the teacher assessments for the other components (units 1+2+4). The difference in means is
(8.46 – 10.55) = -2.09,
Table 4.2b Effect on subject grades of replacing the uniform marks for units 1+2+4 with teacher assessments (estimated grades), moderated by comparing the centre’s mean teacher assessment for units 1+2+4 with the centre’s mean external mark for units 3+5+6 (the moderating instrument)
overall A level grade cand unmoderated
tch ass for units 1+2+4
moderated tch ass for
units 1+2+4 with unmod tch ass with mod tch ass actual
1 10.25 8.16 C D C 2 10.25 8.16 C D C 3 12.00 9.91 C D D 4 9.25 7.16 C D D 5 11.00 8.91 B C C
In Table 4.2c statistical moderation is carried out by comparing, for the moderating instrument (units 3+5+6), the teacher assessments with the actual uniform marks. The difference in means is
(8.46 – 10.80) = -2.34,
so each candidate’s teacher assessment (for units 1+2+4) is reduced by 2.34. In the fourth and fifth columns the A level grade is generated by replacing the uniform marks for units 1+2+4 with the teacher assessments for these units (appropriately scaled).
Table 4.2c Effect on subject grades of replacing the uniform marks for units 1+2+4 with teacher assessments (estimated grades), moderated by comparing the centre’s mean teacher assessment for units 3+5+6 with the centre’s mean external mark for units 3+5+6 (the moderating instrument)
overall A level grade cand unmoderated
tch ass for units 1+2+4
moderated tch ass for
units 1+2+4 with unmod tch ass with mod tch ass actual
1 10.25 7.91 C D C 2 10.25 7.91 C D C 3 12.00 9.66 C D D 4 9.25 6.91 C D D 5 11.00 8.66 B C C
Biology Specification A
Business Studies
Communication Studies
Computing
English Literature Specification A
English Literature Specification B
French
Geography Specification A
Geography Specification B
ICT
Law
Psychology Specification A
As in Part 1 of the study, only the AS part of Biology was included.
5.
STATISTICAL MODERATION: RESULTS
A huge volume of data has been collected and analysed. It would be impracticable to present the findings exhaustively. Instead, a certain amount of detail is provided for one of the specifications included in the study (GCSE History Specification A) and the main patterns are identified for the other specifications.
There were two stages in the analysis. First, the statistically moderated marks were calculated for the centre-assessed component (as explained in sections 3.1 and 3.2) as well as the differences between those marks and the operational marks. Second, the subject grades obtained when using statistical moderation for the centre-assessed component were compared with the operational subject grades. Any differences between statistically moderated marks and operational marks would be of little consequence if there was negligible effect on candidates’ overall grades.
5.1
GCSE History A
This specification has two written components (each with 37½% weighting) and a centre-assessed coursework component (with 25% weighting). It is untiered. One of the written components has four options; only the option with the largest number of candidates was considered. For the purpose of the study, each candidate’s marks for the two written papers were added (using the appropriate scaling factors for the specification), and the aggregated marks for these components were used as the moderating instrument for the coursework component.
5.1.1 Differences between statistically moderated marks and operational marks
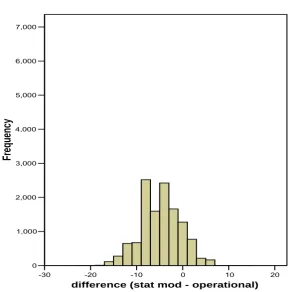
Table 5.1.1a shows summary statistics for the differences between statistically moderated marks and operational marks for the coursework component when method (i) (adjustment of centre mean marks) is used with no tolerance applied (see section 3.1). Please note that negative differences indicate that the statistically moderated marks were lower than the operational marks (ie the statistical moderation was more severe than the moderation by inspection which was used operationally).
Table 5.1.1a GCSE History Specification A: differences between statistically moderated marks and operational marks for the coursework component under method (i) with no tolerance applied
Number of candidates 12355 Maximum mark for coursework 50
Weighting (%) 25%
Mean difference -5.3
Mode -8
[image:16.595.98.389.469.762.2]Standard deviation 4.3
Figure 5.1.1a shows the differences diagrammatically. A scale of 0-7000 on the vertical axis is used in order to assist comparison with Figures 5.1.1b and 5.1.1c.
Figure 5.1.1a GCSE History Specification A: differences between statistically moderated marks and operational marks for the coursework component under method (i) with no tolerance applied
1,000 2,000 3,000 4,000 5,000 6,000 7,000
Frequ
The outcomes under methods (ii), (iii) and (iv) (linear scaling, linear regression within centre and mapping ranks, respectively) were similar. In line with a general pattern observed for most of the specifications considered, the spread of the differences was largest for method (iii) followed by (iv) and then (ii), with (i) the smallest. However, the means and modes were all about the same (see Table 5.1.1b).
Table 5.1.1b GCSE History Specification A: comparison of statistics for methods (i)-(iv) with no tolerance applied
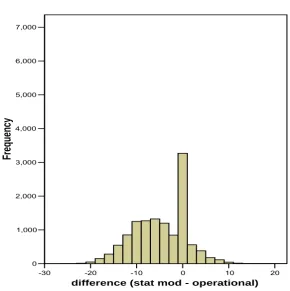
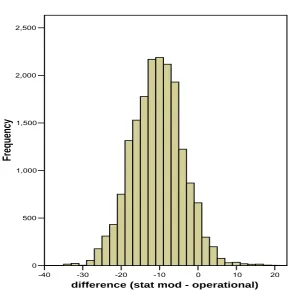
[image:17.595.98.389.473.765.2]A second approach was to apply the normal moderation tolerance (3 marks for the present coursework component) to the statistically moderated marks. Again, the details are explained in section 3.1. Although the means and standard deviations were similar to those in Table 5.1.1a, the modes transfer to zero because of the application of the tolerance. Figure 5.1.1b illustrates for method (iii). The other methods gave similar outcomes, although method (i) in particular had a lower frequency at the mode.
Figure 5.1.1b GCSE History Specification A: differences between statistically moderated marks and operational marks for the coursework component under method (iii) with tolerance applied
-30 -20 -10 0 10 20
difference (stat mod - operational) 0
1,000 2,000 3,000 4,000 5,000 6,000 7,000
Frequen
cy
Method (i) Method (ii) Method (iii) Method (iv)
No. of candidates 12355
Maximum mark for coursework 50
Weighting (%) 25%
Mean difference -5.3 -5.4 -5.4 -5.3
Mode -8 -8 -5 -7
Most of the 3000 or so candidates with a zero difference are those who would have received the mark awarded by the centre, both operationally and under statistical moderation.
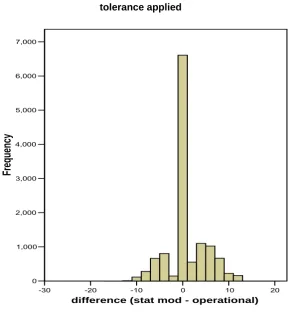
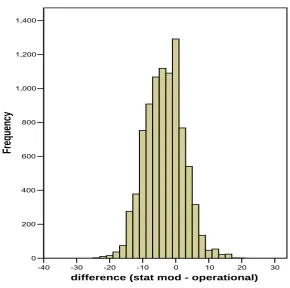
[image:18.595.98.393.264.583.2]When a so-called allowed difference is introduced, systematic variations between coursework mean marks and written paper mean marks are eliminated. The mean differences under all of methods (i)-(iv) are close to zero and the modes are zero. The standard deviations are a little smaller than before. Figure 5.1.1c shows the differences under method (i).
Figure 5.1.1c GCSE History Specification A: differences between statistically moderated marks and operational marks for the coursework component under method (i) with an ‘allowed difference’ and
tolerance applied
-30 -20 -10 0 10 20
difference (stat mod - operational) 0
1,000 2,000 3,000 4,000 5,000 6,000 7,000
Freq
uency
5.1.2 Effect on subject grades
Table 5.1.2a GCSE History Specification A: crosstabulation showing effect on subject grades of replacing operational marks for the
coursework component with statistically moderated marks (method (i), no tolerance or allowed difference)
(Table shows numbers of candidates)
Grade with statistical moderation for the coursework component
A* A B C D E F G U
Total
A* 357 233 0 0 0 0 0 0 0 590
A 8 1019 603 0 0 0 0 0 0 1630
B 0 16 1561 719 0 0 0 0 0 2296
C 0 0 19 1619 807 3 0 0 0 2448
D 0 0 0 29 1113 644 3 0 0 1789
E 0 0 0 0 24 1021 493 1 0 1539
F 0 0 0 0 0 19 686 332 0 1037
G 0 0 0 0 0 0 11 417 126 554
Actual grade
U 0 0 0 0 0 0 0 8 249 257
Total 365 1268 2183 2367 1944 1687 1193 758 375 121402
Figure 5.1.2a GCSE History Specification A: effect on subject grades of replacing operational marks for the coursework component with statistically moderated marks (method (i), no tolerance or
allowed difference)
* A B C D E F G U
grade 0
500 1,000 1,500 2,000 2,500
Fr
eq
ue
ncy
method actual stat mod
2 The shortfall compared with Table 5.1.1a is because of candidates who did not have valid marks for both
The pattern shown here is repeated in many of the specifications considered, with fewer candidates obtaining the higher grades and more candidates obtaining the lower grades under statistical moderation of the coursework component. This pattern is clearly to be expected, because the data in section 5.1.1 above showed that statistical moderation generally gives rise to lower marks for the coursework component than those obtained operationally.
The crosstabulation shows that, while many candidates would lose a grade, a few candidates would gain, and very few would change by more than one grade. This pattern was not the same across all of the specifications considered.
As illustrated in section 5.1.1 above, the statistically moderated marks are the same as the operational marks for many candidates when an ‘allowed difference’ is applied. Therefore, far fewer subject grade changes would be expected. However, the crosstabulation shows that more candidates would change grades than might be expected from inspecting the diagram (see Table 5.1.2b and Figure 5.1.2b).
Table 5.1.2b GCSE History Specification A: crosstabulation showing effect on subject grades of replacing operational marks for the
coursework component with statistically moderated marks (method (i), with tolerance and allowed difference applied)
(Table shows numbers of candidates)
Grade with statistical moderation for the coursework component
A* A B C D E F G U Total
A* 548 42 0 0 0 0 0 0 0 590
A 80 1450 100 0 0 0 0 0 0 1630
B 0 134 2018 144 0 0 0 0 0 2296
C 0 0 169 2126 153 0 0 0 0 2448
D 0 0 0 182 1489 118 0 0 0 1789
E 0 0 0 0 200 1250 89 0 0 1539
F 0 0 0 0 0 146 829 62 0 1037
G 0 0 0 0 0 0 91 443 20 554
Actual grade
U 0 0 0 0 0 0 0 46 211 257
Figure 5.1.2b GCSE History Specification A: effect on subject grades of replacing operational marks for the coursework component with statistically moderated marks (method (i), with tolerance and
allowed difference applied)
* A B C D E F G U
grade 0
500 1,000 1,500 2,000 2,500
Fr
eq
ue
ncy
method actual stat mod
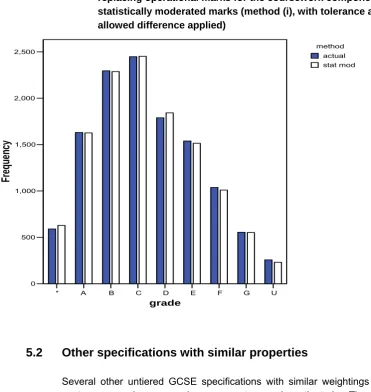
5.2
Other specifications with similar properties
Several other untiered GCSE specifications with similar weightings for the centre-assessed coursework component were investigated. These were History Specification B, Humanities and Religious Studies Specification A. As can be seen from Table 3.4, all had almost identical proportions of centres whose coursework marks were adjusted in 2004 (about 16%). The outcomes were similar to those for GCSE History A.3 For the record, summary statistics are shown in Appendix A.
5.3
Tiered GCSE specifications
Two tiered GCSE specifications were considered: Business Studies Specification A and Design & Technology (Food). Each of these has a tiered written paper and an untiered coursework component. In Business Studies the coursework accounts for 25% of the total weighting while in Design & Technology it accounts for 60%.
3 Where there is just one written component, this is used as the moderating instrument for statistical moderation.
The nature of the assessment pattern in tiered specifications was expected to inflate the coursework marks for Foundation tier candidates and deflate them for Higher tier candidates. The reason for the expectation for the Foundation tier is explained in the next paragraph, for the simplest method of statistical moderation involving adjustment of centre mean marks with no tolerance or allowed difference applied.
Suppose that the maximum mark for both the (Foundation tier) written paper and the (untiered) coursework component is 50. The mean mark for the written paper might be expected to be about 25 and the mean coursework mark for the same (Foundation tier) candidates about 15. The lower coursework mean would be expected because this component covers the whole grade range while the written paper covers only grades C-G. With these overall means, which would generally be reflected in centre mean marks, statistical moderation would cause the coursework marks to be increased by an average of 10.
In fact, the expectations were not realised. Further investigation revealed that, while for the Higher tier the mean written paper marks were indeed lower than the mean coursework marks, the same was also true for the Foundation tier. The outcomes from statistical moderation were therefore similar to those in the untiered specifications (where the written paper means were also lower than the coursework means), although for Higher tier candidates the downward adjustments were greater.
Tables 5.3a and 5.3b show summary statistics for Business Studies Foundation tier and Business Studies Higher tier when no tolerance or allowed difference is applied. Figures 5.3a and 5.3b show the outcomes diagrammatically for method (i).
Table 5.3a GCSE Business Studies Specification A Foundation tier: summary statistics for methods (i)-(iv) with no tolerance or
allowed difference applied
Method (i) Method (ii) Method (iii) Method (iv)
No. of candidates 8926
Maximum mark for coursework 63
Weighting (%) 25%
Tolerance 4 marks
Mean difference -3.9 -3.9 -3.9 -3.9
Mode -4 -2 -2 -2
Table 5.3b GCSE Business Studies Specification A Higher tier: summary statistics for methods (i)-(iv) with no tolerance or allowed
difference applied
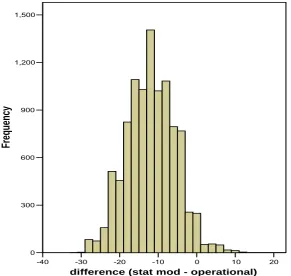
Figure 5.3a GCSE Business Studies Specification A Foundation tier: differences between statistically moderated marks and
operational marks for the coursework component under method (i) with no tolerance or allowed difference applied
-40 -30 -20 -10 0 10 20 30
difference (stat mod - operational) 0
200 400 600 800 1,000 1,200 1,400
Frequ
ency
Method (i) Method (ii) Method (iii) Method (iv)
No. of candidates 10000
Maximum mark for coursework 63
Weighting (%) 25%
Tolerance 4 marks
Mean difference -12.4 -12.4 -12.4 -12.3
Mode -13 -13 -14 -16
[image:23.595.98.389.367.655.2]Figure 5.3b GCSE Business Studies Specification A Higher tier: differences between statistically moderated marks and
operational marks for the coursework component under method (i) with no tolerance or allowed difference applied
-40 -30 -20 -10 0 10 20
difference (stat mod - operational) 0
300 600 900 1,200 1,500
Freq
uency
[image:24.595.99.391.169.445.2]Figure 5.3c GCSE Business Studies Higher tier: effect on subject grades of replacing operational marks for the coursework component with statistically moderated marks (method (i), with no tolerance or
allowed difference applied)
* A B C D E U
grade 0
1,000 2,000 3,000
Frequ
ency
method actual atat mod
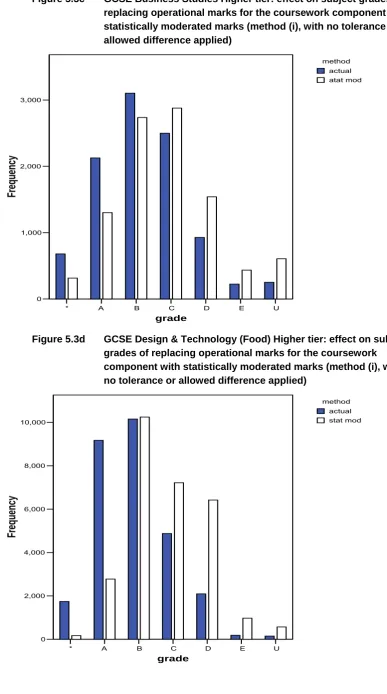
Figure 5.3d GCSE Design & Technology (Food) Higher tier: effect on subject grades of replacing operational marks for the coursework component with statistically moderated marks (method (i), with no tolerance or allowed difference applied)
* A B C D E U
grade 0
2,000 4,000 6,000 8,000 10,000
Frequ
ency
[image:25.595.94.482.93.788.2]Full summary statistics for Business Studies and Design & Technology are provided in Appendix B.
5.4
GCSE Music
This specification is considered separately because it has a different assessment structure from the other GCSE specifications in this study (in particular it has two centre-assessed coursework components) and because the proportions of centres which had adjustments to their coursework marks in 2004 were higher than in the other specifications (41.9% for Composing coursework and 26.8% for Performing coursework). Attention in this section is concentrated on Composing, since it had the higher proportion of centres with adjustments.
Table 5.4a shows summary statistics for Composing when no tolerance or allowed difference is applied. Figure 5.4a shows the outcomes diagrammatically for method (i).
Figure 5.4a GCSE Music Composing: differences between statistically moderated marks and operational marks under method (i) with no tolerance or allowed difference applied
-40 -30 -20 -10 0 10 20
difference (stat mod - operational) 0
500 1,000 1,500 2,000 2,500
Frequ
[image:26.595.98.390.421.712.2]Table 5.4a GCSE Music Composing: statistics for methods (i)-(iv) with no tolerance or allowed difference applied
In fact, the outcomes for Music Composing are similar to those for the Higher tier in both Business Studies and Design & Technology, where there was also a large negative mean difference.
Two further investigations were carried out for Music Composing. First, just those centres whose centre marks were accepted operationally were considered (ie the final marks for the component were centre marks4). Arguably (and under the assumption that the outcomes of the operational moderation by inspection process were correct), any adjustments made to these marks by statistical moderation are wrong. However, Table 5.4b shows that statistical moderation made substantial adjustments. In fact, the mean differences in Table 5.4b are greater than those in Table 5.4a.
Table 5.4b GCSE Music Composing (centres for which centre marks were accepted): statistics for methods (i)-(iv) with no tolerance or
allowed difference applied
The second additional investigation carried out in Music Composing was to repeat the calculations with the statistically moderated marks replaced by centre marks. In this case, despite the large proportion of adjustments made operationally, consistency with the operational outcomes is greater than when statistical moderation is used (see Table 5.4c and Figure 5.4b).
4 ie the marks originally awarded by the centre
5 This number is not 41.9% (the proportion of adjustments, quoted earlier) of the number of candidates in Table 5.4a,
because this proportion applies to the number of centres rather than the number of candidates.
Method (i) Method (ii) Method (iii) Method (iv)
No. of candidates 18245
Maximum mark for coursework 60
Weighting (%) 25%
Tolerance 4 marks
Mean difference -11.0 -11.1 -11.1 -11.0
Mode -10 -9 -10 -10
Standard deviation 6.7 7.6 8.6 8.0
Method (i) Method (ii) Method (iii) Method (iv)
No. of candidates 114075
Maximum mark for coursework 60
Weighting (%) 25%
Tolerance 4 marks
Mean difference -12.4 -12.4 -12.4 -12.4
Mode -10 -11 -12 -13
Table 5.4c GCSE Music Composing: differences between centre marks and
operational marks
Figure 5.4b GCSE Music Composing: differences between centre marks and
operational marks
-30 -20 -10 0 10 20 30
difference (cen - operational) 0
2,000 4,000 6,000 8,000 10,000 12,000
Freq
uency
It is clear that, although the use of centre marks produces a positive mean difference, the differences are generally closer to zero than when statistical moderation is used.
It was seen in section 5.1.1 above that, when an allowed difference is used, the statistically moderated marks were much more in line with the operational marks. Figure 5.4c shows the outcomes for statistically moderated marks in GCSE Music when an allowed difference was used (the vertical scale is the same as in Figure 5.4b to aid comparison).
Number of candidates 18245 Maximum mark for coursework 60
Weighting (%) 25%
Mean difference 2.3
Mode 0
[image:28.595.97.391.253.551.2]Figure 5.4c GCSE Music Composing: differences between statistically moderated marks and operational marks under method (i) with tolerance and allowed difference both applied
-30 -20 -10 0 10 20 30
difference (stat mod - operational) 0
2,000 4,000 6,000 8,000 10,000 12,000
Freq
uency
[image:29.595.96.386.154.435.2]Figure 5.4d GCSE Music: effect on subject grades of replacing operational marks for Composing coursework with centre marks
* A B C D E F G U
grade 0
1,000 2,000 3,000 4,000 5,000
Freq
uency
method actual with cen marks
Figure 5.4e GCSE Music: effect on subject grades of replacing operational marks for Composing coursework with statistically moderated marks (method (i), with tolerance and allowed difference applied)
0 1,000 2,000 3,000 4,000 5,000
Fr
eq
ue
ncy
[image:30.595.94.472.76.760.2] [image:30.595.99.464.77.389.2]Table 5.4d GCSE Music: crosstabulation showing effect on subject grades of replacing operational marks for Composing coursework with
centre marks
(Table shows numbers of candidates)
Grade with centre marks for Composing coursework Total
* A B C D E F G U
A* 1387 7 0 1 0 0 0 0 0 1395
A 164 2671 14 2 0 0 0 0 0 2851
B 0 393 3589 17 0 0 0 0 0 3999
C 0 3 523 3421 19 0 0 0 0 3966
D 0 0 8 391 1920 12 2 0 0 2333
E 0 0 0 20 283 1342 10 0 0 1655
F 0 0 0 0 11 164 792 9 1 977
G 0 0 0 0 0 3 74 389 4 470
Actual grade
U 0 0 0 0 0 0 0 35 199 234
Total 1551 3074 4134 3852 2233 1521 878 433 204 17880
Table 5.4e GCSE Music: crosstabulation showing effect on subject grades of replacing operational marks for Composing coursework with statistically moderated marks (method (i), with tolerance and
allowed difference applied)
(Table shows numbers of candidates)
Grade with statistical moderation for Composing coursework
A* A B C D E F G U Total
A* 1300 95 0 0 0 0 0 0 0 1395
A 327 2347 176 1 0 0 0 0 0 2851
B 1 576 3155 267 0 0 0 0 0 3999
C 0 3 654 3040 267 2 0 0 0 3966
D 0 0 4 489 1679 161 0 0 0 2333
E 0 0 0 14 394 1158 85 4 0 1655
F 0 0 0 0 9 262 667 38 1 977
G 0 0 0 0 0 3 139 311 17 470
Actual grade
U 0 0 0 0 0 0 0 58 176 234
Total 1628 3021 3989 3811 2349 1586 891 411 194 17880
5.5 GCE
specifications
Section 5.5.1 below describes the outcomes for the specifications which had negligible mean differences. In these and the other GCE specifications considered there is just one coursework unit; the other units were aggregated to form the moderating instrument. For Psychology, the use of a single unit as the moderating instrument was also investigated. The outcomes are described in section 5.5.2.
GCE Geography Specification A was included in the study although it does not have a centre-assessed unit. The same statistical moderation procedures were applied to the externally-assessed coursework component in this specification and the marks compared with the operational marks. The adjustments were in fact larger than those in almost any other specification, even though (under the assumption that the marking of this unit was correct) there should be no adjustments. This is similar to the situation described for GCSE Music in Table 5.4b where only those centres whose marks were accepted without adjustment in the operational examination were included in the analysis.
Summary statistics for all of the GCE specifications considered are provided in Appendix C.
5.5.1 GCE Business Studies and GCE French
For these two specifications there were negligible mean differences between the statistically moderated marks and the operational marks for the coursework component. Table 5.5.1a and Figure 5.1.1a show the outcomes for GCE Business Studies with no tolerance or allowed difference applied.
Table 5.5.1a GCE Business Studies: statistics for methods (i)-(iv) with no tolerance or allowed difference applied
Method (i) Method (ii) Method (iii) Method (iv)
No. of candidates 7323
Max mark for coursework unit 84
Weighting (%) 15% (of the total A level assessment)
Tolerance 6 marks
Mean difference 0.0 0.1 0.1 0.1
Mode 1 -1 0 0
Figure 5.5.1a GCE Business Studies: differences between statistically moderated marks and operational marks under method (i) with no tolerance or allowed difference applied
-30 -20 -10 0 10 20 30
difference (stat mod - operational) 0
200 400 600 800 1,000 1,200
Frequency
[image:33.595.98.493.90.411.2]It can be seen both from the standard deviations in Table 5.5.1a and from the spread of differences evident in Figure 5.5.1a that, despite the mean difference of zero, the coursework marks received by candidates under statistical moderation would be very different from those received operationally. However, because of the relatively low weighting of coursework in this specification, relatively few candidates would change subject grade, as shown in the crosstabulation in Table 5.5.1b.
Table 5.5.1b GCE Business Studies: crosstabulation showing effect on subject grades of replacing operational marks for the
coursework unit with statistically moderated marks (method (i), with no tolerance or allowed difference applied)
(Table shows numbers of candidates)
Grade with statistical moderation for the coursework unit
A B C D E U Total
A 1140 49 0 0 0 0 1189
B 93 1623 95 0 0 0 1811
C 0 104 1754 123 0 0 1981
D 0 0 87 1340 71 0 1498
E 0 0 0 40 638 43 721
Actual grade
U 0 0 0 0 7 116 123
Application of tolerance tended to reduce to zero the differences which were close to zero, although the standard deviation of the differences changed very little. Figure 5.5.1b illustrates.
Figure 5.5.1b GCE Business Studies: differences between statistically moderated marks and operational marks under method (i) with tolerance applied but no allowed difference
-30 -20 -10 0 10 20 30
difference (stat mod - operational) 0
1,000 2,000 3,000 4,000
Fr
equency
Figure 5.5.1c GCE Business Studies: differences between statistically moderated marks and operational marks under method (i) with tolerance and allowed difference applied
-30 -20 -10 0 10 20 30
difference (stat mod - operational) 0
1,000 2,000 3,000 4,000
Frequency
It appears that in this specification the effect of this method of statistical moderation was generally to increase candidates’ marks for the coursework unit.
The outcomes for GCE French were very similar. Summary statistics are provided in Appendix C.
5.5.2 GCE Psychology
Table 5.5.2a GCE Psychology (moderating instrument is aggregation of all written units): statistics for methods (i)-(iv) with no tolerance or
allowed difference applied
Table 5.5.2a GCE Psychology (moderating instrument is Unit 5): statistics for methods (i)-(iv) with no tolerance or allowed difference applied
[image:36.595.92.495.367.741.2]
Figure 5.5.2a GCE Psychology (moderating instrument is aggregation of all written units): differences between statistically moderated marks and operational marks under method (i) with no tolerance or allowed difference applied
1,000 2,000 3,000 4,000
Fr
eq
uen
cy
Method (i) Method (ii) Method (iii) Method (iv)
No. of candidates 24504
Max mark for coursework unit 60
Weighting (%) 15%
Tolerance 4 marks
Mean difference -8.7 -8.6 -8.6 -8.6
Mode -8 -9 -9 -7
Standard deviation 4.8 5.7 5.2 6.0
Method (i) Method (ii) Method (iii) Method (iv)
No. of candidates 24504
Max mark for coursework unit 60
Weighting (%) 15%
Tolerance 4 marks
Mean difference -14.7 -14.6 -14.6 -14.6
Mode -9 -16 -11 -18
Figure 5.5.2b GCE Psychology (moderating instrument is Unit 5): differences between statistically moderated marks and operational marks under method (i) with no tolerance or allowed difference applied
-40 -30 -20 -10 0 10 20
difference (stat mod - operational) 0
1,000 2,000 3,000 4,000
Frequency
[image:37.595.99.494.73.422.2]In both cases, but particularly where Unit 5 was used as moderating instrument, many candidates would lose a grade, as shown in the crosstabulation in Table 5.5.2c.
Table 5.5.2c GCE Psychology (moderating instrument is Unit 5):
crosstabulation showing effect on subject grades of replacing operational marks for the coursework unit with statistically moderated marks (method (i), with no tolerance or allowed
difference applied)
(Table shows numbers of candidates)
Grade with statistical moderation for the coursework unit
A B C D E U Total
A 2620 1901 2 0 0 0 4523
B 20 2580 2683 3 0 0 5286
C 0 6 2830 2832 2 0 5670
D 0 0 8 2551 2107 1 4667
E 0 0 0 3 1799 1033 2835
Actual grade
U 0 0 0 0 0 1073 1073
The outcomes with tolerance and/or allowed difference applied were similar to those for other specifications, with the spread of differences when the moderating instrument was Unit 5 alone continuing to be greater than when the moderating instrument was the aggregation of all written units. Full summary statistics are provided in Appendix C.
6.
TEACHER ASSESSMENT: RESULTS
As in section 5, it would be impracticable to provide full details of the findings. However, the outcomes followed a limited number of distinct patterns and it has been possible to place most of the cases investigated into categories corresponding to these patterns. Thus, all of the outcomes can be illustrated using relatively few examples.
As indicated in section 4.3, only GCE specifications were considered in this part of the study.
As explained in section 4.1, candidates’ uniform marks for a certain unit or units were replaced by the centres’ estimated grades (‘teacher assessments’) and the resulting subject grades were compared with those obtained operationally. The details, including the unit(s) for which teacher assessments were used, were varied from one specification to another, partly because of differing assessment structures. Teacher assessment was used both for just a single unit and for several units. For example, in Communication Studies separate investigations were carried out using teacher assessment for Units 1-5, for Units 1, 2 and 4, and for Unit 6. Both unmoderated and (statistically) moderated teacher assessments were used. The moderation was carried out using one of the methods from Part 1 of the study, namely adjustment of centre mean marks with no tolerance or allowed difference applied (this was the most straightforward of the methods investigated). As described in section 4.1, two ways of making the comparisons between teacher assessment and moderating instrument were used. For example, when teacher assessment was used for Units 1-5 (and the moderating instrument was Unit 6), moderation was carried out first by comparing the teacher assessment mean for the centre for Units 1-5 with the actual (external) mean for the centre for Unit 6 and second by comparing the teacher assessment mean for the centre for Unit 6 with the actual mean for the centre for Unit 6. Thus, letting c be
the teacher assessment mark for Units 1-5, d the teacher assessment mark for Unit
6, w the external mark for Unit 6 and y the moderated teacher assessment mark for
Units 1-5,
y = c -
c
+w
under the first methodand y = c - d +
w
under the second method,where
c
, d andw
are the means for the centre of c, d and w.The outcomes of this part of the study depend heavily on both the accuracy of centres’ estimated grades and on the effectiveness of the statistical moderation. It was noted earlier that the study does not seek to investigate the accuracy of estimated grades, but for the record the evidence in one specification (GCE Business Studies) are is presented in Appendix D.
6.1 Category
1
In this category teacher assessment tends to create bunching. Business Studies, with teacher assessment for Units 1-5, is used to illustrate.
Table 6.1a GCE Business Studies: crosstabulation showing effect on subject grades of replacing operational marks for Units 1-5 with
unmoderated teacher assessments
(Table shows numbers of candidates)
Grade with teacher assessments
A B C D E U Total
A 849 373 74 3 0 0 1299
B 328 843 605 64 3 0 1843
C 29 394 1140 443 24 4 2034
D 0 32 481 874 168 23 1578
E 0 2 49 360 265 40 716
Actual grade
U 0 0 5 33 100 38 176
Total 1206 1644 2354 1777 560 105 7646
Figure 6.1a GCE Business Studies: bar chart showing effect on subject grades of replacing operational marks for Units 1-5 with
unmoderated teacher assessments
A B C D E U
subject grade 0
500 1,000 1,500 2,000 2,500 3,000
F
req
uency
[image:39.595.91.486.287.752.2]The main feature here is that, when teacher assessment was incorporated, the numbers of candidates in a grade were lower at the top and bottom but higher in the middle. The crosstabulation shows that many candidates would change grade, by up to three grades.
Other specifications and configurations with a similar pattern are listed in Table 6.1b. The trend at the middle grades is not exactly the same in all of these cases (for example, at grade B the ‘with teacher assessment’ number was sometimes higher than the actual number and at grade D the opposite was sometimes true) but it was always the same at grades A, E and U.
Table 6.1b Specifications with the same pattern as in Figure 6.1a
Specification Units with teacher assessment
Business Studies 1-5
Communication Studies 1-5 Communication Studies 1, 2, 4
Geography A 1-5
ICT 1-4, 6
Psychology A 1-4, 6
6.2 Category
2
In this category teacher assessment tends to create grade inflation. Law, with teacher assessment for Units 1-5, is used to illustrate.
Table 6.2a GCE Law: crosstabulation showing effect on subject grades of replacing operational marks for Units 1-5 with unmoderated teacher assessments
(Table shows numbers of candidates)
Grade with teacher assessments
A B C D E U Total
A 396 96 10 1 0 0 503
B 153 292 124 11 0 0 580
C 19 196 273 81 3 2 574
D 2 33 203 198 30 7 473
E 0 3 52 159 67 15 296
Actual grade
U 0 1 12 40 70 32 155
Figure 6.2a GCE Law: bar chart showing effect on subject
grades of replacing operational marks for Units 1-5 with unmoderated teacher assessments
A B C D E U
subject grade 0
100 200 300 400 500 600 700
F
req
uency
method actual with tch ass
The main feature here is that, when teacher assessment is incorporated, the numbers of candidates in a grade are higher at the top but lower at the bottom. As in Category 1, the crosstabulation shows that many candidates change grade, here by as much as four grades.
[image:41.595.104.457.75.394.2] [image:41.595.125.463.591.724.2]Other specifications and configurations with a similar pattern are listed in Table 6.2b. The trend at the middle grades is not exactly the same in all of these cases (for example, at grade B the ‘with teacher assessment’ number was sometimes lower than the actual number) but it was always the same at grades A, E and U.
Table 6.2b Specifications with the same pattern as in Figure 6.2a
Specification Units with teacher assessment
Communication Studies 6
English Literature A 1-5
English Literature A 6
French 1, 2, 3, 5, 6
Geography B 1-5
Geography B 1-4, 6
ICT 1-4, 6
6.3
Category
3
In this category teacher assessment tends to create greater dispersion or discrimination. English Literature Specification B, with teacher assessment for Units 3 and 4, is used to illustrate.
Table 6.3a GCE English Literature B: crosstabulation showing effect on subject grades of replacing operational marks for Units 3 and 4 with unmoderated teacher assessments
(Table shows numbers of candidates)
Grade with teacher assessments
A B C D E U Total
A 843 10 0 0 0 0 853
B 162 584 57 0 0 0 803
C 0 85 582 146 0 0 813
D 0 0 39 437 158 0 634
E 0 0 0 7 133 63 203
Actual grade
U 0 0 0 0 1 20 21
Total 1005 679 678 590 292 83 3327
Figure 6.3a GCE English Literature B: bar chart showing effect on subject grades of replacing operational marks for Units 3 and 4 with
unmoderated teacher assessments
A B C D E U
0 200 400 600 800 1,000 1,200
F
req
uency
[image:42.595.98.451.432.723.2]was one grade, much less dramatic than in Tables 6.1a and 6.2a. There is a simple reason: teacher assessment was used for only two units, in contrast to Tables 6.1a and 6.2a where it was used for five units.
The only other example found which followed the same pattern was AS English Literature B, with teacher assessment for Unit 3.
6.4
Category
4
In this category there is little change. AS Biology Specification A, with teacher assessment for the third of the three units6, was the only example found.
Table 6.4a GCE AS Biology Specification A: crosstabulation showing effect on subject grades of replacing operational marks for the third unit with unmoderated teacher assessments
(Table shows numbers of candidates)
Grade with teacher assessments
A B C D E U Total
A 1997 216 2 0 0 0 2215
B 169 1644 207 1 0 0 2021
C 0 190 1529 197 1 0 1917
D 0 2 160 1453 195 4 1814
E 0 0 0 171 1195 150 1516
Actual grade
U 0 0 0 0 110 1570 1680
Total 2166 2052 1898 1822 1501 1724 11163
Figure 6.4a GCE AS Biology Specification A: bar chart showing effect on subject grades of replacing operational marks for the third unit with unmoderated teacher assessments
A B C D E U
subject grade
0 500 1,000 1,500 2,000 2,500 3,000
Frequency
method actual with tch ass
6 This is actually Unit 4. Unit 3 is part of the parallel Human Biology specification; candidates for AS Biology take
[image:43.595.91.494.292.744.2]When teacher assessment was incorporated, the numbers of candidates in a grade did not change much. However, the cross-tabulation shows that there would be a change of one grade for many candidates.
6.5 Effect
of
moderating the teacher assessments
With a few exceptions, moderation had a similar effect on all of the specifications/configurations within a category. This effect is illustrated by means of the examples in sections 6.5.1 - 6.5.4 below.
[image:44.595.104.471.412.696.2]6.5.1 Category 1
Figure 6.5.1a shows the outcomes when the teacher assessments for Business Studies (Units 1-5) were moderated. The vertical scale is the same as in Figure 6.1a.
Figure 6.5.1a GCE Business Studies: bar chart showing effect on subject grades of replacing operational marks for Units 1-5 with teacher assessments moderated by comparing the centre’s mean teacher assessment for Units 1-5 with the centre’s mean external mark for Unit 6
A B C D E U
subject grade 0
500 1,000 1,500 2,000 2,500 3,000
Freq
uen
c
y
Table 6.5.1a Specifications/configurations in Category 1 with the same pattern after statistical moderation as in Figure 6.5.1a
Specification Units with tch ass Moderating instrument (Unit(s)) Units whose tch ass mean was compared with the mod
inst mean Max mark for tch ass7 Mean diff (moderated
tch ass - original tch
ass)
Bus Studs 1-5 6 1-5 25 -2.9
Comm Studs 1-5 6 1-5 25 -1.8
Geography A 1-5 6 1-5 25 -0.9
ICT 1-4 & 6 5 1-4 & 6 25 -3.4
Psychology A 1-4 & 6 5 1-4 & 6 25 -3.7
In some other cases the statistical moderation had little effect and the pattern of grades was broadly the same as for the unmoderated teacher assessments. These cases are listed in Table 6.5.1b.
Table 6.5.1b Specifications/configurations in Category 1 where statistical moderation had little effect on the pattern of grades (ie pattern is similar to that in Figure 6.1a)
Specification Units with tch ass Moderating instrument (Unit(s)) Units whose tch ass mean was compared with the mod
inst mean Max mark for tch ass Mean diff (moderated
tch ass - original tch
ass)
Bus Studs 1-5 6 6 25 -0.5
Comm Studs 1-5 6 6 25 -0.3
Comm Studs 1, 2, 4 3, 5, 6 1, 2, 4 15 -0.5 Comm Studs 1, 2, 4 3, 5, 6 3, 5, 6 15 -0.3
Geography A 1-5 78 7 25 -0.2
ICT 1-4, 6 5 5 25 -0.6
Psychology A 1-4, 6 5 5 25 -0.7
There is a clear pattern here. In Table 6.5.1b (except for Communication Studies) it is the teacher assessment for the moderating instrument (instead of the teacher assessment for the other units) which was used in the moderation process. In the examples studied, this procedure gives rise to a smaller mean difference and thus the moderation has less effect.
7 As explained in section 4.1, the teacher assessment for a unit in the model used has a nominal maximum of 5.
Thus, where there are five units, the maximum is 25.
8 Candidates take either Unit 6 or Unit 7. The route consisting of Units 1-5 and 7 was the one considered in this
It was seen in sections 6.1 - 6.4 that there were many changes of grade when operational marks were replaced by teacher assessments. Applying statistical moderation to the teacher assessments did not reduce the number of changes (and often increased them).
[image:46.595.102.469.304.585.2]6.5.2 Category 2
Figure 6.5.2a shows the outcomes when the teacher assessments for Law (Units 1-5) were moderated. The vertical scale is the same as in Table 6.2a.
Figure 6.5.2a GCE Law: bar chart showing effect on subject
grades of replacing operational marks for Units 1-5 with teacher assessments moderated by comparing the centre’s mean teacher assessment for Units 1-5 with the centre’s mean external mark for Unit 6
A B C D E U
subject grade 0
100 200 300 400 500 600 700
Freq
uen
c
y
method actual with mod tch ass
In fact, the pattern is similar to the Business Studies example in Figure 6.5.1a.
Table 6.5.2a Specifications/configurations in Category 2 with the same pattern after statistical moderation as in Figure 6.5.2a
Specification Units with tch ass Moderating instrument (Unit(s)) Units whose tch ass mean was compared with the mod
inst mean Max mark for tch ass Mean diff (moderated
tch ass - original tch
ass)
Eng Lit A 1-5 6 1-5 25 -2.8
French 1-3, 5, 6 4 1-3, 5, 6 25 -1.4
Geography B 1-4, 6 5 1-4, 6 25 -1.3
ICT 1-4, 6 5 1-4, 6 25 -3.4
Law 1-5 6 1-5 25 -1.4
In fact, the downward shift in grades was more substantial for English Literature and Law (thus, the moderated teacher assessment bar at grade A was lower and that at grade U was higher), as might be expected from the (numerically) larger mean differences.
In some other cases the statistical moderation had little effect and the pattern of grades was broadly the same as for the unmoderated teacher assessments. These cases are listed in Table 6.5.2b.
Table 6.5.2b Specifications/configurations in Category 2 where statistical moderation had little effect on the pattern of grades (ie pattern is similar to that in Figure 6.2a)
Specification Units with tch ass Moderating instrument (Unit(s)) Units whose tch ass mean was compared with the mod
inst mean Max mark for tch ass Mean diff (moderated
tch ass - original tch
ass)
Comm Studs 6 1-5 6 5 -0.1
Eng Lit A 1-5 6 6 25 -0.5
Eng Lit A 6 1-5 6 5 -0.1
French 1-3, 5, 6 4 4 25 -0.2
Geography B 1-5 6 6 25 -0.2
Geography B 1-4, 6 5 5 25 -1.3
[image:47.59