BONE MAPPING OF THE MANDIBULAR
BUCCAL SHELF – A CBCT STUDY
Dissertation submitted to
THE TAMILNADU Dr. M.G.R. MEDICAL UNIVERSITY
In partial fulfillment for the degree of
MASTER OF DENTAL SURGERY
BRANCH V
ORTHODONTICS AND DENTOFACIAL ORTHOPAEDICS
ACKNOWLEDGEMENTS
I would like to acknowledge and thank my beloved Professor and Head, Dr. N. R. Krishnaswamy, M.D.S., M. Ortho (RCS, Edin), D.N.B. (Ortho), Diplomate of Indian board of Orthodontics, Department of Orthodontics, Ragas Dental College and Hospital, Chennai. I consider myself extremely fortunate to have had the opportunity to train under him. His enthusiasm, integral view on research, tireless pursuit for perfection and mission for providing ‘high quality work’, has made a deep impression on me. He has always been a source of inspiration to strive for the better not only in academics but also in life. His patience and technical expertise that he has shared throughout the duration of the course has encouraged me in many ways.
I am privileged to express my extreme gratefulness to my respected guide, Professor Dr. M. K. Anand, M.D.S., for his guidance which helped me complete this study. His everlasting inspiration, encouragement, constructive criticism and valuable suggestions conferred upon me have encouraged me.
My sincere thanks to Professor A. Kanakaraj, Chairman,
Dr. N.S. Azhagarasan, Principal, Ragas Dental College for providing me with an opportunity to utilize the facilities available in this institution in order to conduct this study.
I would also like to acknowledge Dr. G. Jayakumar (Professor),
(Reader), Dr. Shobbana Devi (Reader), Dr. Premalatha (Reader),
Dr. Kavitha (Lecturer), Dr. Dhivya Lakshmi (Lecturer) and Dr. Bharath Ramesh (Lecturer) for their support, enthusiasm & professional assistance throughout my post graduate course.
I would also like to thank Dr. Madan Kumar (Professor) and
Dr. Brinda (Lecturer) Department of Community Dentistry for thier valuable suggestions during my statistical work.
I would also like to thank my friend Dr. John Nesan, M.D.S., for his fervent personal interest and selfless guidance and also the CTARS team for helping me with 3D reconstruction.
My heartfelt thanks to my wonderful batch mates, Dr. B. N. Vineesha, Dr. R. Preeti, Dr. Evan. A. Clement, Dr. G. Preethi, Dr. Veerasankar. S, Dr. Dhanalakshmi, Dr. Vidhu. S, who were cheerfully available at all times to help me. Their support and friendship was constant during these last years, and I deeply appreciate it.
I also extend my gratitude to my juniors Dr. Aparna, Dr. Mathew, Dr. Charles, Dr. Harish, Dr. Gopinath, Dr. Sam Prasanth, Dr. Rishi, and
Dr. Swathy for their support.
and the Scribbles team for their co-operation and help during my course of study.
I would like to thank my seniors Dr. Arpitha Rao, Dr. Ravi Teja, Dr. Revathi. N, and Dr. Sharanya Devi for their constant encouragement and
support.
CONTENTS
S .No. TITLE PAGE NO
1. INTRODUCTION 1
2. REVIEW OF LITERATURE 5
3. MATERIALS & METHODS 27
4. RESULTS 34
5. DISCUSSION 50
6. SUMMARY & CONCLUSION 67
7. BIBLIOGRAPHY 69
Introduction
1
INTRODUCTION
One of the difficult malocclusions to diagnose and treat is the Class III
malocclusion which is believed to be hereditary, although environmental
factors also plays a major role. The prevalence of Class III malocclusion
varies among different ethnic groups, Southeast Asian populations have the
highest prevalence of Class III malocclusion (13% to 27%). Individuals with
Class III malocclusion may have combinations of skeletal and dentoalveolar
components.94
Various treatment modalities are available for class III individuals, like
early timely treatment, camouflage and orthognathic surgery. In severe
Class-III adult patients, surgical repositioning of the maxilla and/or mandible is often
the preferred choice of treatment. If patients consent to orthognathic surgery,
subsequent orthodontic treatment becomes simple with superior functional and
esthetic results. However, several patients refuse surgery. In such situations,
orthodontic camouflage treatment may be an alternative, particularly if
discrepancy is slight or moderate.25
With the advent of temporary anchorage devices (TADs) the envelope
of discrepancy has changed and the treatment methods have expanded with
more predictable tooth movements with empowered anchorage. Camouflage
treatment with TADs have recently proved to be effective for class III patients
Introduction
2
mild-to-moderate Class III malocclusions, TADs allow en masse distalization
of the mandibular arch without any anchorage loss.
Placement site and stability of TADs play an important role in
providing absolute anchorage during en masse retraction of the mandibular
dentition in class III patients. TADs are placed in the interradicular and
extraradicular areas of the mandible for en masse distalization. The common
failure that occurs with the interradicular TADs is the root contact and lack of
cortical bone thickness. Extraradicularly TADs are commonly placed in the
mandibular retromolar area and buccal shelf.
Among all the factors that determine TAD stability and success rate,
the most important is the thickness of the cortical bone in which it is being
placed.126,77 Researchers reported that even as small as 0.5 mm differences in
cortical bone thickness can have a major impact on success rates.91 By
understanding cortical bone trends vertically and horizontally, orthodontists
will be able to maximize the chances for success.
Buccal shelf is the extension of external oblique ridge of the mandible,
anatomically it is a very safe site for extraradicular TADs because of the
density of the cortical bone present. The slope of the mandibular buccal shelf
lateral to the first molar is often quite steep, compared to a flatter area lateral
to second molar, which is more appropriate for TAD placement. The area
Introduction
3
inadequate. It is always best assess the anatomical bone morphology of buccal
shelf three dimensionally before TAD placement.70
CBCT allows clinically accurate and reliable 3-dimensional linear
measurements of the cortical bone thickness in the mandibular buccal shelf.
Cone-beam computed tomography (CBCT) has become a popular modality in
the evaluation of orthodontic diagnoses and outcomes. It offers high
diagnostic value with a relatively low radiation dose.86 Measurements made
with CBCT have been shown to be accurate to within 0.1 to 0.2 mm.46 CBCT
helps to quantify the skeletal anatomy of the buccal shelf, placement angle of
the TADs, and amount of cortical and cancellous bone engagement at the
TAD interface lateral to the molar root.70
In recent past there has been an increase in the number of adult class
III cases seeking camouflage treatment, so an intense knowledge about the
bone morphology in various areas can guide the clinicians in selecting the
placement site and the proper placement protocol. A very scant literature is
available regarding the mandibular buccal shelf region in relation to TAD
Introduction
4
Hence the objective of this study is to assess the cortical and
cancellous bone thickness in the mandibular buccal shelf region using CBCT.
Aim of the Study
:The aim of this study is to evaluate the cortical and cancellous bone
thickness in the mandibular buccal shelf region in class I and class III skeletal
malocclusion subjects by bone mapping using cone beam computed
Review of Literature
5
REVIEW OF LITERATURE
Cone beam computed Tomography
Temporary Anchorage Devices
Alveolar bone thickness and different vertical face types
Buccal Shelf and cortical bone thickness
CONE BEAM COMPUTED TOMOGRAPHY (CBCT)
Scarfe et al. 2006,115 described that CBCT for the maxillofacial region
enables multiplanar imaging and provides 3-dimensional (3D) information,
allowing measurement of axial inclinations of the dentition and changes in the
transverse dimensions free from distortion, magnification, and
superimposition. CBCT imaging provides submillimetre resolution images
(isotropic resolution, 0.4-0.125 mm) with relatively short scanning times
(10-70 seconds) and a reduced radiation dose (equivalent to that needed for
4-15 panoramic radiographs).
Maria et al. 2008,76 compared the radiation doses for conventional
panoramic and cephalometric imaging with the doses for 2 different CBCT
units and a multi-slice CT unit in orthodontic practice. The effective dose was
lower for the panoramic and lateral cephalometric device (10.4 µSv), and
highest for the multi-slice CT (429.7 µSv). It was concluded from
Review of Literature
6
doses to patients. However, when 3-dimensional imaging is required in
orthodontic practice, a CBCT should be preferred over a CT image.
De Vos W et al. 2009,32 reported that Cone beam Computed
Tomography systems offer many benefits over medical CT for orthodontic
treatment and planning. These benefits included a lower radiation dose to the
patient, shorter acquisition times for the resolution desired in orthodontics, and
significantly lower cost than medical CT. The limitations associated with
CBCT scanners are increased scatter radiation, limited dynamic range of
X-ray area detectors, and beam hardening artefacts.
Ribeiro et al, 2010,112 analyzed the rapid maxillary expansion using
CBCT and reported that the lateral repositioning of the maxilla and increased
basal bone can be accurately observed which confirms the marked
morphological changes that occur in the upper arch and nasomaxillary
structure. They concluded that CBCT is a ground-breaking diagnostic method
in dentistry as it provides high dimensional accuracy of the facial structures
and a reliable method for quantifying the behaviour of the maxillary halves,
dental tipping, bone formation at the suture in the three planes of space, as
well as alveolar bone resorption and other consequences of palatal expansion.
Mah et al, 2011,73 CBCT allows for visualization within the alveolar
bone volume for sclerotic phenomenon that produce local intra-alveolar bone
Review of Literature
7
high proportion of the lesions, between 88% and 100%, are found in the
mandible. Within the mandible, most of the lesions are noted in the premolar
and molar region. An orthodontist may use this valuable information to
preclude certain types of biomechanics, such as torqueing or protraction or
retraction of teeth through the affected area. For placement of TADs, CBCT
allows for visualization of the interproximal root space, palatal cortical bone
thickness, sinus morphology, and other critical structures for proper selection
of TAD length. In addition, assessment of bone density is possible from the
volumetric data which allows selection of an ideal site for placement of TADs.
In recent trends a number of orthodontic diagnosis and treatment plan
changes varied widely by patient characteristics. The most frequently reported
diagnosis and treatment plan changes were in patients with unerupted teeth,
severe root resorption, or severe skeletal discrepancies. Hodges et al, 2013,48
supported that obtaining a CBCT scan before orthodontic diagnosis and
treatment planning is necessary when a patient has an unerupted tooth with
delayed eruption or a questionable location, severe root resorption as
diagnosed with a periapical or panoramic radiograph, or a severe skeletal
discrepancy. He proposed that CBCT scans should be ordered only when there
is clear, specific, individual clinical justification.
Fernanda et al. 2013,40 presented a novel classification method for
individual assessment of midpalatal suture morphology using CBCT. They
Review of Literature
8
A, straight high-density sutural line, with no or little interdigitation; Stage B,
scalloped appearance of the high-density sutural line; Stage C, 2 parallel,
scalloped, high-density lines that were close to each other, separated in some
areas by small low-density spaces; Stage D, fusion completed in the palatine
bone, with no evidence of a suture; and Stage E, fusion anteriorly in the
maxilla. They concluded that this new classification method has the potential
to avoid the side effects of rapid maxillary expansion failure or unnecessary
surgically assisted rapid maxillary expansion for late adolescents and young
adults.
The heightened use of cone-beam computed tomography in
orthodontics has been coupled with increasing concern about the long-term
risks of x-ray exposure in orthodontic patients. Ludlow et al. 2013,71
calculated the effective doses in various combinations of field of view size and
field location comparing child and adult anthropomorphic phantoms. Scan
protocols used were high resolution (360 degrees rotation, 600 image frames,
120 kV[p], 5 mA, 7.4 seconds), standard (360 degrees, 300 frames, 120 kV[p],
5 mA, 3.7 seconds), QuickScan (180 degrees, 160 frames, 120 kV[p], 5 mA,
2 seconds), and QuickScan+ (180 degrees, 160 frames, 90 kV[p], 3 mA,
2 seconds). Contrast-to-noise ratio was calculated as a quantitative measure of
image quality for the various exposure options using the QUART DVT
Review of Literature
9
panoramic examinations. Significant dose reductions are accompanied by
significant reductions in image quality.
In a randomized block study design (left and right MSI interradicular
sites in the same arch in a patient). All the MSIs were then randomly allocated
by using split mouth system into two groups such that MSI placement guided
by CBCT on one side and RVG (digital intraoral periapical radiograph) on the
other side in all the patients, Kalra 2016,59 proposed that considering the high
cost and radiation dose compared to 2-D radiographs, routine use of CBCT is
not recommended for orthodontic mini-implant placement. However, if MSI
placement is difficult because of complex anatomy, the use of CBCT data for
planning may be considered.
TEMPORARY ANCHORAGE DEVICES (TADs)
Cope 2005,26 temporary anchorage device (TAD) is a device that is
temporarily fixed to bone for the purpose of enhancing orthodontic anchorage
either by supporting the teeth of the reactive unit or by obviating the need for
the reactive unit altogether, and which is subsequently removed after use.
Anchorage
Freudenthaler 200126 Anchorage in orthodontics is defined as the
amount of allowed movement of the reactive unit in a force system. Another
definition of anchorage as given by Daskalogiannakis & Ammann 2000,30
Review of Literature
10
situations, movement of the reactive unit is desirable, but quite frequently it is
critical for the reactive unit in the orthodontic system to remain absolutely
stationary while the active unit is moved in its desired direction.
Papadopoulos & Tarawneh 2007;101 Cope JB26 Miniscrew implants
or MSIs, have also been referred to as: microimplant, microscrew implant,
mini-implant, mini dental implant, miniscrew, temporary anchorage device
(TAD), and OrthoImplant.
According to Cope JB,26 Micro- is an inappropriate term, since it is
derived from microscopic or something so small that it can only be visualized
with a microscope. Sung et al. 2006,119 disagrees saying that micro- can be
used to emphasize small size such as in the terms microsomia, micrognathia,
microdontia and that “micro” should be used for implants smaller than 1.9 mm
and “mini” for implants greater than 1.9 mm, but still much smaller than
traditional dental implants.
Misch, 1988,83 classified the density of bone present in the maxilla and
mandible as D1, a dense cortical bone mostly seen in the anterior mandible at
less than 1250 Hounsfield units, then D2, a porous cortical and coarse
trabecular bone quality present commonly in the anterior and posterior
mandible and anterior maxilla which can be viewed at 850 to 1250 Hounsfield
units, then D3, a thin porous cortical and coarse trabecular bone seen in the
Review of Literature
11
units, and D4, a fine trabecular bone seen in the posterior maxilla viewed at
150-350 Hounsfield units.
Retention
Retention of MSIs in bone depends on different influencing factors
such as a) the miniscrew implant type, the miniscrew implant dimensions b)
the implant surface characteristics Kim et al. 2009,62 c) the insertion angle
Wilmes, Su & Drescher 2008,127 d) the drilling hole size e) the insertion
torque Motoyoshi et al. 2006,91 f) the force magnitude Cheng et al.22 23
g) the anatomic location Wiechmann et al.11quality and quantity of the bone,
the soft tissue characteristics Cheng et al.22 and inflammation of the
periimplant area Miyawaki et al. 2003.85
Stability of Mini-Implant
Marquezan et al. 2011,124 Meredith et al.82 When discussing MSI
stability and retention, it is important to define and understand the influence of
both primary and secondary stability separately. Primary stability is a function
of the mechanical retention between the MSI threads and the bone, and
expresses the initial stability of a recently placed MSI. It is most often
indirectly measured by the moment of force required to screw the MSI into the bone. This force is most commonly referred to as “insertion torque” Meredith
Review of Literature
12
Chen et al. 2009,20 performed a systematic review of the literature,
which identified primary stability, measured by insertion torque, as the most
critical factor for the success of MSI. If primary stability is not adequate
following implantation, the implant-bone interface is weakened and resulting
MSI micro-motion can cause failure Chen, Kyung, et al. 2009;20 Javed et al.
2011.54 The primary stability, which is important for MSI survival, is
measured in most studies by means of the insertion torque or pull out strength.
Meredith; Baumgaertel 2010,82116 Secondary stability is a
consequence of bony remodeling at the MSI bone interface and refers to the MSI’s stability after the placement site has healed. It represents the
maintenance of stability as a result of localized healing and bony remodeling,
with the possibility of new bone formation at the interface. Secondary stability is mainly dependent on the host’s response to the MSI and is influenced by
several factors.
The success rates of orthodontic microimplants have been reported
differently because of several variables. In addition, many studies have
recently been performed to determine factors affecting their success rates.
Among them, root proximity to the orthodontic implant, cortical bone
thickness, and placement angle have been reported frequently. Yi-Ra Jung et
al. 2011,131 examined microimplants implanted into the maxillary buccal
alveolar bone at the midpoint between the roots of the adjacent teeth, and
Review of Literature
13
chains, Vertical and horizontal placement angles were determined by
measuring the occlusal and mesial angles between the bone surface and the orthodontic microimplant’s long axis on the reoriented coronal and axial views
of the CBCT images, respectively. Vertical and horizontal placement angles
and cortical bone thickness are not significantly related to the success rate of
orthodontic microimplants, but root proximity is significantly related to their
success. Cortical bone thickness is significantly related to the vertical and
horizontal placement angles, but root proximity is not significantly related to
the vertical and horizontal placement angles.
Factors Affecting Mini-Implant Failure Rates
Primary stability has been shown to be the most critical factor for the
success of orthodontic MSI Chen, Kyung, et al. 2009.20 A review of the
literature identifies several factors that affect the insertion torques reached and
resulting primary stability of MSI. It has been well established that when
comparing screws of varying size, an increase in MSI diameter has a very
strong influence on peak insertion torques reached Lim et al. 2008,66 while
MSI length influences insertion torque to a lesser degree Kim et al. 2009.62
Wilmes, Su & Drescher 2008,127 Numerous studies have shown that
tapered screws reach significantly higher insertion torques, explained by the
gradual increase in diameter on insertion. Wilmes & Drescher 2011,127
Review of Literature
14
thicker layers of compact bone cause increased placement resistance. Uemura
et al. 2012,122 also well documented is the effect of MSI site preparation on
insertion torques reached. The presence of a pilot hole decreases insertion
torques due to decreased bone-to-metal contact, while the size of the pilot hole
is inversely proportional to the implant primary stability. Devlin et al. 1998,35
of all factors studied, it is generally agreed that the alveolar bone quality,
cortical bone thickness and insertion torque are among the most important
factors for achieving good primary stability. Regional differences in jaw
anatomy and bone structure may explain some of the variation in clinical
success rate between the maxilla and mandible.
Additional factors discussed in the literature affecting implant primary
stability include: thread design, MSI surface area, insertion depth, insertion
angle and bone quality related to age of the patient Motoyoshi et al. 2010.92
ALVEOLAR BONE THICKNESS AND DIFFERENT VERTICAL
FACE TYPES
While investigating the mandibular structures, it is vital to include the
teeth to comprehend the occlusal stability and determine the orthodontic tooth
positioning. Masahiro Tsunori, et al. 1998,78 illustrated that the long-face
pattern includes a narrow dental arch mainly because of the narrow mandible,
while short face pattern is wide. Mandibular molars erupt lingually but then
Review of Literature
15
tongue pressure. The dental arch width of the long-faced pattern is smaller
than the short-faced pattern. The molars will be more vertical as the equal
sized tongue exert excess pressure on the molars. The buccal cortical bone of
the short-faced pattern is thicker than the long-face pattern and the bone
inclination is more lingual than the long-faced pattern.
Beckmann et al, 1998,113 performed multiple stepwise regression
analysis to investigate the contribution of alveolar housing measurements,
proportions and their size and basal bone to the lower face height. It was
observed that in long-faced patients, the mandibular midsagittal alveolar bone
in the incisal region has limited anteroposterior dimensions. The shape of the
symphysis and the lower face height may be determined by genetic factors and
thus the shape of the symphysis can give some information for the prediction
of the adult lower face height in growing subjects.
Masumoto et al. 2001,79 provided evidence that the buccal cortical
bone thickness is associated with facial type. A thicker buccal cortical bone is
related with a smaller gonial angle and mandibular plane angle. In relation to
tooth inclination, patients with smaller gonial angle and mandibular plane
angle were found to have more vertically positioned molars. The cortical bone
thickness of the molar sections seemed to be influenced by the masticatory
functions. The mandibular body of the molar region had a structure resistant to
torsional movements. The width of the cortical bone in the buccal-alveolar
Review of Literature
16
cortical and cancellous bone on the buccal side were relatively thicker than the
lingual side.
Sadek et al. 2015,74 There is a statistically significant relationship
between facial type and alveolar height and thickness. Dentoalveolar
compensation mechanism acts in both high-angle and low-angle subjects by
vertical lengthening of the maxillary and mandibular frontal alveolar process.
Measurements of alveolar height in the posterior region in both arches showed
statistically no significant differences. High-angle cases had a thin alveolar
region in the anterior maxilla and almost at all sites in the mandible. With
marked anteroposterior incisor movement in high-angle subjects there seems
to be an increased risk of moving the incisors beyond alveolar bone support.
BUCCAL SHELF AND CORTICAL BONE THICKNESS
Lekholm and Zarb1 2 classified bone quality into 4 types: Type I, II,
III and IV, where Type I is the densest consisting mainly of cortical bone and
Type IV is the least dense bone that is loosely packed trabecular bone with
thin cortical bone.
Brunski 1999,9 in biomechanics, trabecular bone is often modeled as a
cellular solid, or, in other words, a porous version of dense (compact or
cortical) bone. The working hypothesis is that the fully mineralized solid
matrix of bone, regardless of whether this matrix exists in trabecular or
Review of Literature
17
bone, the term “density” by itself is ambiguous, since the mineralized portion
of this type of bone should always have the same density of 1.85 g/mL. To
clear up this ambiguity, researchers developed the concept of apparent density, which is defined as the “mass of bone tissue divided by the bulk volume of the
test specimen, including mineralized bone and marrow spaces”. This
definition accounts for the effects of porosity of trabecular bone, e.g., bone
with a small value of apparent density has a large porosity. Moreover, it has been found that key mechanical properties such as compressive Young’s
modulus and ultimate compressive strength depend on the apparent density
raised to the 3rd and 2nd power, respectively. Apparent density has therefore
become a standard part of the characterization of trabecular bone.
In an evaluation to determine the safe location for microimplants it was
found that the average thickness of the cortical bone at the mandibular first
and second molar region was 2.48 mm and 3.17 mm respectively and the
minimal thickness were 0.71 and 0.93 mm respectively, Park et al. 2002,103
stated that the clinician must examine the relationships between micro-implant
and the adjacent rots carefully.
In a study to quantify the treatment effects of distalization of the
mandibular molars using microscrew implants, Park et al. 2005,104 proved the
success rate and clinical considerations with the use of the microscrew
implants 90%. Miniscrews placed in the mandibular retromolar area provided
Review of Literature
18
moving posterior teeth simultaneously, the treatment time may be shortened
and round tripping of the anterior teeth can be avoided.
On a quantitative evaluation the cortical bone thickness averaged from
1.9 ± 0.6 mm, 2.0 ± 0.6 mm, and 1.9 ± 0.7 mm, mesial and distal to the first molar, and distal to the second molar, respectively at the occlusal level and 1.8 ± 0.5 mm mesial to the first molar and 1.8 ± 0.5 mm distal to the first molar at the apical level. Deguchi 2006,33 concluded that the best available location for a miniscrew is mesial or distal to the first molar, and the best angulation is 30° from the long axis of the tooth.
Motoyoshi, et al. 2007,90 in the cross sections mesial to the first molar,
the average cortical bone thickness ranged from 1.09 to 1.62 mm in the
maxilla and 1.59 to 2.66 mm in the mandible and inclined to increase with
height. In cross sections distal to the first molar, the average cortical bone
thickness ranged from 1.14 to 2.12 mm in the maxilla and 2.10 to 3.03 mm in
the mandible. The cortical bone thickness of the mandible in adolescents was
thinner than in adults at heights of 3–8 mm. No significant difference in
cortical bone thickness was observed in the mandible according to gender.
Thus the morphometric analysis revealed that the cortical bone of the
mandible was significantly thicker than that of the maxilla at any location in
the buccal posterior region, and the mandible suffices as a preparation site for
mini-implants. Bone quality is known to be one of the major factors in the
Review of Literature
19
cortical bone than mandibular third molar region so could show a lower
success rate. Cheol-Hyun Moon 2008.24
Baumgaertel et al. 2009,116 measured the cortical cortical bone
thickness at 2, 4, and 6 mm from the alveolar crest and they found the
mandible had a greater buccal cortical bone thickness than the maxilla. They
inferred that this thickness increase with increasing distance from the alveolar
crest in the mandible and in the maxillary anterior sextant. When the mean
measurements were compared, the maxillary buccal sextants, cortical bone
thickness was thickest at the 6-mm level and thinnest at the 4-mm level. At the
6-mm level in the maxillary anterior sextant, there was an increase in the
thickness progressively (thickest region) with increasing distance to the
alveolar crest. The same trend was observed in the mandibular sextant.
Cortical bone thickness increased in both jaws with increasing distance from
the midsagittal plane except distally to the maxillary second molars, where it
decreased.
Lim et al. 2009,65 regarding mandible cortical bone thickness, there
was no statistically significant difference in the anterior area while a
significant difference was found in the posterior area. The cortical bone
thickness in the mandibular posterior area was significantly greater compared
to that in the maxillary posterior area. In the mandible, cortical bone thickness
showed a gradual increase from the anterior to posterior areas. The maxilla
Review of Literature
20
different thickness. Cortical bone thickness in the mandible was greatest at 4
mm from the alveolar crest.
In the adult mandible, buccal cortex bone thickness and interradicular
space increase from anterior to posterior and from the cervical to the apical
areas. The safest implant site is between the first and second molar; and
placing the implant with an inclination almost parallel to the tooth axis (10 to
degrees) allows for maximum contact with bone cortex and minimum
penetration, Monnerat 2009.87
On determining he optimal sites for mini-implant placement in the
maxilla and the mandible based on dimensional mapping of the interradicular
spaces and cortical bone thickness, Fayed 2010,121 found in the posterior
region of the mandible the highest buccolingual thickness and buccal cortical
thickness were between the first and second molars (13.79 ± 2.03, 3.05 ± 2.22, respectively). The highest mesiodistal distance from the buccal side was found
between the second premolar and the first molar (5.61 ± 1.99), and the highest mesiodistal distance from the lingual side was between the first and second
molar. In comparison between the sexes, the males had significant higher
buccolingual thickness than the females at 2 mm level from the CEJ
posteriorly.
John Lin, 2010,69 stated that the slope of the buccal shelf around the
Review of Literature
21
molar is flatter, which makes it easier for direct mini-screw placement. The
slope around the 3rd molar has the flattest buccal shelf, but usually very
limited zone of attached gingiva. He also stated that in flatter buccal shelf,
with enough attached gingiva, direct self-drilling is possible, but cases steeper
buccal shelf, due to a narrow zone of attached gingiva and steeper cortical
bone surface, flap surgery is often needed. He suggested the following
parameters for placing buccal shelf miniscrew, the distance between the
mesial sites of the upper 1st molar to the one of the lower 1st molar should be
within one lower molar width. An orthognathic or retrognathic CR (Centric
Relation) profile at the beginning of treatment. The patient to have a little
prognathic profile and prefers nonsurgical treatment.
Timock et al. 2011,120 with the invention of 3-dimensional imaging
modality cone-beam CT (CBCT), orthodontist can now envisage and measure
the true 3-dimensional anatomy and quantitatively assess the buccal bone
height and buccal bone thickness with high precision and accuracy. The
reliability and accuracy of measurements of alveolar buccal bone height and
thickness were recorded from CBCT scans of cadaver heads relative to direct
measurements acquired after dissection by using multiple measures of
reliability and agreement. It was proved that CBCT measurements had good
reproducibility, with greater interrater agreement of buccal bone height (0.98)
than for buccal bone thickness (0.90). There were no statistically significant
Review of Literature
22
submillimeter range observed for both buccal bone height and buccal bone
thickness (between -0.77 and 0.81 mm, and between -0.32 and 0.38 mm,
respectively) were at 95% limits of agreement.
Kim, 2012,57 observed that the buccal cortical bone was thicker in men
than in women, but not statistically significant. The lingual cortical bone was
thicker in men than in women, except between left 1st and 2nd molars.
Mandibular lingual cortical bone thickness was the thickest between the 1st
and 2nd premolar region and the thickness gradually decreased posterior to
this region. On the other hand, the mandibular buccal cortical bone thickness
increased between the anterior and posterior regions. There was more than
2 mm of cortical bone in all areas, except between the canine and 1st premolar
on the buccal side of the mandible. The cortical bone on both mandibular
buccal and lingual sides is thick enough for TAD applications.
Placement of a TAD in the mandibular buccal shelf is
technique-sensitive. The mandibular second molar mesiobuccal area is the best location
for placement. At this place, the slope of the buccal shelf is less steep and
often has a better chance of placement into keratinized tissue. Avoiding a
more distal location on the buccal shelf limits the formation of mucosal
inflammation surrounding the TAD head that can lead to failure. The mandible
at this area has a relatively thick and dense cortical bone thickness. Pobanz,
2012,109 showed controlling insertion torque to within 5 and 10 N-cm has been
Review of Literature
23
Orthonia Tad Insertion Driver (RMO) allows for controlled insertion within
this torque range. A force application of 250-450 grams has been shown to be
successful in distalizing mandibular molars as well as the mandibular arch en
masse.
Ozdemir 2013,99 investigated the cortical bone thicknesses of the
maxilla and the mandible alveolar processes from adults with low, normal, and
increased facial heights with cone-beam computed tomography (CBCT)
images. He did a retrospective screening of the consecutive 3-dimensional
CBCT images with the following criteria: no periodontal disease with alveolar
bone loss, age between 20 and 45 years, no facial asymmetries, no cleft lip or
palate, no impacted or missing teeth in the measurement site, no diagnosed
systemic diseases, and no craniofacial dysmorphology. He found that cortical
bone thickness of the jaws is closely related to vertical facial type. His study
confirmed that the cortical bone thickness is low in the high angle case than
average angle and low angle cases.
Cassetta et al. 2013,12 examined the alveolar cortical bone thickness
and density for insertion of temporary anchorage device and also the
differences between age, sex, site and side of implantation using CT. He
measured the cortical bone thickness and density at 2, 4, 6 and 8 mm intervals
apical to the alveolar crest at thirteen interradicular sites form the right 2nd
molar to the left 2nd molar in both maxilla and mandible from the 48
Review of Literature
24
thicker and higher density alveolar cortical bone than females; Adults show a
thicker alveolar cortical bone than adolescents; In the mandible the alveolar
cortical bone is more compact and thicker than in the maxilla; High values of
thickness and density characterize posterior regions of both jaws; The alveolar
oral cortical bone is thicker than the buccal; There is a significant linear
increasing of thickness and density from crest to base of alveolar crest.
It was advocated that contingent on the sites between and within the
jaws, and vertical skeletal pattern the buccal cortical bone thickness fluctuates.
IIKnur Veli et al. 2014,53 evaluated the buccal cortical bone thickness using
cone-beam computed tomography (CBCT) in adolescent subjects with
different vertical skeletal patterns. In the mandible, at heights of 5 and 7 mm
in the canine–first premolar regions, and at 7 mm height from CEJ in the
second premolar–first molar region, there was statistically significant
differences between high-angle and low-angle groups. Significant differences
were also present between the first and second premolars at heights of 7 and 9
mm. Average cortical bone thickness observed ranged from 1.10–1.37 mm in
the maxilla and 1.20–3.28 mm in the mandible for all groups. As the buccal
cortical bone is thinner in high-angle patients, difficulties may be encountered
in achieving primary stability during miniscrew treatment.
Holmes et al. 2015,49 provided a road map of buccal cortical bone
thickness from the proximal surface of two teeth in areas where miniscrews
Review of Literature
25
and 50 mandibular) those were randomly selected from 50 CBCT scans with
the inclusion and exclusion criteria; the entire maxilla and mandible were present in that quadrant’s scan, all teeth were fully erupted, no teeth were
missing or impacted in areas of inspection and no pathology (including
periodontal bone loss) was observed in the areas of inspection. He concluded
that the cortical bone thickness is significantly thinner centrally between two
teeth than the areas adjacent to the roots. Of all the jaw locations studied, the
average thinnest cortical bone was between the mandibular canine and the first
premolar, whereas the thickest cortical bone was measured distal to the
midpoint of the second premolar and first molar.
Chang 2015,17 Miniscrews in the mandibular buccal shelf are
proposed as a reliable source of extra-alveolar anchorage for retracting the
entire mandibular arch to correct severe crowding, protrusion, and skeletal
malocclusion, without extractions or orthognathic surgery. Failure is common
in the posterior mandible, typically occurring in the first few weeks, so
primary stability is the critical factor for clinical success. Attempts to improve
primary stability include smaller diameter pilot holes, sites with increased
cortical bone thickness and density, and a self-drilling protocol. Bone quality
is particularly important for orthodontic miniscrews because they are retained
by mechanical locking rather than osseointegration. The average age of the
121 failure patients was 14 ± 3 years, which is considerably lower than the
Review of Literature
26
were more common among the younger patients who tended to have less
dense cortical bone in the MBS. Regarding side of patient, 78/121 (64.5%) of
the failures were on the left side and 43/121 (35.5%) were on the right. The
121 failed screws involved only 105 patients: 89 patients had single-screw
failure and the other 16 lost screws on both sides. The bilateral failures suggest
a predisposition to failure in a small portion of the patients.
Chen 2015,19 treated scissor bite with 2 x 12 mm miniscrews placed at the mandibular buccal shelves lateral to the second molars as was less invasive
and do not require much patient cooperation as intermaxillary elastics. Miniscrews placed in the buccal shelf is more efficient for molar intrusion than interradicular miniscrews because they are not placed between the roots
of teeth.
Failure of temporary anchorage devices (TADs) is a serious limitation
when treating complex problems like uprighting horizontally impacted
mandibular molars, as there are few other viable options. Chang et al. 2016,16
developed 2 mm diameter stainless steel bone screw for dense cortical
mandibular buccal shelf. This miniscrew is placed lateral to the first and second molars, so it did not interfere with the retromolar location of horizontal
impactions, or the path of tooth movement within the alveolar process. Failure of miniscrews also occurs because of hypertrophied soft tissue coverage over the implants. As commonly the 12 mm screw length is used in the ramal area
Materials and Methods
27
MATERIALS AND METHODS
The present in-vitro study was carried out in the Department of
Orthodontics and Dentofacial Orthopedics, Ragas Dental College and
Hospitals, Chennai.
All the CBCTs taken were from the patients who reported seeking
treatment to the Department of Orthodontics and Dentofacial Orthopedics at
Ragas Dental College and Hospital, Uthandi, Chennai, India, between January
and June 2016.
Inclusion criteria
The CBCTs were taken as a pretreatment record for subjects who was
diagnosed with temporomandibular joint problems, facial asymmetry,
and moderate-to-severe skeletal class III malocclusion with reverse
overjet.
Exclusion criteria
Subjects who had already undergone orthodontic treatment or
undergoing current orthodontic treatment.
Subjects with noticeable periodontal disease.
Materials and Methods
28
Subjects with severely ectopic teeth (such as buccally erupted canines
or premolars).
Subjects with previous history of trauma
Based on the inclusion criteria subjects were majorly classified into
two groups based on their skeletal malocclusion:
o 10 subjects as class I (5 low-angle subjects and 5 high-angle subjects).
o 10 subjects as class III (5 low-angle subjects and 5 high-angle subjects).
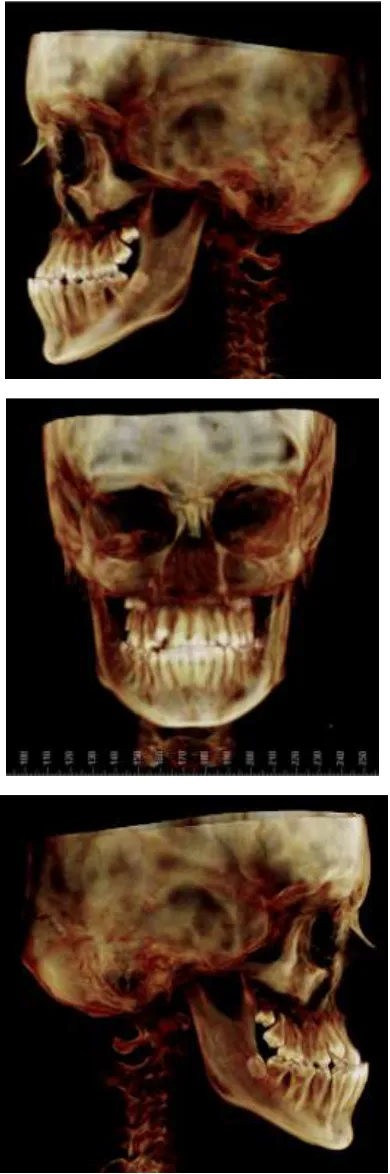
The cone beam computed tomography (Digital Kodak 9500 cone
beam tomography scan, France) images of 20 subjects were analyzed.
Subjects were scanned standing with the head oriented in the natural head
position. For all scans, the minimum field of view used was 11 cm, and scan
time ranged from 8.9 to 20 seconds with a resolution of 0.25 to 0.30 mm.
(Figure 1)
Skeletal malocclusion categories were determined from lateral
cephalograms synthesized from the CBCT scans using the maximum intensity
projection technique. The CBCT-synthesized cephalogram of each subject was
saved as JPEG image and imported into Dolphin imaging software
Materials and Methods
29
Skeletal malocclusion were determined from the following
cephalometric measurements,
Jarabak ratio [the ratio of posterior face height to anterior face
height using the measurements of the distance from sella (S) to
gonion (Go) divided by the distance of nasion (N) to menton
(Me)]. Average value 62% to 65%.
Mandibular plane angle [the angle between the anterior
cranial base (sella to nasion SN) and the mandibular plane
(formed from menton to gonion Me–Go)]. Average value
32° ± 2°.
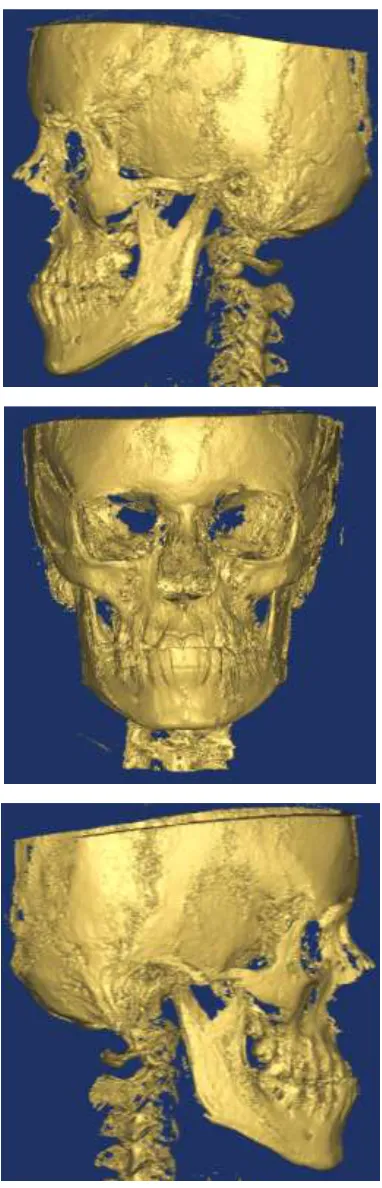
The CBCT images were stored in DICOM format and were analyzed
using Materialise Mimics Care Suite (Version 19.0) 3D software
(Materialize NV, Leuven, Belgium). (Figure 2)
A fully reconstructed three-dimensional image with sagittal, coronal,
and axial planes of the mandible was generated and the following
Materials and Methods
30
Reference Planes
All the 3D CBCT slices selected for measurements were aligned
perpendicular to the sagittal plane (Figure 3). In the sagittal view the
axial plane was aligned at the mean mandibular alveolar crest level.
In the axial view the sagittal plane was aligned by bisecting the
mandibular first and second molars symmetrically. An additional
sagittal reference plane was aligned at the linguala at the opening of
mandibular foremen perpendicular to the axial plane and in parallel
with the present sagittal plane. (Figure 4)
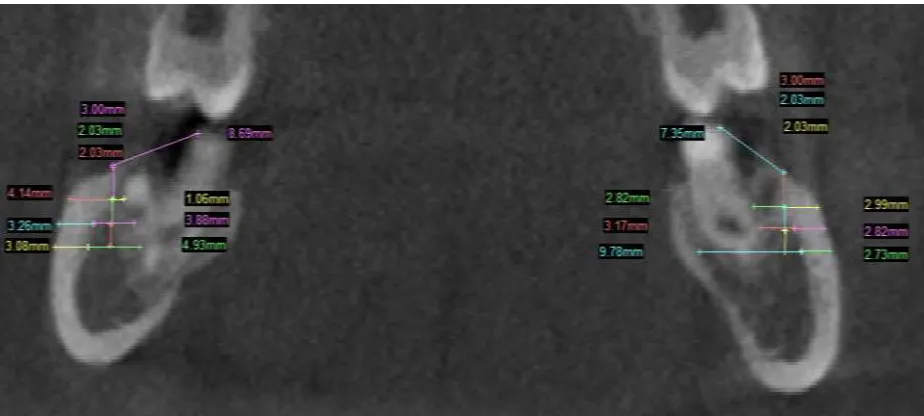
Measurements were performed on slices in the frontal plane below the
alveolar crest level. (Figure 5)
The axial reference plane aligned along the mean mandibular alveolar
crest level on the frontal view is correlated to be parallel with the
transverse/horizontal hinge axis (an imaginary line around which the
mandible may rotate within the sagittal plane).
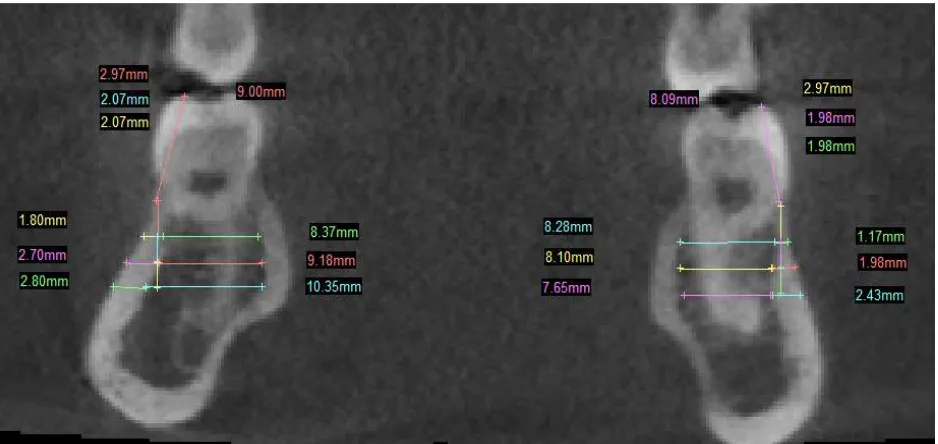
The planes selected for cortical and cancellous bone measurements
from the mandibular first molar to second molar region were:
Mesial of mandibular first molar (6M), (Figure 6).
Middle of the crown through the furcation area of the mandibular first
Materials and Methods
31
Interradicular bone/interdental region between the mandibular first and
second molars (6-7IR), (Figure 8).
Middle of the crown through the furcation area of the mandibular
second molar (7Middle), (Figure 9).
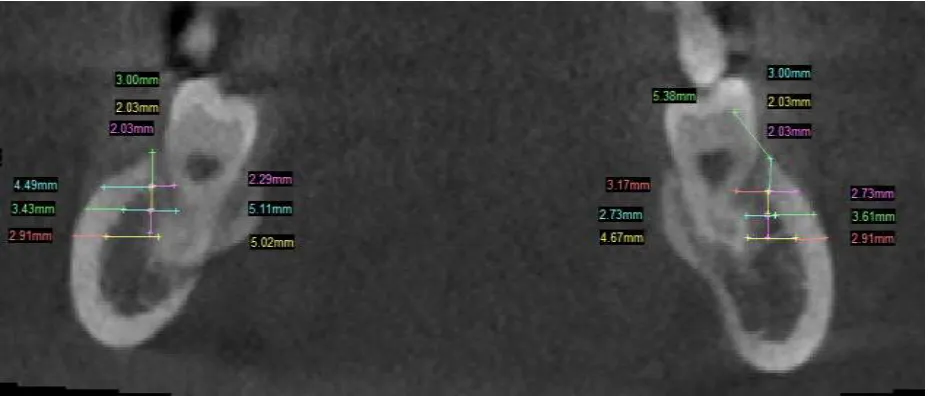
Distal of the mandibular second molar (7D) (Figure 10).
The cortical and cancellous bone thickness was measured
perpendicular along the surface of the mandibular buccal shelf at 3 mm, 5 mm
Materials and Methods
32
STATISTICAL ANALYSIS
The following statistical procedures were carried out:-
1. Data compilation and presentation
2. Statistical analyses
I. Data compilation and presentation:
Data obtained were compiled systematically in Microsoft Excel spread
sheet. The dataset was subdivided and distributed meaningfully and presented
as graphs and tables.
II. Statistical analyses:
Statistical analyses were performed using Statistical Package for Social
Sciences software (SPSS version 19, USA). Data comparison was done by
applying specific statistical tests to find out the statistical significance of the
obtained results. Depending upon the nature of the data, the statistical tests
were chosen. p value of 0.05 was considered to be significant.
Normality was checked using Shapiro-Wilk test. All the data were
found to not normal in distribution. Hence, non-parametric test was used. All
the inter group comparison was done using Mann-Whitney U test (two
Materials and Methods
33
Intergroup comparison between the 5 different mandibular sites was
done using Kruskal-Wallis test. All the significant values were taken and
Bonferroni correction was done to individually calculate the significance
Class III Class I
Left Right
Mesial of 1st molar
Middle of 1st molar
Interdental area of 1st and 2nd
molar
Middle of 2nd molar
Distal of 2nd molar 3 mm
Cortical
Cancellous
5 mm Cortical
Cancellous
7 mm Cortical
Cancellous
3 mm
5 mm
7 mm
Cortical
Cancellous
Cortical
Cancellous
Cortical
Cancellous Low
Angle
High Angle
Low Angle
High Angle
Left Right
Figures
Figures
Figures
FIGURE 3: – SAGITAL VEIW CBCT SLICE
FIGURE 4: – CORONAL VEIW CBCT SLICE
Figures
[image:49.595.73.533.228.470.2]
FIGURE 6: MESIAL OF MANDIBULAR FIRST MOLAR
Figures
FIGURE 7: MIDDLE OF MANDIBULAR FIRST MOLAR
Figures
Figures
FIGURE 9: MIDDLE OF MANDIBULAR SECOND MOLAR
Figures
[image:53.595.70.532.222.430.2]
FIGURE 10: DISTAL OF MANDIBULAR SECOND MOLAR
Results
34
RESULTS
This in-vitro study was performed to evaluate the thickness of cortical and cancellous bone present in the mandibular buccal shelf region in skeletal
class I and class III malocclusion individuals using bone mapping - a cone
beam computed tomography study. The results are based on the bone mapping
done on 20 CBCTs which were divided into two experimental groups; Class I,
(N = 10, low angle = 5 and high angle = 5) and Class III, (N = 10, low angle =
5 and high angle = 5) in the age range of 20 years ± 5 years.
All the CBCTs were obtained from the patients who reported seeking
treatment to the Department of Orthodontics and Dentofacial Orthopedics at
Ragas Dental College and Hospital, Uthandi, Chennai, India, between January
and June 2016.
Descriptive statistics was carried out to statistically to determine the
cortical and cancellous bone thickness in the study group,
The results are discussed under the following headings:
1. Comparison of cortical and cancellous bone thickness in class I
subjects between low and high angle cases at various mandibular
sites.
2. Comparison of cortical and cancellous bone thickness in class III
subjects between low and high angle cases at various mandibular
Results
35
3. Comparison of cortical and cancellous bone thickness between
class I and class III low and high angle subjects at various
mandibular sites.
4. Comparison of cortical and cancellous bone thickness in class I
and class III subjects between the right and left side of the
mandibular arch at various sites.
5. Comparison of cortical and cancellous bone thickness at 5
different mandibular sites in Class I and Class III low and high
angle subjects.
COMPARISON OF CORTICAL AND CANCELLOUS BONE
THICKNESS IN CLASS I SUBJECTS BETWEEN LOW AND HIGH
ANGLE CASES AT VARIOUS MANDIBULAR SITES
The non-parametric Mann Whitney test was done to determine bone
thickness in the class I low and high angle cases.
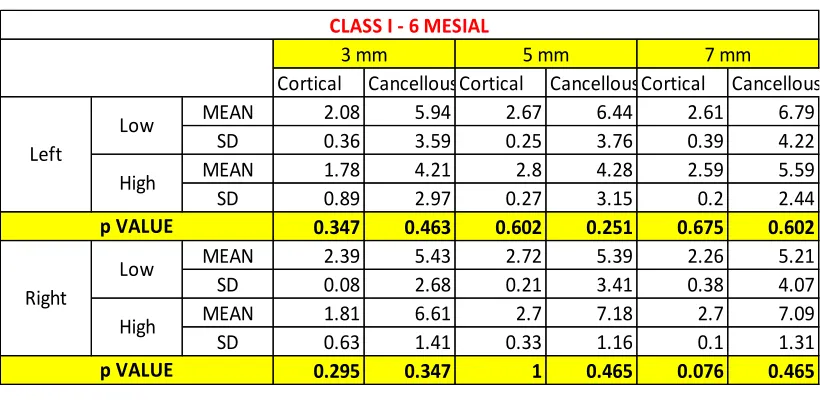
Table 1 shows mean mandibular cortical and cancellous bone
thickness and their standard deviation measurements at 3 mm, 5 mm and 7
mm level from the alveolar crest at the mesial of mandibular first molar in low
and high angle class I subjects bilaterally.
The mean mandibular cortical and cancellous bone thickness
measurements at 3 mm, 5 mm and 7 mm level at the mesial of mandibular first
molar in the low and high angle class I subjects bilaterally are statistically not
Results
36
Table 2 shows mean mandibular cortical and cancellous bone
thickness and their standard deviation measurements at 3 mm, 5 mm and 7
mm level from the alveolar crest at the middle of mandibular first molar in low
and high angle class I subjects bilaterally.
The mean mandibular cortical and cancellous bone thickness
measurements at 3 mm, 5 mm and 7 mm level at the middle of mandibular
first molar in the low and high angle class I subjects bilaterally are statistically
not significant (p> 0.05).
Table 3 shows mean mandibular cortical and cancellous bone
thickness and their standard deviation measurements at 3 mm, 5 mm and 7
mm level from the alveolar crest at the interdental region of mandibular first
and second molar in low and high angle class I subjects bilaterally.
The mean mandibular cortical and cancellous bone thickness
measurements at 3 mm, 5 mm and 7 mm level at the interdental region of
mandibular first and second molar in the low and high angle class I subjects
bilaterally are statistically not significant (p> 0.05).
Table 4 shows mean mandibular cortical and cancellous bone
thickness and their standard deviation measurements at 3 mm, 5 mm and 7
mm level from the alveolar crest at the middle of mandibular second molar in
Results
37
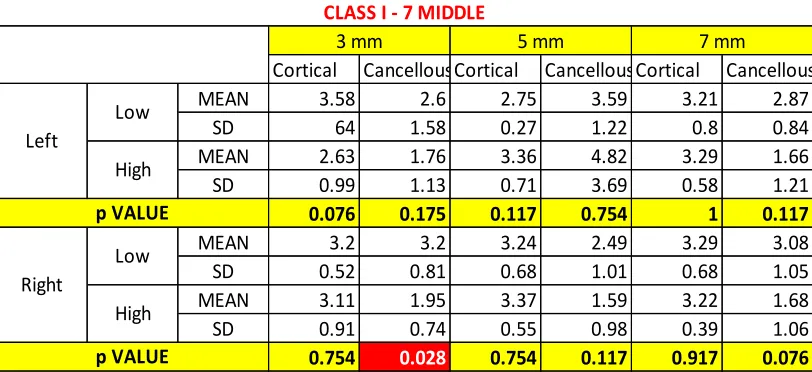
The mean mandibular cortical and cancellous bone thickness
measurements at 3 mm, 5 mm and 7 mm level at the middle of mandibular
second molar in the low and high angle class I subjects bilaterally are
statistically significant only in right cancellous region at the 3 mm level with
a p value of 0.028 (p <0.05).
Table 5 shows mean mandibular cortical and cancellous bone
thickness and their standard deviation measurements at 3 mm, 5 mm and 7
mm level from the alveolar crest at the distal of mandibular second molar in
low and high angle class I subjects bilaterally.
The mean mandibular cortical and cancellous bone thickness
measurements at 3 mm, 5 mm and 7 mm level at the distal of mandibular
second molar in the low and high angle class I subjects bilaterally are
statistically significant only at the right cortical region at the 3 mm and 5
mm level with a p values of 0.009 and 0.047 (p <0.05) respectively.
COMPARISON OF CORTICAL AND CANCELLOUS BONE
THICKNESS IN CLASS III SUBJECTS BETWEEN LOW AND HIGH
ANGLE CASES AT VARIOUS MANDIBULAR SITES
The non-parametric Mann Whitney test was done to determine bone
thickness in the class III low and high angle cases.
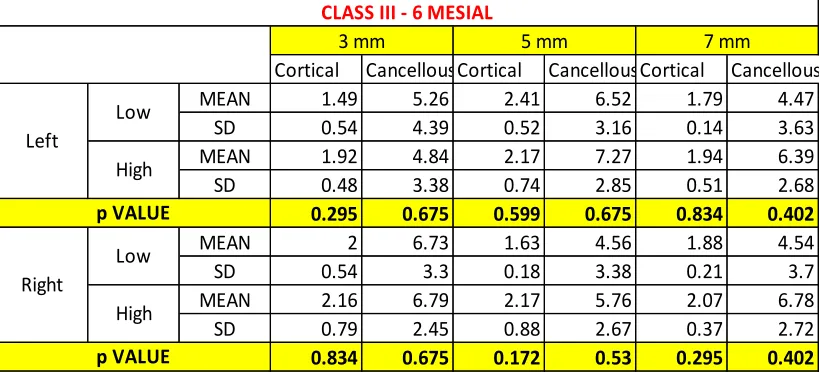
Table 6 shows mean mandibular cortical and cancellous bone
Results
38
mm level from the alveolar crest at the mesial of mandibular first molar in low
and high angle class III subjects bilaterally.
The mean mandibular cortical and cancellous bone thickness
measurements at 3 mm, 5 mm and 7 mm level at the mesial of mandibular first
molar in the low and high angle class III subjects bilaterally are statistically
not significant (p> 0.05).
Table 7 shows mean mandibular cortical and cancellous bone
thickness and their standard deviation measurements at 3 mm, 5 mm and 7
mm level from the alveolar crest at the middle of mandibular first molar in low
and high angle class III subjects bilaterally.
The mean mandibular cortical and cancellous bone thickness
measurements at 3 mm, 5 mm and 7 mm level at the middle of mandibular
first molar in the low and high angle class III subjects bilaterally are
statistically significant only in the right cancellous region at the 7 mm level
with a p value of 0.044 (p <0.05).
Table 8 shows mean mandibular cortical and cancellous bone
thickness and their standard deviation measurements at 3 mm, 5 mm and 7
mm level from the alveolar crest at the interdental region of mandibular first
and second molar in low and high angle class III subjects bilaterally.
The mean mandibular cortical and cancellous bone thickness
Results
39
mandibular first and second molar in low and high angle class III subjects
bilaterally are statistically significant in the bilateral cortical regions at 3
mm, 5 mm and 7 mm level with a p value of 0.009 (0.028 on the right7 mm
level) (p <0.05) and in the cancellous regions at the right side 5 mm level
and bilateral 7 mm level with a p value of 0.009 (p <0.05).
Table 9 shows mean mandibular cortical and cancellous bone
thickness and their standard deviation measurements at 3 mm, 5 mm and 7
mm level from the alveolar crest at the middle of mandibular second molar in
low and high angle class III subjects bilaterally.
The mean mandibular cortical and cancellous bone thickness
measurements at the 3 mm, 5 mm and 7 mm level at the middle of mandibular
second molar in the low and high angle class III subjects bilaterally are
statistically significant only in the left cancellous region at the 7 mm level
with a p value of 0.016 (p <0.05).
Table 10 shows mean mandibular cortical and cancellous bone
thickness and their standard deviation measurements at 3 mm, 5 mm and 7
mm level from the alveolar crest at the distal of mandibular second molar in
low and high angle class III subjects bilaterally.
The mean mandibular cortical and cancellous bone thickness
measurements at 3mm, 5 mm and 7 mm level at the distal of mandibular
Results
40
statistically significant only in the right cortical region at the 7 mm level
with a p value of 0.036 (p <0.05).
COMPARISON OF CORTICAL AND CANCELLOUS BONE
THICKNESS BETWEEN CLASS I AND CLASS III LOW AND HIGH
ANGLE SUBJECTS AT VARIOUS MANDIBULAR SITES
The non-parametric Mann Whitney test was done to determine bone
thickness in the class I and III low and high angle cases.
Table 11 shows mean mandibular cortical and cancellous bone
thickness and their standard deviation measurements at 3 mm, 5 mm and 7
mm level from the alveolar crest at the mesial of mandibular first molar in the
low angle class I and class III subjects bilaterally.
The mean mandibular cortical and cancellous bone thickness
measurement at 3 mm, 5 mm and 7 mm level at the mesial of mandibular first
molar in low angle class I and III subjects bilaterally are statistically
significant only in the left cortical region at the 3 mm and 7 mm level with a
p value of 0.047 and 0.009 (p <0.05) respectively and right cortical region at
the 5 mm level with a p value of 0.009 (p <0.05).
Table 12 shows mean mandibular cortical and cancellous bone
thickness and their standard deviation measurements at 3 mm, 5 mm and 7
mm level from the alveolar crest at the mesial of mandibular first molar in the
Results
41
The mean mandibular cortical and cancellous bone thickness
measurement at the 3mm, 5 mm and 7 mm level at the mesial of mandibular
first molar in high angle class I and III subjects bilaterally are statistically
significant only in the right cortical region at the 7 mm level with a p value
of 0.009 (p <0.05).
Table 13 shows mean mandibular cortical and cancellous bone
thickness and their standard deviation measurements at 3 mm, 5 mm and 7
mm level from the alveolar crest at the middle of mandibular first molar in the
low angle class I and class III subjects bilaterally.
The mean mandibular cortical and cancellous bone thickness
measurements at 3 mm, 5 mm and 7 mm level at the middle of mandibular
first molar in low angle class I and class III subjects bilaterally are statistically
not significant (p> 0.05).
Table 14 shows mean mandibular cortical and cancellous bone
thickness and their standard deviation measurements at 3 mm, 5 mm and 7
mm level from the alveolar crest at the middle of mandibular first molar in the
high angle class I and class III subjects bilaterally.
The mean mandibular cortical and cancellous bone thickness
measurements at 3 mm, 5 mm and 7 mm level at the middle of mandibular
first molar in high angle class I and class III subjects bilaterally are
Results
42
Table 15 shows mean mandibular cortical and cancellous bone
thickness and their standard deviation measurements at 3 mm, 5 mm and 7
mm level from the alveolar crest at the interdental region of mandibular first
and second molar in the low angle class I and class III subjects bilaterally.
The mean mandibular cortical and cancellous bone thickness
measurements at 3 mm, 5 mm and 7 mm level at the interdental region of
mandibular first and second molar in low angle class I and class III subjects
bilaterally are statistically significant only in the right cancellous region at
the 5 mm level and bilaterally at 7 mm level with a p value of 0.009
(p> 0.05).
Table 16 shows mean mandibular cortical and cancellous bone
thickness and their standard deviation measurements at 3 mm, 5 mm and 7
mm level from the alveolar crest at the interdental region of mandibular first
and second molar in the high angle class I and class III subjects bilaterally.
The mean mandibular cortical and cancellous bone thickness
measurements at 3 mm, 5 mm and 7 mm level at the interdental region of
mandibular first and second molar in high angle class I and class III subjects
bilaterally are statistically significant only in the cortical regions at all levels
with a p value of 0.009 (p> 0.05) and in the right cancellous region at 3 mm
level with a p value of 0.28 (p <0.05).
Table 17 shows mean mandibular cortical and cancellous bone
Results
43
mm level from the alveolar crest at the middle of mandibular second molar in
the low angle class I and class III subjects bilaterally.
The mean mandibular cortical and cancellous bone thickness
measurements at 3 mm, 5 mm and 7 mm level at the middle of mandibular
second molar in low angle class I and class III subjects bilaterally are
statistically not significant (p> 0.05).
Table 18 shows mean mandibular cortical and cancellous bone
thickness and their standard deviation measurements at 3 mm, 5 mm