Research Report DCSF-RR015
School Federations Pilot
Study 2003-2007
Geoff Lindsay
1
, Daniel Muijs
2
, Alma Harris
1
,
Chris Chapman
2
, Elisabeth Arweck
1
and
Janet Goodall
1
1
University of Warwick
School Federations Pilot
Study 2003-2007
Geoff Lindsay
1,
Daniel Muijs
2, Alma Harris
1,
Chris Chapman
2, Elisabeth Arweck
1and Janet Goodall
11
University of Warwick
2University of Manchester
The views expressed in this report are the authors’ and do not necessarily reflect those of the Department for Children, Schools and Families.
© University of Warwick 2007 ISBN 978 1 84775 067 9
Contents
Executive Summary 5
1. Introduction 11
2. Methodology 14
3. Aims and achievements of federations 17
4. Case Studies 39
5. Discussion 62
6. Conclusions and recommendations 71
References 76
Executive Summary
Introduction
The Government has supported a number of institutions to develop collaborative working between schools as one means of effecting system change and improving standards. The development of federations of schools was central to the ‘Transforming Secondary Education’ agenda. The Education Act 2002 Section 21 sets out the power for governing bodies to federate. The Department for Children, Schools and Families (DCSF), previously part of the Department for Education and Skills (DfES) during the period of this study1 has
defined federations in two ways;
• The definition as invoked in the 2002 Education Act which allows for the creation of a single governing body or a joint governing body committee across two or more schools.
• A group of schools with a formal (i.e. written) agreement to work together to raise standards, promote inclusion, find new ways of approaching teaching and learning and build capacity between schools in a coherent manner. This will be brought about in part through structural changes in leadership and management, in many instances through making use of the joint governance arrangements invoked in the 2002 Act. (www.standards.dfes.gov.uk/federations/what_are_federations)
This report presents the outcome of an evaluation of the Federation Programme funded by the DCSF for 2003-07. Thirty seven federations were funded to a total cost of £16 million on the basis of bids setting out the plan of their federation. The main evaluation took place between April 2004 and September 2006, with further analyses of key stage attainment data from 2006 taking place during February-March 2007.
Methodology
The evaluation comprised three strands;
Case studies
Ten federations were selected to represent the range of models within the project. They included federations where a successful school federated with one or more schools having difficulties and federations comprising schools seeking to address common issues in order to produce enhanced opportunities and standards across the federation. All federations sought to improve standards and several also had a major focus on increasing inclusion; this was a primary focus for one federation. Size (2-26 schools), location (urban, rural) and level of social disadvantage were all taken into account.
Case study federations were visited over three phases. Interviews were held with the federation director, headteacher, teachers, chairs of governors (of governor representatives) and pupils. Local authority (LA) officers and representatives of external agencies were also interviewed where appropriate. Documentary analysis was also carried out, which included Ofsted reports, school improvement plans and policy statements. Meetings of governing bodies and joint committees were observed.
1 In June 2007 there was change in the machinery of Government in which the then DfES was split to
Two case studies, both of the successful school paired with a school in difficulties type, declined to continue after phases 1 and 2 respectively. In each case the federations claimed they were unable to give the time necessary. This was very unfortunate as these federations were consequently not included in the study at all, so limiting the case study evidence available to a single federation of this type rather than the planned three. Conclusions regarding this model must therefore be treated with caution. An 11th federation
was added, resulting in a total of nine in the final sample.
Surveys
The 27 federations not included in the case studies were surveyed using postal questionnaires. Survey 1 (October 2004) comprised separate questionnaires to the headteacher/principal, a head of year/Key Stage, chair of governors and federation director. A total of 444 questionnaires were distributed, 249 were returned (response rate 56.1%).
Survey 2 (May 2006) was sent to headteachers, chairs of governors (n = 148 in each group); response rates were 38% governors and 71% headteachers.
Analysis of datasets
The third strand was a comparison of project schools, compared with non-programme schools in the national dataset on attainment at GCSE and at Key Stage 2 and 3 national curriculum assessments, and with respect to authorised and non-authorised absences.
Main findings
• This Federations Programme provided an overarching structure that has promoted shared understanding of the possibilities for restructuring and revising important cultural aspects of the education system. The support of different types of federation within the programme allowed schools to explore different purposes, foci and degrees of
collaboration pertinent to their particular needs and priorities.
• A particular strength of the programme has been its ‘tight/loose’ nature which has stimulated and supported localised change focussed on issues and concerns that have emerged from within the community concerned, in the context of a national initiative with specific parameters and accountability systems.
• Federations had a variety of goals but almost all sought to improve standards and half sought to improve inclusion as their main goal(s).
• Many different approaches were adopted to achieve the goals. These grew out of determination of priorities and were frequently based on previous collaborative work between schools that formed the federation.
• Federations can be categorised along a 4-stage continuum of decreasing ‘hardness’ of changes to governance:
o Statutory: hard governance federation o Statutory: soft governance federation o Non-statutory, soft federation
o Non-statutory informal, loose collaboration
governance; there was also development from softer to harder federations in some of the case studies, but not others.
• Federations generally placed a high premium on respecting and maintaining each school’s autonomy. Changes to governance were generally limited to what was necessary to achieve specific objectives, although chairs of governors in particular were frequently very involved and supportive. Otherwise, federation matters were part of general governing body business.
• Changes to governance followed decisions on practice, they were not drivers for change.
• Barriers to success included the lack of a clear legal status of the federation director; tensions arising from imbalance of power in the successful school-weaker school model; and uncertainty about sustainability arising from the cessation of financial support at the end of the programme.
• The key factors identified as important for success of federations were leadership and collegiality. Federation directors and headteachers, together with chairs of governors in a number of cases, were the key personnel to provide leadership.
• The characteristics of effective leadership of federations were similar to those found in studies of effective schools and included: building upon past collaborations and good relationships; having clear aims and objectives for federating; developing collegiality, trust and effective communications; and adapting to the style of leadership required in the context of the federation.
• Most federations agreed a system of pooling an element of the schools’ budgets, or only used the project grant. Development of greater levels of joining budgets, and especially of a single pooled budget were rarer and linked to ‘harder’ federations. Again, this trait reflected necessity for fitness for purpose.
Detailed findings
Plans and expectations
• Nine out of ten headteachers specified raising standards as a main goal.
• Over half of headteachers also specified inclusion as a main goal.
• Federations had a broad focus with about a quarter of heads targeting pupils with SEN, low achieving pupils, high achieving pupils and gifted and talented (range 22-28% of headteachers).
• Four out of five chairs of governors were involved in the decision to federate.
• About 80-90% of headteachers predicted federations would improve attitudes to learning and pupil behaviour, reduce exclusion, broaden pupil entitlement and improve primary/secondary and secondary/post-16 transition.
Outcomes
• Both headteachers (93%) and chairs of governors (85%), judged the federation to have been somewhat or very successful in raising achievement, although only about a quarter in each case rated this very successful.
schools and a significantly higher contextual value added outcome (1004.8 compared with 1000.8).
• There was no consistent pattern between schools in the Federation Programme and non-programme schools with respect to absence.
• Headteachers judged their federations somewhat or very successful in reaching goals in inclusion (91%), and Gifted and Talented education (76%), improving attitude to teaching (82%) and behaviour (68%), reducing exclusions (60%), and broadening pupil entitlement (90%).
• Improving transition from primary to secondary school and from secondary to post-16 was a goal for only three quarters of schools, but in each case about three quarters concluded this had been reached successfully.
Processes
• Schools generally took very seriously the need to develop collegiality and to do this from a basis of schools being regarded as autonomous partners.
• Where the nature of the federation involved imbalance of power, as in the successful school-weaker school model, the development of trust was also important but was more difficult and took longer to achieve.
• High quality leadership was regarded and valued by federations and was central to their successful operation. Successful leadership was characterised by a strong sense of commitment to collegiality and schools’ autonomy, with democratic and facilitative styles predominating.
• Leaders had a strong sense of purpose regarding the development of teachers’ and pupils’ standards. Where inclusion was also a key factor, leadership was also characterised by a deep and sustained commitment to the right of all children to inclusive education, together with a non-ideological practical and pragmatic approach seeking evolutionary change that got teachers, pupils and parents on side.
• The specific nature of the leadership role and title was less important: titles varied as did the nature of the formal or informal contract.
• The lack of a clear legal status of federation directors was a concern throughout the project.
• Models of distributive leadership developed within schools did not apply so clearly to federations where leadership was often collaborative, a team of acknowledged equals.
• Chairs of governors often contributed to the setting up of the federation and supported its work, but generally at a distance. Unless the federation was statutory, governing bodies were involved to a relatively limited degree – it was part of the general business.
• Models of governance were linked to finance. The extent to which schools pooled finance, from sharing the federation grant only, through a form of top-slicing to a joint budget, was related to the continuum from hard statutory to informal collaborative models of federation. The harder the federation the greater the degree of budget pooling and hence the lower the level of financial autonomy for constituent schools.
• Every Child Matters and Inclusion were the two major Government initiatives that impacted on the federations. There was relatively little interest in or engagement with the idea of Trust schools until the end of the project. This may reflect its recency or the experience of federations where governance change were not seen as a central factor.
Sustainability
• Six out of ten headteachers considered that their federation would definitely (39%) or most likely (23%) continue beyond the DCSF funding.
• Sustainability was a function of the nature of the federation. Where joint decision-making regarding budgets had been established and where the federation was committed to longer term activities, sustainability was enhanced.
be facilitated either by collegial practice or as a result of specific changes in governance and decisions to pool budgets. Sustainability was therefore also linked to decisions of the necessity to maintain the federation: where there was little choice because of the creation of a harder form of federation, sustainability had to be addressed and built in. Where softer forms existed schools could choose whether to maintain the federation with reference to new priorities.
• The study indicates that given the opportunity, schools will generally seek to develop collegial practice where autonomous schools collaborate for locally determined purposes. Where schools seek to make fundamental changes to their operation, whether out of choice or external pressure, changes to and greater involvement of governance may be necessary and inevitable.
• The evidence on the successful school-weaker school model suggests that if such a federation is to be successful careful attention must be paid to developing a shared set of values and common understanding of the nature and purposes of the collaboration. Establishing the conditions for the collaboration is an important precursor to the implementation of appropriate school improvement processes within this challenging and complex context. Where both the conditions have been set and an appropriate set of strategies implemented there was evidence to suggest that (if desired) the relationship could be sustained in the long-term.
Conclusions and recommendations
Over the period of this project, Government policy has developed to provide schools with a broader range of collaborative models to choose from. This has been accompanied by an increasing emphasis on the importance of schools being able to build strong sustainable, relationships with external partners. The stated aim of Government policy is to ensure that schools are better able to adopt a model which is appropriate to their needs, which supports their efforts to raise standards and which provides high quality services to their communities.
One of several significant developments has been the introduction of Trust schools. The Education and Inspections Act 2006 enables all schools to become Trust schools by forming links with ‘external partners’ able, if the school chooses, to appoint the majority of the governing body. Some schools may use this new status to formalise existing partnerships whilst others may take the opportunity to establish relationships with new external partners. The fostering of innovative practices derived from the private sector could provide yet another potential incentive, but the chance to work with external partners may remain a key factor.
Another significant development has been the introduction of Education Improvement Partnerships (EIPs). These are capable of providing schools with an overarching structure for their various collaborative arrangements which can bring new opportunities to work other education providers whilst rationalising the growing number of smaller partnerships.
Our study has revealed the benefits of schools working together for common purposes, particularly to raise standards and increase inclusion. We have identified those aspects of federation that facilitate this process.
examples of collaboration, however, would indicate that some forms of partnership do not necessarily need to be supported by changes to existing governance arrangements.
The Federations Programme has provided a tight/loose model for change which has the potential to make a significant contribution to the re-structuring and re-culturing of the education system. A particular strength of the programme was the overarching framework which had the ability to foster structural change in a range of settings combined with the flexibility to support schools and their communities to engage in the re-culturing of their locality. In short, the federation policy offers a welcome blend of co-constructed educational reform.
On the basis of our study we recommend:
1. The DCSF should continue to support schools that seek to improve standards by joint activity, recognising a continuum of possible types of federation, namely:
1. Statutory: hard governance federation 2. Statutory: soft governance federation, 3. Non-statutory, soft federation and
4. Non-statutory informal, loose collaboration.
2. There is benefit in supporting the development of this range of types, determined locally to meet locally identified needs but within a national framework of priorities. This ‘loose/tight’ approach has the potential for both restructuring and reculturing the education system and should be explicitly supported by the DCSF.
3. The further development of federations will require consideration of the legal status of various models developed to date and of the federation director; of the appropriate means of inspection by Ofsted; and of the appropriate recording and analysing of school/federation level data as well as other systems designed for single schools, including school budget formulae.
4. If the DCSF seeks to address the shortage of school leaders by reducing the numbers needed by creating federations of schools under an executive headteacher/director, a more directive strategy will be necessary. Given the choice, schools value autonomy, collegiality and equality, working together as separate schools that have chosen to collaborate.
5. The DCSF should support the development of federations which have a primary goal of increasing inclusion and undertake a detailed study of initiatives such as those examined in the present study.
1. Introduction
1.1 The present study
The Government has supported the development of collaborative working between schools. A number of initiatives have been introduced recently with different characteristics but all have had at their heart a premise that collaboration between schools can lead to an improvement in standards and also one or more other policy outcomes, for example greater inclusion.
The present report describes a study between 2004-2007 of the Federation Programme funded by the Department for Children, Schools and Families (DCSF)2 in 37 federations with
an initial budget of about £16 million.
1.2 Background
It is clear that new organisational forms of schooling are required for system transformation and sustainable improvement to occur. In his writing, Michael Fullan (2004:16) argues that changing whole systems means changing the entire context in which people work and it is clear that the current context of schooling is rapidly shifting. Most recently, England has been leading the way in developing networks of schools in the form of partnerships, federations and Network Learning Communities as an integral part of the drive to improve standards. This development has been aimed at relocating innovation closer to schools in order to generate greater collective capacity for change.
In the past, schools tended to work in relative isolation with relatively few links to schools other than their nearest primary or secondary schools. While this way of working might have been appropriate a decade or so ago in the current climate of rapid and technological change there is a need for collective knowledge creation and information sharing at both the school and system level. There is ample evidence from both the public and private sector that school to school networks and partnerships are a powerful means of achieving such knowledge creation and sharing (Sullivan and Skelcher, 2003; Church et al, 2002). Also evidence shows that such networks and partnerships provide particularly powerful mechanisms of self-renewal during periods of extensive change (OECD, 2000).
The OECD research (2000) shows that creating collaborative structures around schools is more likely to result in deeper organizational learning both collectively and individually. This work shows that school networks are locations in which specialised knowledge can be created and transferred within collaborative contexts. Senge (1990) emphasises collaborative learning and team skills as being the key to successful and sustainable organizational development rather than individual skills and individual learning. His work suggests that networks of schools do not just facilitate innovation but the evidence would suggest that they offer the possibility of new ways of working. It has been shown that they offer the potential for redesigning local systems and structures by promoting different forms of collaboration, linkages, and multi-functional partnerships (Senge et al, 2000). Consequently, school networks are increasingly being seen as a means of facilitating innovation and change as well as contributing to large-scale reform (Hopkins, 2001; Demos, 2001, OECD, 2000).
The DfES document ‘Education Improvement Partnerships - local collaboration for school improvement and better service delivery’ underscores the shift towards partnership and
collaboration as a means of transforming education. It proposes that ‘confident schools want to collaborate with others in the community to drive a shared agenda for improving standards’. The document continues ‘there will be greater freedom to fashion what works locally rather than a requirement to collaborate on a range of separate defined models of national partnership’.(DfES, 2005:3).This reinforces the fact that school to school collaboration is now an important part of educational policy and practice in England.
1.2.1 Federations
Collaboration in the form of federations remains central to the Government’s ‘Transforming Secondary Education’ agenda. Within this agenda, diversity and collaboration are the two main driving forces for raising standards and improving teaching and learning. Federations are viewed as an innovative strategy for transforming education across groups of schools that are working together - sharing staffing, resources, professional development, curriculum development, leadership and management. Federations offer schools the opportunity to look at how best to develop Specialist, Leading Edge, training and Extended Schools within and across federations. It is also argued that a federation can extend curriculum opportunities for young people at 14-19 level and promote inclusion in the broadest sense. Each federation is configured to meet local conditions and can therefore be responsive to the particular educational challenges its community faces.
In terms of definition, the term ‘federation’ has been broadly interpreted and applied. It has been used to describe many different types of collaborative groups, partnerships and clusters, even through to mergers and the creation of new schools. Within this evaluation, federations were defined by the DCSF in two ways:
• The definition as invoked in the 2002 Education Act which allows for the creation of a single governing body or a joint governing body committee across two or more schools from September 2003 onwards.
• A group of schools with a formal (i.e. written) agreement to work together to raise standards, promote inclusion, find new ways of approaching teaching and learning and build capacity between schools in a coherent manner. This will be brought about in part through structural changes in leadership and management, in many instances through making use of the joint governance arrangements invoked in the 2002 Education Act.
The former have been termed “hard” federations as they are tightly coupled and sit at the more formal end of the spectrum of collaborative arrangements. Across all types of federations, whether hard or soft, it is generally recognized that there is a need for high levels of trust, co-operation and confidence. Consequently, while the Government has been keen to promote all forms of school to school collaboration it is arguable that groups of schools need to take a measured and staged approach to partnership to guarantee impact and success. A more refined typology of collaborative arrangements, including federations, is examined in this study.
1.2.2 School improvement
under-theorised. It did not represent a systematic, programmatic and coherent approach to school change. There was also an emphasis upon organisational change, school self-evaluation and the ‘ownership of change’ by individual schools and teachers. However these early school improvement initiatives were not strongly connected to student learning outcomes.
The second phase of development began in the early 1990s. In this phase, the school improvement tradition was beginning to provide schools with guidelines and strategies for implementing classroom level change. There was a greater focus upon organisational and classroom change reflected in approaches to staff development premised upon models of teaching. A desire to link school improvement to student learning outcomes was the main goal during this phase, which was pursued with varying degrees of intensity and success. In the last five years a third phase of school improvement has emerged. Reynolds and Hopkins (2001) suggest that in this phase there has been the creation of more collaborative patterns of innovation and change in schools. Emerging from these various patterns of collaboration has been the establishment of school networks and networking as an effective school improvement strategy.
It is clear that networks or federations are not a new idea as various forms of school to school collaboration have always existed. However, the extent of current networking activity within the school sector is unprecedented and the contemporary evidence would suggest that this investment is offering some educational return (Sammons et al., 2006). Where schools are in networks there is evidence that they are able to raise their collective performance through greater degrees of flexibility and adaptability (NCSL, 2001). The evidence shows that they are also more adept at knowledge creation and knowledge management (Castells, 2003). It is argued that this position is maximized within a diverse set of schools rather than a homogeneous group:
Network theory tells us that homogeneous networks, characterised by close proximity (e.g. the same local authority) limit the extent of different ideas to which the members are exposed and consequently restrict their thoughts and actions to a small repertoire of options. In contrast, networks developed among educators from diverse educational backgrounds, of diverse professional belief systems, and with diverse professional practices or teaching assignments provide a rich source of new ideas and new possibilities and a foundation for experiments in practice. This sort of experimentation holds the potential for profound improvement (Smylie & Hart, 1999:6).
This work implies that schools in disadvantaged contexts and those in more favourable circumstances might find collaboration mutually beneficial.
2. Methodology
The two main elements of the evaluation comprised case studies of a sample of the 37 federations in the programme together with surveys of schools in the non-case study federations.
2.1 Case studies
Ten federations were initially selected as case studies using a sequence of criteria to ensure a sample that reflected the range within the project. Selection was made on the basis of the DCSF summaries of the federations derived from their original bids.
The first criterion was type of governance. This varied in terms of a ‘soft-hard’ continuum, reflecting increasing power and responsibility for a governance system for the federation. At the ‘softer’ end, federations comprised schools voluntarily joining together for specific purposes with relatively informal arrangements. Governing bodies of individual schools retained independent power. At the ‘harder’ end, schools set up new systems of governance which supported stronger links between schools. These could include joint meetings of governors, service level agreements approved by all governing bodies, and moves towards a single governing body for the federation.
The main second order criteria were the aims of the federation and the types of schools/organizations involved. Aims reflected governance. For example, federations developed on the model of a successful school supporting a school experiencing difficulties had, or were working towards, forms of governance where there were formal arrangements and structures. Where the focus was on CPD, for example, governance appeared to be primarily based in the individual schools with informal arrangements between governing bodies. Sampling also ensured there was a range of sizes of federations (from 2 to 20) and of institutions. Consequently, some federations comprised only schools of a single phase, others crossed school phases, and others included FE colleges and/or other services. Finally, geographic spread was also taken into account to ensure both urban and rural locations and a distribution across England.
Two of the original 10 federations declined to continue from Phase 2 of the study. A new federation was included in Phase 3. The final sample, therefore, comprised nine very varied case studies and these provide the majority of evidence for this research strand. Brief descriptions of the nine case studies are provided in the Appendix.
2.1.1 Data gathering methods
Data gathering was undertaken in three phases in order to gain information on the early stages of the federation, its mature phase and finally the phase at which DCSF funding was coming to an end. Documents including original bids, Ofsted reports, governing body papers and development/improvement plans were examined throughout the project.
Interviews were held with:
• The federation ‘lead’, who was typically its director, but could be a senior LA officer instrumental in developing the federations (n = 31).
• Headteacher/college principals (n = 67)
• Chairs of governors and members of governing bodies (n = 34)
• Teachers holding posts of responsibility such as year tutor (n = 96)
In addition, group interviews were held with pupils initially on an exploratory basis. However, as expected, for much of the period of the project the concept of a ‘federation’ did not impact very much, if at all, on pupils, particularly where the federation’s aims were concerned with staff issues (e.g. Continuing Professional Development (CPD)).
All interviews were semi-structured and followed pro formas appropriate to the phase and interviewee. For example, Phase 1 interviews addressed setting up the federation, plans and expectations, whereas Phase 2 focussed on the embedding process, and Phase 3 interviews included reflections on reasons for and barriers undermining success, sustainability and the interaction between the development of the federation and other Government initiatives over the period, including Every Child Matters, Education Improvement Partnerships and the proposals for Trust schools. The study also included attendance at federation meetings.
2.2 Surveys
2.2.1 Initial survey
Two surveys were undertaken of schools in non-case study federations. Survey 1 was distributed in October 2004 with a follow-up in January 2005. Each school received three separate questionnaires: for the headteacher/ principal, head of year or Key Stage, and chair of governors. Directors of federations who were not included in the headteacher sample received a separate questionnaire. A total of 444 questionnaires were distributed 249 were returned (response rate 56.1%) of which 235 were received by the second deadline and included in the analysis. We were able to compare the headteacher respondents with national statistics on gender, and age.
The governor survey was completed and returned by 67 governors: 92.4% were chairs of their governing body. On average, they had been in their present position at the school for 5.4 years; 37% of respondents were between 51 and 60 years old, 34% over 60, and 26% between 41 and 50; 65.6% of governors responding were male.
The headteachers and principals survey was returned by 107 respondents. Of these, 90% were heads, 4% federation directors and 6% deputy heads. Compared with the 2005 national statistics for headteachers, the sample were comparable in terms of gender: 66% respondents were male, compared with 65% nationally. On average they had been in their present position for 5.8 years, but were younger as a group: 46.5% were between 51 and 60 years of age (nationally 62% male, 57% female headteachers)3 and 46.1% were between 51
and 50 (nationally 31% male, 37% female headteachers), with 7.8% 40 and under (nationally 4% male and 3% female headteachers).
Sixty one heads of year completed and returned the survey. On average they had been working in the school for 4.8 years; 42% were between 41 and 50, 36% between 31 and 40, 12% between 51 and 60, and 19% below 31. Just over half (53.1%) of respondents were male.
In Section 3.1, three sets of data are presented separately: chairs of governors; headteachers/principals, head of federation; and head of year/Key Stage.
2.2.2 Second survey
The second survey was sent out to heads and chairs of governing bodies in all the federations involved in the project except the case studies (n = 148 in each case) in May 2006. Fifty six chairs of governors and 105 heads returned the surveys, producing response rates of 37.8% governors and 70.9% heads.
Of the chairs of governors (from here on in referred to as ‘governors’), 66.7% were male and 33.3% female. The majority (36.4%) were between 51 and 60, 32.7% over 60, 23.6% between 41 and 50, and 7.1% between 31 and 40. Of the heads, 65% were male and 35% were female. The majority (56.3%) were between 51 and 60, 39.8% between 41 and 50, 1.9% over 60 and 2% below 41, representing an older profile than from survey 2, closer to the national age profile of secondary headteachers (see above).
2.3 Analysis of datasets
3. Aims and achievements of federations
In this section we report the evidence from two surveys undertaken at the end of 2004 and May 2006 together with an analysis of the Pupil Level Annual School Census (PLASC) data for federation compared with non-federation schools.
3.1 Initial survey of federation schools: Plans and expectations
The aim of the initial survey was to identify the views of headteachers, principals and heads of federations, chairs of governors and year tutors/heads of Key Stages with respect to the early stages of the federation including its goals target groups, expected outcomes and likely success factors and barriers to success.
3.1.1 Federation goals and targets
[image:18.595.69.507.331.495.2]Respondents were asked to indicate the goals of their federation. Results are given in Tables 1 and 2. (NB respondents could choose one or more options).
Table 1: Main goals of the federation (%)
Raising achievement
Recruitment and retention
Inclusion
Gifted and
Talented Other
Chair of Governors
83.3 7.6 33.3 12.1 24.2
Head/Principal 90.6 14.2 56.6 25.6 25.5
Head of Year 90.4 11.5 46.2 28.8 3.8
[image:18.595.68.513.598.765.2]Raising achievement was clearly the main goal of most federations, with Inclusion being the second most frequently named. Secondary goals most frequently mentioned were Inclusion, recruitment and retention, and gifted and talented pupils.
Table 2: Secondary goals of the federation (%)
Raising achievement
Recruitment and retention
Inclusion Gifted and Talented
Other
Chair of Governors
9.1 36.4 40.9 39.4 7.6
Head/Principal 7.5 42.5 33.0 54.7 11.3
Heads were generally more likely to mention all the suggested factors as goals of the federation than were governors. This was most pronounced with regards to Inclusion and Gifted and Talented. Heads of year were less likely to mention secondary goals and ‘other’ factors but were more likely to mention Gifted and Talented as a main goal than governors. Other goals mentioned by governors concerned post-16 provision and sharing good practice while CPD, sharing good practice and community cohesion were mentioned by Heads.
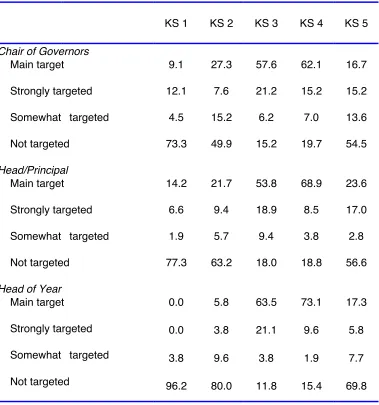
Table 3: Main Key Stages targeted by the federation (%)
KS 1 KS 2 KS 3 KS 4 KS 5
Chair of Governors
9.1 27.3 57.6 62.1 16.7
12.1 7.6 21.2 15.2 15.2
4.5 15.2 6.2 7.0 13.6
Main target
Strongly targeted
Somewhat targeted
Not targeted 73.3 49.9 15.2 19.7 54.5
Head/Principal
14.2 21.7 53.8 68.9 23.6
6.6 9.4 18.9 8.5 17.0
1.9 5.7 9.4 3.8 2.8
Main target
Strongly targeted
Somewhat targeted
Not targeted 77.3 63.2 18.0 18.8 56.6
Head of Year
0.0 5.8 63.5 73.1 17.3
0.0 3.8 21.1 9.6 5.8
3.8 9.6 3.8 1.9 7.7
Main target
Strongly targeted
Somewhat targeted
Not targeted 96.2 80.0 11.8 15.4 69.8
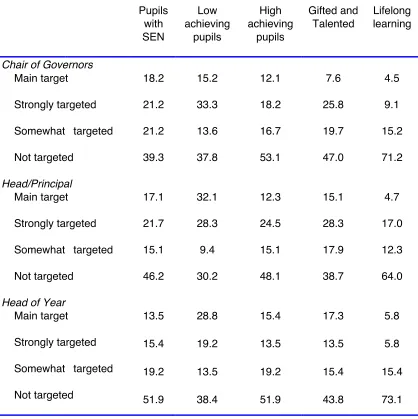
Table 4: Main target groups of pupils for the federation (%)
Pupils with SEN
Low achieving
pupils
High achieving
pupils
Gifted and Talented
Lifelong learning
Chair of Governors
18.2 15.2 12.1 7.6 4.5
21.2 33.3 18.2 25.8 9.1
21.2 13.6 16.7 19.7 15.2
Main target
Strongly targeted
Somewhat targeted
Not targeted 39.3 37.8 53.1 47.0 71.2
Head/Principal
17.1 32.1 12.3 15.1 4.7
21.7 28.3 24.5 28.3 17.0
15.1 9.4 15.1 17.9 12.3
Main target
Strongly targeted
Somewhat targeted
Not targeted 46.2 30.2 48.1 38.7 64.0
Head of Year
13.5 28.8 15.4 17.3 5.8
15.4 19.2 13.5 13.5 5.8
19.2 13.5 19.2 15.4 15.4
Main target
Strongly targeted
Somewhat targeted
Not targeted 51.9 38.4 51.9 43.8 73.1
3.1.2 Setting up the federation
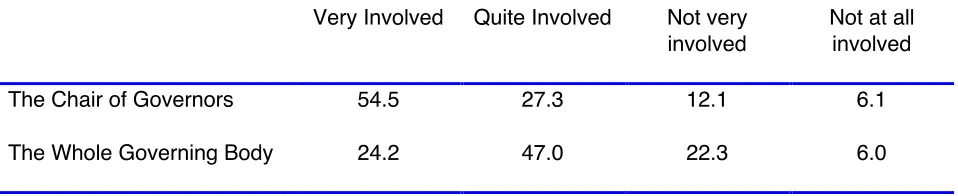
Table 5: Involvement of the governing body in the decision to federate (according to chairs of governors) (%)
Very Involved Quite Involved Not very involved
Not at all involved
The Chair of Governors 54.5 27.3 12.1 6.1
The Whole Governing Body 24.2 47.0 22.3 6.0
When asked how the federation was set up, strong consistency emerged between the three groups of respondents. The initiative to explore federation was taken by the heads in the vast majority of cases who would then inform or consult with governing bodies and the LA. In many cases federations were built on existing collaborations between schools. Less commonly, the initiative to federate was first taken by LA officers, who contacted heads. Only occasionally did the governing bodies take the initiative while, exceptionally, external parties such as DCSF and the Youth Sports Trust were said to have led the initial discussions.
As mentioned above, a very similar picture emerged between respondents, with the only differences being a stronger emphasis by heads on the fact that many federations had been built on existing links between schools, on their own role in discussion with colleagues, and on discussion with other staff, and a weaker emphasis on the role of governors. Overall, however, the pattern is one of triangulation between respondents. Heads of year likewise emphasised the role of the heads or the LA in starting the federation.
3.1.3 Facilitators and barriers
According to chairs of governing bodies, the three main factors that hindered the formation of the federation were:
- staff resistance and fear, especially among middle managers and teachers in schools that felt they might be being amalgamated rather than collaborating,
- confused central guidance and ever-changing rules, and
- an embedded culture of competition between schools in the area.
A lack of funding and uncertainty over how long funding would last, a lack of time for joint planning and meetings, legal problems in constituting the federation, the difficulty of constituting a joint governing body, tensions with existing initiatives in schools, and changes in key personnel were also mentioned at least by two chairs.
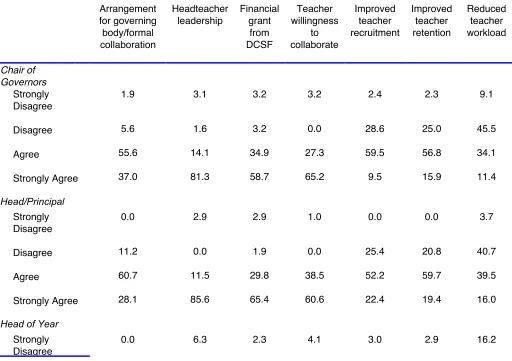
Headteacher leadership was the factor heads and governors saw as most likely to lead to success in their federations, with teacher willingness to collaborate and the financial grant from the DCSF also overwhelmingly deemed important facilitating factors (Table 6). Reduced teacher workload was least likely to be seen as a facilitating factor. Headteachers were more optimistic than governors that improved teacher recruitment would be a facilitating factor. Heads of year were less likely than other respondents to see headteacher leadership as a key factor, and were more likely to agree strongly with the importance of reduced teacher workload as a facilitator. About two thirds of each group of respondents saw teacher willingness to collaborate as a key factor.
[image:22.595.41.553.403.764.2]The facilitating factor most frequently mentioned by all three respondent groups was prior existing networks and links between federating schools, which had strongly aided the formation of the federation, and meant that trust and good working relationships were already present. Enthusiasm and goodwill from all participating schools was also seen as a key factor. Strong leadership from the headteacher, and good relationships with heads of other schools were also frequently mentioned. DCSF finance was seen as a key facilitating factor in many federations, as was LA support. Among heads good working relationships between headteachers and funding from the DCSF were more frequently mentioned than among governors. DCSF guidance was also mentioned by quite a few heads, as was geographical proximity of schools, the fact that schools were similar and did not compete, heads sharing a similar vision, and supportive governing bodies. Heads of year additionally mentioned good relationships between non-management staff in the schools and staff willingness to participate.
Table 6: Main factors likely to lead to success in the federation (%)
Arrangement for governing body/formal collaboration Headteacher leadership Financial grant from DCSF Teacher willingness to collaborate Improved teacher recruitment Improved teacher retention Reduced teacher workload Chair of Governors
1.9 3.1 3.2 3.2 2.4 2.3 9.1
5.6 1.6 3.2 0.0 28.6 25.0 45.5
55.6 14.1 34.9 27.3 59.5 56.8 34.1
Strongly Disagree
Disagree
Agree
Strongly Agree 37.0 81.3 58.7 65.2 9.5 15.9 11.4
Head/Principal
0.0 2.9 2.9 1.0 0.0 0.0 3.7
11.2 0.0 1.9 0.0 25.4 20.8 40.7
60.7 11.5 29.8 38.5 52.2 59.7 39.5
Strongly Disagree
Disagree
Agree
Strongly Agree 28.1 85.6 65.4 60.6 22.4 19.4 16.0
Head of Year
Strongly Disagree
6.5 2.1 0.0 0.0 33.3 31.4 8.1
64.5 37.5 40.9 30.6 45.5 34.3 37.8
Disagree
Disagree
Agree
Strongly Agree 29.0 54.2 56.8 65.3 18.3 31.4 37.8
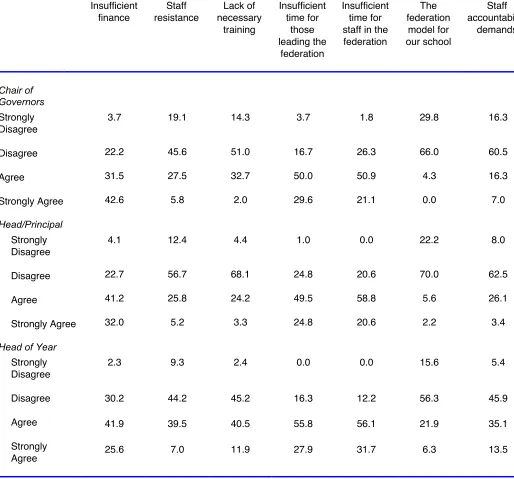
Table 7: Main barriers to success in the federation (%)
Insufficient finance
Staff resistance
Lack of necessary
training
Insufficient time for
those leading the
federation
Insufficient time for staff in the federation
The federation
model for our school
Staff accountability
demands
Chair of Governors
3.7 19.1 14.3 3.7 1.8 29.8 16.3
22.2 45.6 51.0 16.7 26.3 66.0 60.5
31.5 27.5 32.7 50.0 50.9 4.3 16.3
Strongly Disagree
Disagree
Agree
Strongly Agree 42.6 5.8 2.0 29.6 21.1 0.0 7.0
Head/Principal
4.1 12.4 4.4 1.0 0.0 22.2 8.0
22.7 56.7 68.1 24.8 20.6 70.0 62.5
41.2 25.8 24.2 49.5 58.8 5.6 26.1
Strongly Disagree
Disagree
Agree
Strongly Agree 32.0 5.2 3.3 24.8 20.6 2.2 3.4
Head of Year
2.3 9.3 2.4 0.0 0.0 15.6 5.4
30.2 44.2 45.2 16.3 12.2 56.3 45.9
41.9 39.5 40.5 55.8 56.1 21.9 35.1
Strongly Disagree
Disagree
Agree
Strongly
Agree 25.6 7.0 11.9 27.9 31.7 6.3 13.5
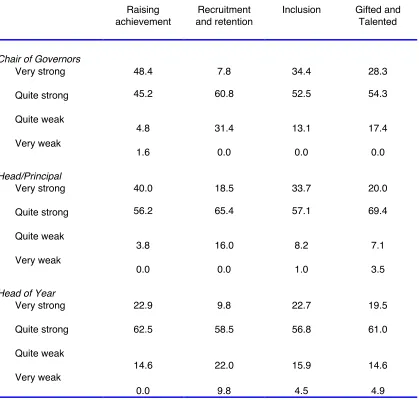
3.1.4. Predicted impact of the federation
Table 8: Predicted impact of the federation on specified goals (%)
Raising achievement
Recruitment and retention
Inclusion Gifted and Talented
Chair of Governors
48.4 7.8 34.4 28.3
45.2 60.8 52.5 54.3
4.8 31.4 13.1 17.4
Very strong
Quite strong
Quite weak
Very weak
1.6 0.0 0.0 0.0
Head/Principal
40.0 18.5 33.7 20.0
56.2 65.4 57.1 69.4
3.8 16.0 8.2 7.1
Very strong
Quite strong
Quite weak
Very weak
0.0 0.0 1.0 3.5
Head of Year
22.9 9.8 22.7 19.5
62.5 58.5 56.8 61.0
14.6 22.0 15.9 14.6
Very strong
Quite strong
Quite weak
Very weak
0.0 9.8 4.5 4.9
While many respondents indicated that the impact would be strongest on other factors, they did not in majority indicate what those factors would be. Factors mentioned included reform of the 14-19 curriculum, increasing post-16 retention, sharing good practice, community cohesion and CPD.
Table 9: Predicted impact of federating on specific goals related to students (%)
Improving attitudes to learning
Improving behaviour
Reducing exclusions
Broadening pupil entitlement
Improving primary/ secondary
transition
Improving transition to post-16
Chair of Governors
34.4 33.3 24.1 37.3 17.3 39.6
60.7 47.4 31.5 55.9 63.5 56.3
4.9 19.3 42.6 6.8 19.2 4.2
Very strong
Quite strong
Quite weak
Very weak 0.0 0.0 1.9 0.0 0.0 0.0
Head/Principal
30.8 23.7 17.2 44.9 21.6 30.9
62.5 62.4 65.5 51.0 52.3 59.3
5.8 12.9 16.1 4.1 23.9 8.6
Very strong
Quite strong
Quite weak
Very weak 1.0 1.1 1.1 0.0 2.3 1.2
Head of Year
18.2 14.0 18.6 25.5 25.0 25.0
65.9 58.1 53.5 63.8 41.7 52.8
11.4 20.9 20.9 8.5 27.8 19.4
Very strong
Quite strong
Quite weak
Very weak 4.5 7.0 7.0 2.1 5.6 2.8
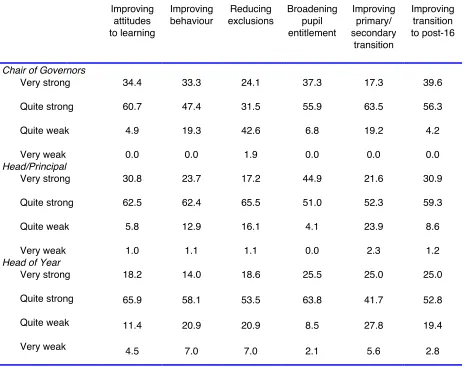
Table 10a: Predicted impact of federating on the aspects of school/college organisation (%) School /college leadership Sharing of Resources Sharing good practice Teacher recruitment Teacher retention Organising primary/ secondary transition Chair of Governors
35.1 50.8 69.2 3.8 6.0 11.8
52.6 46.0 29.2 65.4 56.0 70.6
12.3 3.0 1.5 30.8 38.0 15.7
Very strong Quite strong Quite weak
Very weak 0.0 0.0 0.0 0.0 0.0 2.0
Head/
Principal
38.0 42.3 66.0 12.8 13.1 17.4
58.0 51.9 34.0 59.3 57.1 55.8
4.0 3.8 0.0 25.6 26.2 26.7
Very strong Quite strong Quite weak
Very weak 0.0 1.9 0.0 2.3 3.6 0.0
Head of
Year
19.6 25.0 36.0 8.1 7.9 11.1
67.4 64.6 58.0 48.6 50.0 55.6
10.9 6.3 6.0 37.8 36.8 27.8
Very strong Quite strong Quite weak
Very weak 2.2 4.2 0.0 5.4 5.3 5.6
[image:27.595.60.545.97.597.2]Table 10b: Predicted impact of federating on school/college organisation (%)
Organising transition to post 16
Facilitating inclusion of SEN pupils Cost effectiveness Building on and adding to
other initiatives Impact on the wider education system Chair of Governors
30.4 21.4 24.6 28.1 28.8
65.2 55.4 57.9 64.1 57.6
4.3 21.4 15.8 7.8 13.6
Very strong Quite strong Quite weak
Very weak 0.0 1.8 1.8 0.0 0.0
Head/
Principal
22.8 28.9 29.6 37.9 33.7
64.6 53.3 56.1 60.2 52.0
11.4 16.7 13.3 1.9 13.3
Very strong Quite strong Quite weak
Very weak 1.3 1.1 1.1 0.0 1.1
Head of
Year
12.8 11.9 8.1 37.2 25.0
66.7 59.5 64.9 53.5 47.5
17.9 19.0 24.3 9.3 22.5
Very strong Quite strong Quite weak
Very weak 2.6 9.5 2.7 0.0 5.0
3.1.5 Conclusions
The results of this survey suggest a large degree of agreement between the three main respondent groups, but with heads of years and key stage leaders the middle managers -having greater degrees of scepticism than either headteachers or chairs of governors. However, this needs to be balanced by acknowledging the generally high level of positive comments made across the groups.
Raising achievement was clearly seen at this stage as the major goal for federations but inclusion was also a substantial driver, particularly for the heads and heads of year. Recruitment and retention, by contrast, was very much a secondary goal. The focus was also very much on KS3/4. It is interesting, however, to note that despite the major goal being to increase achievement, low achieving pupils were reported by headteachers as the main target in only a third of schools (Table 4). Rather, the evidence suggests that the federations intended to achieve this goal by spreading their work across a broader pupil constituency.
Setting up the federations had involved chairs of governing bodies but governing bodies as a whole to a lesser extent, with possible implications for the development of the federations if these governors had not ‘bought in’ to the initiative. However, this may also reflect the differing degrees of impact on governance involved in different federations.
Headteacher leadership was recognised as the major factor to lead to success for the federations but the financial allocation by the DCSF was also a key factor. However, these major factors were supported by pre-existing relationships and involvement in other initiatives, particularly collaborative ventures with other schools. That is, federations were seen as benefiting from, even growing out of other initiatives. But it was also recognised that teacher engagement was central to success. However, there were concerns regarding insufficient time for both those leading the federation and other staff are important to note.
There was a general concordance between the goals of the federations, especially increasing achievement, and the expected impacts. Raising achievement was seen as likely to be a strong impact but this appears to have been linked to expected improvements in pupils’ attitudes to learning and improved behaviour. The Inclusion agenda was also represented here by expected broadened entitlement for pupils, but also by greater collegiality among staff characterised by sharing resources and good practice. The likely impact on recruitment and retention was less frequently highlighted as a strong impact but this may reflect different current positions of the schools in the sample. In any case, this is typically a secondary goal.
3.2 Second survey: The impact of federation
The aim of the second survey was to capture the views of headteachers and chairs of governors with respect to their federation’s impact, the factors what had facilitated or presented a barrier to success, and sustainability.
3.2.1 Views on federation impact
Table 11: Success of the federation in reaching specific goals (%)
Raising achievement
Recruitment and Retention
Inclusion Gifted and Talented Governors
Very successful 24.1 20.8 29.6 15.4
Somewhat successful 61.1 43.4 50.0 51.9
Not very successful 11.1 7.5 7.4 15.4
Not a goal of this federation
3.7 28.3 13.0 17.3
Heads
Very successful 28.4 14.7 41.0 30.0
Somewhat successful 64.7 45.3 50.0 46.0
Not very successful 5.9 4.2 3.0 10.0
Not a goal of this federation
1.0 35.8 6.0 14.0
As can be seen in Table 11, both governors and heads largely felt that their Federation had been reasonably successful in reaching its goals. In all cases, the largest group of respondents felt that the federation had been somewhat successful in achieving the stated goal, with percentages ranging from 43% to 65% of respondents. The percentage of respondents feeling that the federation had not been successful was below 20% in all cases, and below 10% in most. Inclusion and raising achievement were seen as having benefited most from federation, with over 90% of heads and 80% to 85% of governors who responded claiming that the federation had been very or somewhat successful in reaching these goals.
These results largely reflect the prior expectations of respondents as indicated in the first survey, though the impact was not always as strong as expected. In that survey, in response to the question ‘How strong do you think the impact of the federation will be on the following goals’, over 40% of both heads and nearly 50% of governors had expected the impact of the federation on raising achievement to be very strong compared with the 24% and 28% respectively who considered the federation had been very successful in this domain.
There were few differences between heads and governors, with the exception being that heads were more positive about the impact of federation on Gifted and Talented than were governors. Other goals mentioned by governors and heads in the open ‘other’ category included 14-19 Pathfinder and curriculum, and collaboration and staff interaction. Heads additionally mentioned widening CPD opportunities.
Respondents were also asked to rate the impact of federation on a number of more specific goals (see Table 12).
Table 12: Success of the federation in reaching specific goals related to students/pupils (%) Improving attitudes to learning Improving behaviour Reducing exclusions Broadening pupil entitlement Improving primary/ secondary transition Improving transition post 16 Governors
Very strong 14.3 10.7 7.4 21.4 16.4 9.3
Quite strong 57.1 48.2 38.9 58.9 32.7 33.3
Quite weak 14.3 17.9 16.7 12.5 14.5 16.7
Very weak 3.6 7.1 7.4 1.8 0.0 0.0
Not applicable
10.7 16.1 29.6 5.4 36.4 40.7
Heads
Very strong 10.9 13.9 20.0 37.3 20.8 14.9
Quite strong 71.3 53.5 40.0 52.9 24.8 39.5
Quite weak 8.9 13.9 17.0 3.9 24.8 17.8
Very weak 5.0 5.0 2.0 2.9 3.0 3.0
Not applicable
4.0 13.9 21.0 2.9 26.7 24.8
Some differences again emerged between heads and governors. Overall heads reported a stronger impact of the federation on students than did governors, and were less likely to say that the goals were not applicable to their federation. This tendency was most pronounced for exclusions, where 60% of heads, but only 46% of governors considered the federation has had had an impact, but was also strong for transition post 16.
[image:31.595.72.516.88.311.2]Again the actual impact was generally somewhat less positive than the expected impact as surveyed in the first questionnaire, where, for example, over 90% of respondents had expected positive impacts on attitudes to learning, behaviour and broadening entitlement. This difference was particularly marked with regards to exclusions, where over 50% of governors and over 80% of heads had expected a positive impact of federation.
Table 13a: Impact of the federation on aspects of school/college organisation (%)
School leadership Sharing of resources Sharing good practice Teacher recruitment Teacher retention Organising primary/ secondary transition Governors
Very strong 26.8 29.6 37.5 7.3 3.6 9.1
Quite strong 42.9 46.3 55.4 32.7 30.9 38.2
Quite weak 12.5 20.4 5.4 25.5 30.9 14.5
Very weak 5.4 0.0 0.0 3.6 1.8 1.8
Not applicable 12.5 3.7 1.8 30.9 32.7 36.4
Heads
Very strong 30.0 23.5 44.7 4.0 2.0 15.0
Quite strong 59.0 61.8 50.5 30.0 33.0 24.0
Quite weak 4.0 12.7 4.9 25.3 25.3 24.0
Very weak 3.0 1.0 0.0 3.0 3.0 3.0
Not applicable 4.0 1.0 0.0 37.4 36.4 34.0
[image:31.595.73.542.509.724.2]good practice, seen by over 90% of respondents as having been affected quite or very strongly by federation, was seen as having benefited from federation; as also were sharing of resources, cost effectiveness, school leadership, and building on and adding to other initiatives (over 70% quite or very strong). Federation was also seen as having had positive benefits for the education system as a whole, and as having benefited the inclusion of pupils with SEN. Retention, recruitment and transition arrangements were seen as having been less strongly impacted by federation, although in all these cases over a third of respondents still reported quite strong benefits of federating.
Table 13b: Impact of the federation on aspects of school/college organisation (%)
Organising transition
post 16
Facilitating inclusion of pupils
with SEN
Cost effectiveness
Building on and adding to other
initiatives
Impact on wider education
system Governors
Very strong 7.3 16.4 11.3 14.3 12.7
Quite strong 34.5 54.5 56.6 58.9 41.8
Quite weak 20.0 10.9 18.9 17.9 29.1
Very weak 0.0 5.5 7.5 1.8 5.5
Not applicable 38.2 12.7 5.7 7.1 10.9
Heads
Very strong 1.5 16.2 19.0 31.0 21.9
Quite strong 37.5 46.5 55.0 61.0 53.1
Quite weak 20.1 18.2 15.0 6.0 17.7
Very weak 1.0 2.0 3.0 2.0 2.1
Not applicable 28.1 17.2 8.0 0.0 5.2
Heads tended to be more positive than governors about impact on leadership, sharing of resources, impact on the system and building on other initiatives, while governors were somewhat more positive on the impact of federating on primary/secondary transition and Inclusion.
As was the case with respect to students, judgements of actual impact were somewhat less positive than the very high expectations expressed in the first survey (e.g. over 66% anticipating a very strong impact on sharing good practice). However, the pattern of actual impact mirrors that of expected impact in terms of which factors are seen to have been affected most strongly.
3.2.2 Facilitators and barriers
Table 14a: Main factors that have helped the federation to be successful (%)
Arrangement for governing body or
formal collaborative agreement Headteacher leadership DCSF financial grant Teacher willingness to collaborate Improved teacher recruitment Governors Disagree strongly
5.6 3.6 1.8 1.8 3.6
Disagree 11.1 0.0 5.4 3.6 23.6
Agree 44.4 42.9 33.9 50.9 32.7
Agree strongly 24.1 53.6 57.1 41.8 10.9
Not Applicable 14.8 0.0 1.8 1.8 29.1
Heads Disagree strongly
5.3 0.0 0.0 0.0 2.0
Disagree 13.7 1.9 0.0 1.9 15.2
Agree 46.3 32.0 25.2 44.2 38.4
Agree strongly 24.2 66.0 74.8 53.8 6.1
Not Applicable 10.5 0.0 0.0 0.0 38.4
Table 14b: Main factors that have helped the federation to be successful (%)
Improved teacher retention Reduced teacher workload
Built on good existing relations between schools Management willingness to collaborate Trust between schools Governors Disagree strongly
1.8 5.6 3.6 5.4 3.6
Disagree 26.8 46.3 14.5 1.8 9.1
Agree 32.1 25.9 43.6 50.0 38.2
Agree strongly 7.1 3.7 38.2 41.1 45.2
Not Applicable 32.1 18.5 0.0 1.8 3.6
Heads Disagree strongly
2.1 5.3 1.0 0.0 0.0
Disagree 16.5 38.9 6.8 1.9 1.9
Agree 40.2 21.1 35.9 26.9 30.8
Agree strongly 5.2 3.2 56.3 71.2 66.3
[image:33.595.64.514.371.581.2]Table 14c: Main factors that have helped the federation to be successful (%)
Quality of leadership in
federation schools
Quality of governance
in the federation
LA involvement Equality of school status
Quality of communication
Governors Disagree strongly
3.6 3.6 7.1 3.6 1.8
Disagree 0.0 5.4 42.9 26.8 14.5
Agree 46.4 51.8 33.9 37.5 60.0
Agree strongly 48.2 28.6 3.6 26.8 23.6
Not Applicable 1.8 10.7 12.5 5.4 0.0
Heads Disagree strongly
0.0 3.0 19.6 5.8 0.0
Disagree 0.0 15.8 40.2 10.6 3.8
Agree 25.0 50.5 56.5 39.4 47.1
Agree strongly 74.0 19.8 6.9 40.4 49.0
Not Applicable 1.0 10.9 6.9 3.8 0.0
Leadership, both of individual school heads and of the federation as a whole, and the financial grant from the DCSF emerged as the most significant factors according to respondents, with over 50% strongly agreeing that they helped the federation succeed. Willingness to collaborate, both among teachers and among managers, and trust and relations between schools also emerged as highly significant enabling factors, as did quality of communication and quality of federation governance, with more than half of all respondents agreeing that they constituted success enabling factors in their federation. Improved recruitment and retention and reduced workload, as a result of this federation, each produced a more ambiguous response, with fewer than half of respondents (governors and heads) agreeing that these had contributed to success. There may be a perception among many respondents that these factors have not improved substantively enough to become major facilitators, although the high proportion (about a third) stating these were not applicable to their schools must also be considered.
Mixed views emerged on LA involvement, with heads being substantially more positive on the impact of their involvement than governors: 63% against 38% respectively. Some other differences between heads and governors also emerged. Heads generally attached a greater importance to federation leadership and management issues than governors (74% compared with 48% strongly agreed), and to a lesser extent to good communication, trust and existing relationships.
Again, these findings conformed largely to the prior expectations of the heads and governors as expressed in the first survey, where likewise headteacher leadership had been seen as the most likely factor to impact on success, with teacher willingness to collaborate and the financial grant from the DCSF also overwhelmingly deemed potentially important facilitating factors. Reduced teacher workload was least likely to be seen as a facilitating factor in the first survey.
Table 15a: Main barriers to the success of the federation (%) Insufficient finance Staff resistance Lack of necessary training
Insufficient time for those leading the
federation
Insufficient time for staff
in the federation Governors
Disagree strongly 3.6 11.1 5.8 3.8 1.9
Disagree 45.5 61.1 73.1 26.9 31.5
Agree 34.5 24.1 21.2 61.5 55.6
Agree strongly 12.7 1.9 0.0 7.7 11.1
Not Applicable 3.6 1.9 0.0 0.0 0.0
Heads
Disagree strongly 4.0 14.7 10.9 5.8 5.8
Disagree 49.5 60.8 68.3 32.0 27.2
Agree 22.2 18.6 9.9 42.7 52.4
Agree strongly 21.2 3.9 2.0 17.5 12.6
Not Applicable 3.0 2.0 8.9 1.9 1.9
Table 15b: Main barriers to the success of the federation (%)
The federation model for our
school
Staff accountability
demands
Unclear legal status of the
federation
Unclear legal status of the federation
Executive Head
Conflicts with other national
initiatives
Governors
Disagree strongly 12.7 3.8 9.4 9.3 5.5
Disagree 65.5 59.6 54.7 42.6 50.9
Agree 10.9 28.8 22.6 20.4 34.5
Agree strongly 10.9 3.8 5.7 7.4 3.6
Not Applicable 0.0 3.8 7.5 20.4 5.5
Heads
Disagree strongly 16.5 9.1 18.8 16.2 12.7
Disagree 70.1 65.7 50.5 39.4 47.1
Agree 6.2 17.2 15.8 10.1 24.5
Agree strongly 1.0 3.0 4.0 3.0 7.8
Not Applicable 6.2 5.1 10.9 31.3 7.8
Heads’ and governors’ responses were generally consistent, though governors were more likely to feel that lack of staff training, unclear legal status of the federation and the executive head, and staff accountability demands were problems. Heads were more likely to agree strongly that insufficient time for leaders of the federation was a barrier,
Again these findings are generally consistent with the prior expectations of heads and governors, as in the first survey lack of finance and lack of time had been singled out as the most likely barriers to success. In practice, lack of time had turned out to be more, and lack of finance less of a barrier than initially expected, however.
3.2.3. Involvement of the governing body in the development of the federation
[image:35.595.67.552.325.521.2]Table 16: Involvement of the governing body in the development of the federation (%)
The Chair of Governors
The Governing Body as a whole Governors
Very involved 38.2 7.1
Quite involved 23.6 39.3
Not very involved 32.7 39.3
Not involved at all 5.5 14.3
Heads
Very involved 29.4 12.0
Quite involved 32.4 32.0
Not very involved 32.4 52.0
Not involved at all 5.7 4.0
These results suggest that governors were less involved in the development than in the setting up of the federations, as in the first survey over 50% of responding governors had claimed that the chair had been very involved in the setting up of the federation, and over 25% felt the same about the governing body as a whole.
Governors had mixed views on the impact of federating on the governance of their schools, with a group claiming closer relationships and cooperation, while a larger group claimed to see little or no impact at all. Heads reported a greater impact on governance, citing improved communication between governors, a broadened outlook and greater focus, though again a very substantial group (though not, in this case, the majority) reported little or no impact.
3.2.4. Sustainability
Respondents were also asked to comment on the sustainability of the federation, and the likely impact of three key Government programmes, Every Child Matters; Academies; and Trusts schools on their federation. Results are given in Tables 17 and 18.
Table 17: Sustainability of the federation (%)
Will the federation continue once DfES
funding ceases?
Will the federation continue once the current leadership
has left?
Will governance become more tightly integrated between
federation schools?
Governors
Definitely 16.4 15.4 9.3
Very Likely 34.5 26.9 14.8
Likely 40.0 50.0 25.9
Unlikely 9.1 7.7 50.0
Heads
Definitely 38.5 20.0 9.8
Very Likely 23.1 36.0 9.8
Likely 35.6 35.0 24.5
Unlikely 2.9 9.0 55.9
[image:36.595.64.534.504.692.2]