Evaluation of
the Adult
Learning Grant
Cohort 2
(Wave 1)
Centre for Research in Social Policy Elspeth Pound
Yekaterina Chzhen Monica Magadi Viet-Hai Phung
National Centre for Social Research Juliet Michaelson
Steven Finch Emily Tanner Helen MacKenzie
CONTENTS
Page
EXECUTIVE SUMMARY i
1 INTRODUCTION 1
1.1 The Adult Learning Grant 1
1.2 The Evaluation of the Adult Learning Grant 2
1.3 Cohort 2 Survey Design 4
1.3.1 Applicants 4
1.3.2 Non-applicants 5
1.3.3 Response and weighting 7
1.4 Structure of the Report 8
1.4.1 Report conventions 8
2 BACKGROUND CHARACTERISTICS OF LEARNERS 10
2.1 Definitions of Groups for Analysis 10
2.2 General Characteristics 11
2.2.1 Age and gender 11
2.2.2 Ethnicity 13
2.2.3 Family and living arrangements 14
2.2.4 Parental education level 17
2.2.5 Health and disability 17
2.2.6 Comparison between survey and administrative 18 data: age, gender, ethnicity
2.3 Activity Status 20
2.3.1 Current activity 20
2.3.2 Details of Current Jobs 22
2.3.3 Previous Activity 24
2.3.4 Main reason for stopping previous activity 27
2.4 Income 32
2.5 Qualifications 36
2.5.1 Qualifications achieved prior to 2004/5 36
2.5.2 Qualifications studied in 2004/5 39
2.5.3 Comparison of qualifications obtained with those 42 studied in 2004/5
2.6 Summary 45
3 LEARNERS’ ATTITUDES TOWARDS LEARNING, SOURCES OF
INFORMATION, AND REASONS FOR STUDYING 46
3.1 Responses to Attitudinal Statements 46
3.2 Sources of Information, Advice and Guidance on Further
Education 48
3.3 Reasons for Choosing Current Course 50
4 COSTS AND FUNDING OF LEARNING 55
4.1 Introduction 55
4.2 Costs of Courses 56
4.2.1 Payment of tuition fees 56
4.2.2 Payment of registration and exam fees 66
4.3 Sources of Funding 70
4.3.1 Education Maintenance Allowance 70
4.3.2 Other FE funding 73
4.4 Employer Training Pilots 75
4.5 Reasons for Not Applying for ALG 76
4.6 Summary 76
5 APPLICATIONS FOR, RECEIPT AND SPENDING OF ALG 78
5.1 Experiences of ALG Application 78
5.1.1 Where awardees obtained an ALG application pack 79
5.1.2 Advice on ALG application 80
5.2 Receipt and Spending of ALG 82
5.2.1 Receipt of ALG 82
5.2.2 Recipients’ spending of ALG payments 86
5.3 Summary 93
6 WHAT DIFFERENCE DOES ALG MAKE? 94
6.1 Influence of ALG on Whether to Study 94
6.2 Influence of ALG on Whether to Study Full-Time 97 6.3 Influence of ALG on Whether to Continue the Course 101
6.4 Summary 103
7 CONCLUSIONS 105
7.1 Background Characteristics of Learners 105
7.2 Experiences of Applying for ALG 106
7.3 Effect of ALG on Learner’s Decisions and Choices 106
INDEX OF TABLES AND FIGURES
Table 1.1 Take up of ALG by area for 2004/5 2
Table 1.2 Eligibility groups for ALG 4
Table 1.3 Assignment of eligibility groups for Cohort 2 applicant 5 sample
Table 1.4 Learning Aim Codes of Qualifications at Level 2 or 3 included 7 in the Sample File irrespective of width or awarding body
Table 2.1 Breakdown of applicant and awardee samples 10 Table 2.2 Distribution of age at interview of awardees and 11
non-applicants
Table 2.3 Age groups of awardees and non-applicants by gender and 12 ALG area
Table 2.4 Ethnicity breakdown of awardees and non-applicants 13 Table 2.5 Living arrangements of awardees and non-applicants 14 Table 2.6 Tenure status of awardees and non-applicants 15 Table 2.7 Whether respondents had children aged Under 16 for
awardees and non-applicants 16
Table 2.8 Parental education of respondents for awardees and
non-applicants 17
Table 2.9 Gender of ALG awardees, from survey data and administrative
data 18
Table 2.10 Age of ALG awardees, from survey data and administrative
data 19
Table 2.11 Ethnicity of ALG awardees, from survey data and
administrative data 19
Table 2.12 Main current activity of awardees and non-applicants, by ALG
Areas 20
Table 2.13 Awardees: activity status by receipt of ALG 21 Table 2.14 Number of hours spent in supervised learning by awardees
and non-applicants 22
Table 2.15 SOC 2000 classification of current job 22
Table 2.16 Size of current employer of awardees and non-applicants who
worked 23
Table 2.17 Main prior activity of awardees and non-applicants, by ALG
areas 24
Table 2.18 Awardees: previous activity of those currently in full-time
education, by ALG area 25
Table 2.19 Non-applicants: previous activity of those currently in
full-time education, by ALG area 26
Table 2.20 Main reason for stopping previous activity by previous activity group - those who changed from full-time work
to part-time work or education with a job 27
Table 2.21 Main reason for stopping previous activity by previous activity group - these awardees who changed from full-time
work to not working 28
Table 2.22 Main reason for stopping previous activity by previous activity group – those awardees and non-applicants who changed from part-time work or education with a job to not
Table 2.23 Main reason for stopping previous activity by previous activity group – those awardees and non-applicants who changed from part-time work or education with a job to
full-time work 30
Table 2.24 Main reason for stopping previous activity by previous activity group – those awardees and non-applicants who changed from not working to part-time work, full-time work
or education with a job 31
Table 2.25 Distribution of respondents’ earnings from salaried or
self-employment for awardees and non-applicants 32
Table 2.26 Distribution of earnings for respondents and their partners for
awardees and non-applicants 33
Table 2.27 Receipt of benefits by awardees and non-applicants 33 Table 2.28 Distribution of amount received annually from benefits by
awardees and non-applicants by area 34
Table 2.29 Distribution of total income (earnings and benefits) of awardees and non-applicants (including partner’s income,
where applicable) 35
Table 2.30 Highest qualification level obtained prior to 2004/5 36 Table 2.31 Qualification types achieved – total and by respondents
currently studying at Level 2 and Level 3 37
Table 2.32 Highest vocational qualification level obtained prior to 38 2004/5 – awardees
Table 2.33 Highest academic qualification level obtained prior to 38 2004/5 – awardees
Table 2.34 Highest level of study during 2004/5 39
Table 2.35 Highest level of study during 2004/5 – total and by 40 respondents currently studying at Level 2 and Level 3
Table 2.36 Most common subjects currently being studied 41 Table 2.37 Awardees: level of study by highest level obtained 42 Figure 2.1 Highest level of qualifications obtained for awardees
currently studying at Level 2 43
Figure 2.2 Highest level of qualifications obtained for awardees
currently studying at Level 3 44
Table 2.38 Awardees: level of current study, including whether first
Level 2 or 3 studying at Level 3 44
Table 3.1 Distribution of awardees and non-applicants by expressed
attitudes towards learning 47
Table 3.2 Sources of information, advice and guidance on further
education 48 Table 3.3 Most useful sources of information, advice and guidance on
further education 49
Table 3.4 Most useful sources of information, advice and guidance on
further education by age 50
Table 3.5a Awardees’ and non-applicants’ specific reasons for taking
course not related to their job or related but not-compulsory 51 Table 3.5b Awardees and non-applicants studying for non-compulsory
job-related courses - specific reasons for taking current
course, by age 52 Table 3.7 Awardees’ and non-applicants’ reasons for taking current
course, by level of current qualification aim 53 Table 3.8 Awardees’ and non-applicants’ reasons for taking current
course, by ethnicity 54
Table 4.1 Payment of tuition fees by awardees, recipients and
non-applicants by LSC area 56
Table 4.2 Payment of tuition fees by awardees and by background
characteristics 58
Table 4.3 Payment of tuition fees by awardees by activity and
income, by old and new areas 59
Table 4.4 Payment of tuition fees by non-applicants by activity and
income, by old and new areas 60
Table 4.5 Payment of tuition fees by awardees by current 61 qualification aim, by old and new areas
Table 4.6 Payment of tuition fees by non-applicants by current 61 qualification aim, by old and new areas
Table 4.7 Payment of tuition fees by awardees by living arrangement 62 Table 4.8 Payment of tuition fees by non-applicants by living 62
arrangement
Table 4.9 Amount of tuition fees paid by awardees (and family/partner) 63 by gender, by old and new areas
Table 4.10 Amount of tuition fees paid by non-applicants (and 63 family/partner) by gender, by old and new areas
Table 4.11 Amount of tuition fees paid by awardees and non-applicants 64 (and family/partner) by background characteristics
Table 4.12 Amount of tuition fees paid by awardees and non-applicants 65 (and family/partner) by activity, qualifications and income
Table 4.13 Payment of registration and exam fees by awardees and 66 non-applicants by LSC area
Table 4.14 Payment of registration and exam fees by awardees and 68 non-applicants by learner characteristics
Table 4.15 Payment of registration and exam fees by awardees and 69 non-applicants by activity, qualification, and income
Table 4.16 Per cent of awardees and non-applicants who had heard of 70 EMA, by LSC area
Table 4.17 Per cent of awardees and non-applicants who had ever 72 applied for and received EMA, by LSC area
Table 4.18 Applications for various forms of funding by awardees and 73 non-applicants during academic year ending August 2005
Table 4.19 Applied for any source of Learner Support Funds during 74 academic year ending August 2005 by awardees and
non-applicants, by area
Table 4.20 Discussions about and participation in ETP-type schemes by 75 awardees and non-applicants, by ETP and non-ETP areas
Table 4.21 Non-applicants’ reasons for not applying for ALG 76 Table 5.1 Where awardees obtained ALG application pack, by age, 79
level of current qualification aim, living arrangement and current activity
Table 5.3 How useful ALG telephone helpline is to awardees, by 81 background characteristics
Table 5.4 Success rates for ALG applications in 2004-2005, by LSC area 82 Table 5.5 Success rates for ALG applications in 2004-2005, by 83
ethnic origin
Table 5.6 Awardees receiving ALG, by LSC area 84
Table 5.7 Awardees receiving ALG, by background characteristics 85 Table 5.8 Reasons for non-take up of ALG in old and new areas 86
Table 5.9 How ALG was spent, by LSC area 87
Table 5.10a How ALG was spent in old areas, by age, gender and living 88 arrangement
Table 5.10b How ALG was spent in new areas, by age, gender and living 89 arrangement
Table 5.11a How ALG was spent in old areas, by ethnic origin 89 Table 5.11b How ALG was spent in new areas, by ethnic origin 90 Table 5.12a How ALG was spent in old areas, by current activity status 90 Table 5.12b How ALG was spent in new areas, by current activity status 91 Table 5.13a How ALG was spent in old areas, by level of current
qualification aim 91
Table 5.13b How ALG was spent in new areas, by level of current
qualification aim 92
Table 5.14a How ALG was spent in old areas, by annual income 92 Table 5.14b How ALG was spent in new areas, by annual income 93 Table 6.1 Whether recipients would still have gone ahead with their 94
course if ALG had not been awarded, by LSC area
Table 6.2 Whether recipients would still have gone ahead with their 95 course if ALG had not been awarded, by age, gender, ethnicity, and living arrangement
Table 6.3 Whether recipients would still have gone ahead with their 96 course if ALG had not been awarded, by activity, qualification, and income
Table 6.4 Whether recipients would have studied part-time if ALG had 97 not been awarded, by decision to study full-time before or
after having heard of ALG
Table 6.5 Whether recipients would have studied part-time if ALG had 98 not been awarded, by LSC area
Table 6.6 Whether recipients would have studied part-time if ALG had 99 not been awarded, by age, gender, ethnicity, and living
arrangement
Table 6.7 Whether recipients would have studied part-time if ALG 100 had not been awarded, by current activity, level of current
study, and income
Table 6.8 Whether recipients would have dropped out of the course if 101 ALG had not been awarded,by LSC area
Table 6.9 Whether recipients would have dropped out of the course if 102 ALG had not been awarded,by age, gender, ethnicity, and
living arrangement
Table A1 ‘I didn’t get anything useful out of school’, by background
characteristics i
Table A2 ‘I wish I’d gone to university’, by background characteristics ii Table A3 ‘Education as an investment in your future’, by background
characteristics iii
Table A4 ‘I don’t’ have the confidence to learn on my own’, by
background characteristics iv
Table A5 ‘Learning is something you should do throughout your life’,
by background characteristics v
Table A6 ‘I like the idea of learning in new ways such as through the
internet or using CD Roms’, by background characteristics vi Table A7 ‘Learning is only worthwhile if there is a qualification at the
end of it’, by background characteristics vii
Table A8 ‘Computers are confusing and make things more difficult’, by
background characteristics viii
Table A9 ‘It is the responsibility of the learner to pay for his or her
learning’, by background characteristics ix
Table A10 ‘Employers should pay for their employees to learn’, by
ACKNOWLEDGEMENTS
The authors wish to express their appreciation to the Department for Education and Skills (DfES) and to the Learning and Skills Council (LSC) who sponsored the evaluation of the Adult Learning Grant (ALG). We are particularly indebted to Peter Vallely and to Paul Froggatt for their helpful comments and advice during the design and implementation of the surveys, and continued support throughout the evaluation exercise.
We are grateful to representatives of the Individual Learner Record and the ALG administrative provider for their cooperation with the study. Special thanks to learners who participated in the study, for taking their time to respond to the telephone survey.
EXECUTIVE SUMMARY
1 Introduction
The Adult Learning Grant (ALG) aims to support adults who have not yet obtained their first Level 2 or first Level 3 qualification. The ALG is intended to help adults with the additional costs of learning (for example, books, travel) through the provision of a means-tested monetary grant. The grant (up to £30 per week paid during term time) is available to learners earning up to £19,000 (or up to £30,000 if the learner cohabits with a partner in paid employment). The grant is subject to strict eligibility criteria and award relies on learners demonstrating that they meet criteria relating to UK residency, age, proposed course of study, level of prior achievement, and that they intend to study at a designated learning provider. The grant is targeted at full-time adult learners studying for their first full Level 2 qualification and aged over 19 years of age, or full-time learners studying for their first full Level 3 qualification and aged between 19 and 30 years of age. Manchester City Council (MCC) administers the grant.
The ALG pilot was announced as part of the 2003 Skills Strategy1. In September 2003, ALG was launched in 10 English Learning and Skills Council (LSC) areas. In 2004, the ALG pilot was extended to 9 additional LSC areas in the North East and South East areas. The take up of ALG by area for 2004/5 is shown in the table below.
ALG awards
Old pilot areas
Bedfordshire & Luton 254
Black Country 287
Devon & Cornwall 611
Durham 211
Humberside 438
Lancashire 890
Leicestershire 373
London West 343
Shropshire 134
South Yorkshire 475
New pilot areas
Berkshire 37
Hampshire & Isle of Wight 232
Kent 209
Milton Keynes, Oxfordshire & Buckinghamshire 126
Surrey 33
Sussex 192
Northumberland 16
Tees Valley 143
Tyne & Wear 171
Total 5,175
2 The Evaluation
The Centre for Research in Social Policy (CRSP) at Loughborough University and the National Centre for Social Research (NatCen) are evaluating ALG on behalf of the Department for Education and Skills and the National Office of the Learning and Skills Council.
The evaluation comprises both a qualitative study and longitudinal surveys of 2 cohorts of learners in ALG pilot areas.
The evaluation has 5 key objectives, to:
1 measure the extent to which ALG improves retention and attainment among the eligible population in pilot areas;
2 determine whether ALG graduates progress to further learning or into
employment and whether there are any associated improvements in their labour market status;
4 determine differences in the performance of ALG between pilot areas, men and women, and young people who are independent and those living with parents; and
5 explore implementation of the ALG at local level and identify good practice.
The report presents findings from Cohort 2 Wave 1, and contributes to objectives 1, 3, and 4.
A second wave survey will report on Cohort 2 learners in 2007, and will present analyses of ALG influence over qualification attainment and transitions in
employment and further learning associated with receipt of ALG (evaluation objectives 1 and 2).
A qualitative study, addressing objective 5, has already been published2.
Cohort 2 comprises learners studying during the 2004/5 academic year in 1 of 19 pilot areas. Learners consist of FE learners applying for ALG for the first time (‘the applicants’), and FE learners screened by age, level and mode of study, and who had not applied for ALG (‘the non-applicants). Cohort 2 learners were surveyed during the summer of 2005 (Wave 1) and will be followed up during the summer of 2006 (Wave 2).
Please note that Cohort 1 comprised learners studying during the 2003/4 academic year in 1 of the 10 original pilot areas. Findings from Cohort 1 Wave 13 and Wave 24 are reported elsewhere.
3 Survey Design and Methods
The sample of ALG applicants was drawn from records held by the administrative provider, Manchester City Council (MCC). The records contained details of all
learners who had applied for ALG as at May 2005. The file was stratified by the local LSC pilot areas, with the same selection probability used for each area. The
sampling frame for cohort 2 contained 8,211 cases. A proportionate sample of 3,432 applicants were targeted. The total number of full achieved interviews was 2,248, a response rate of 66%. Weights were derived that accounted for potential response bias on the basis of background characteristics (area, region, age and gender).
The non-applicant sample was drawn from the Individualised Learner Record (ILR) held by the LSC, from the database with the details of all qualifications being studied by learners within FE. Data were extracted from the ILR in April 2005. As the
records on the database were at the level of individual qualifications, rather than learners, two stages of work on the sample were required: first, constructing a
2 Pound, E., Maguire, M., Middleton, S., Ashton-Brooks, K. (2004). ‘A qualitative investigation into the first year (pilot) implementation of the Adult Learning Grant’, Department for Education and Skills Research Brief: RBX12-04, November 2004.
http://www.dfes.gov.uk/research/data/uploadfiles/RBX12-04.pdf
3 Cohort 1, Wave 1 findings have already been reported to the DfES (see Pound, E., Magadi, M., Michaelson, J., Finch, S., Stafford, B. (2005) Evaluation of the Adult Learning Grant: Cohort 1 Wave 1).
sample frame of eligible learners and then drawing a sample. This gave a sample frame of 21,096 learners. A sample of 3,572 was randomly selected from the sample frame. During fieldwork, 132 cases were removed for being duplicates with the applicant sample. The total number of full achieved interviews was 1,004, which is a response rate of 29% of the revised issued sample of 3,440. After ineligible respondents had been removed, the final achieved sample was 930 respondents. As for applicants, weights were derived for the non-applicant sample that corrected for potential response bias (area, region, age and gender).
4 Report Structure
Throughout the report (except experiences of applying for and receiving ALG) the analysis focuses on comparisons between ‘non-applicants’ and ALG ‘applicant’ sub-groups: ‘Awardees’ (‘applicants’ awarded ALG) and ‘Recipients’ (defined as
awardees who were receiving ALG payments at the time of survey or had received at least 1 payment before they were stopped or withheld). Where appropriate, area and cohort comparisons are reported.
The findings relate to:
• background characteristics; • attitudes towards learning; • costs and funding of learning;
• experiences of applying for and receiving ALG; and • recipients’ perceptions of what difference ALG made.
5 Key Findings
5.1 Profile of ALG awardees and eligible non-applicants
5.1.1 Diversity of ALG awardees
The age breakdown for ALG awardees (from administrative data) was as follows:
Age break-down of those awarded ALG
Age 18-19* 20 21-24 25-31
% of ALG awardees 35 28 24 13
* Note 18 year olds can apply if close to their nineteenth birthday
Please note, the take up of ALG by over 30s was low because they are only eligible for level 2 learning, and 80% of ALG study was at level 3.
The gender split for 2004/5 was 53% female and 47% male, which was the same as for the previous year. The gender split in FE as a whole is 59% female, 41% male.
A considerable number of learners from ethnic minority groups have taken up ALG (20% of ALG awardees); and those of Asian origin are particularly strongly
Ethnicity break-down of those awarded ALG
Ethnicity White Asian Black Mixed Total
% ALG awardees 80 13 4 3 100
13% of ALG awardees had a long standing illness or disability (slightly higher than the proportion of disabled people studying in FE as a whole).
5.1.2 Family and living arrangements
The majority of ALG awardees (78%) were living with parents. 11% were living with a partner, 3% were living alone, and 8% were living with others. Eligible
non-applicants were less likely to be living with their parents (66%) and more likely to be living with others (16%). About 70% of awardees and eligible non-applicants who were living with parents were not paying any rent. Only 10% of ALG awardees had children under 16, compared to 14% of non-applicants.
Looking at the background of ALG awardees, 60% of their parents had left school at the age of 16 or under.
5.1.3 Employment status
59% of awardees were working while they were doing their course, but prior to taking up the course, only 38% of awardees were working. So ALG students are
apparently more likely to be working since they started their full-time course. Since around 70% of students are under 22, this may just reflect increasing engagement with the labour market as they become older.
Of those who were working, the breakdown of their occupation types is as follows: 35% elementary occupations, 35% sales/customer service, 13% personal service, 7% administrative or secretarial occupations. Most awardees therefore seem to be concentrated in low-skilled jobs.
The income distribution of ALG awardees was as follows: 91% had a personal income below £10,000 (nearly half of these claimed to have no income at all), 6% had an income of more than £10,000, and 2% did not reveal their income. The income distribution was very similar for eligible non-applicants although a slightly higher proportion (11%) had an income over £10,000. The income of awardees’ partners tended to be higher: 37% had no income or earned less than £10,000; 53% earned over £10,000 and there was no information for the remaining 10%. 8% of awardees were receiving means-tested benefits compared to 17% of non-applicants.
All the above suggests that people in the ALG target group who are working are doing low-skilled work to support themselves while they are building their
5.1.4 Prior Qualifications of ALG awardees
Overall, around 13% of ALG awardees were apparently ineligible for ALG because they were studying at a level in which they already had a full qualification. The most likely explanation for these apparent ineligibles is that there were some errors in gathering prior qualifications data by telephone. When asked on the spot, learners with combinations of different academic and vocational qualifications may not be able to remember their precise outcomes and levels for each qualification.
Furthermore, in spite of careful questioning, learners sometimes report their current level of study as their highest prior qualification.
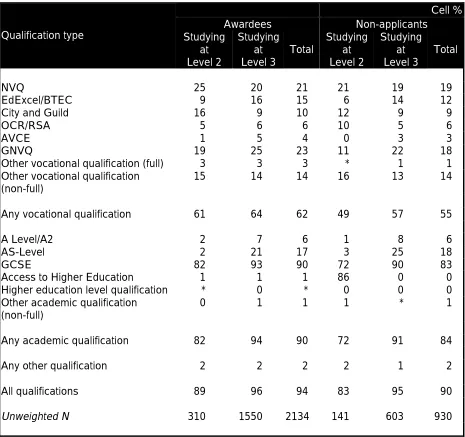
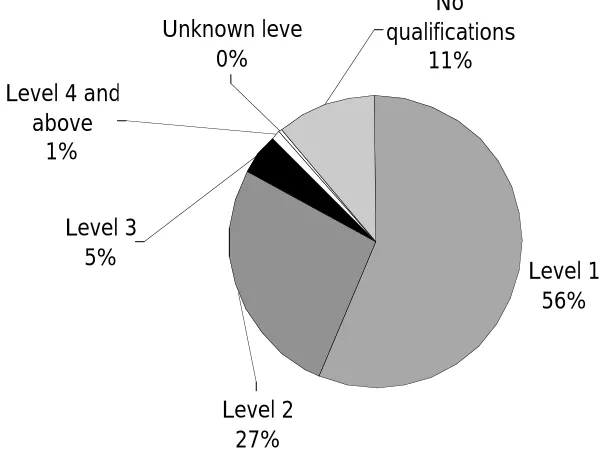
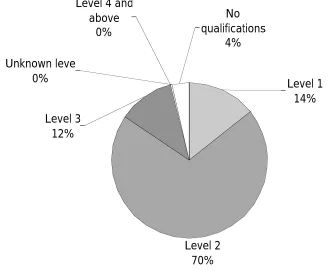
Looking at the types of prior qualifications of ALG awardees, for those studying at level 2: 11% did not have any qualifications at all, and 56% held Level 1
qualifications. For level 3 students: 4% had no qualifications, 14% held level 1 qualifications and the majority (70%) held level 2 qualifications.
5.1.5 What were they studying?
Around 80% of ALG awardees were studying for level 3 qualifications, and 20% were studying for level 2 qualifications. 45% of level 2 ALG recipients were studying NVQs, 25% for EdExcel/BTEC qualifications, 23% were studying other vocational qualifications and 11% were studying GCSEs (note that some students were studying for more than one qualification). For level 3 students: 40% were studying EdExcel/BTEC qualifications; 30% were studying other vocational qualifications; 20% were studying A or AS levels; and 23% were on Access to HE courses.
A wide variety of subjects were being studied. The most popular subjects studied were: Arts, Media and publicity (14%), Health, Public Services and Care (11%), Preparation for life and work (11%), Business Administration and Law (9%) and ICT (8%).
5.2 Choosing a course
ALG awardees and eligible non-applicants tended to have a very positive attitude towards learning. 96% of awardees agreed with “education is an investment in your future” and 93% agreed with “learning is something you should do throughout your life”. The evaluation showed that some people who had a bad experience at school were not necessarily lost as learners. 19% of awardees agreed with “I didn’t get anything useful out of school”. The groups who were most likely to agree with this statement were: over 25s, people who were living with partners, and people studying for a level 2 qualification.
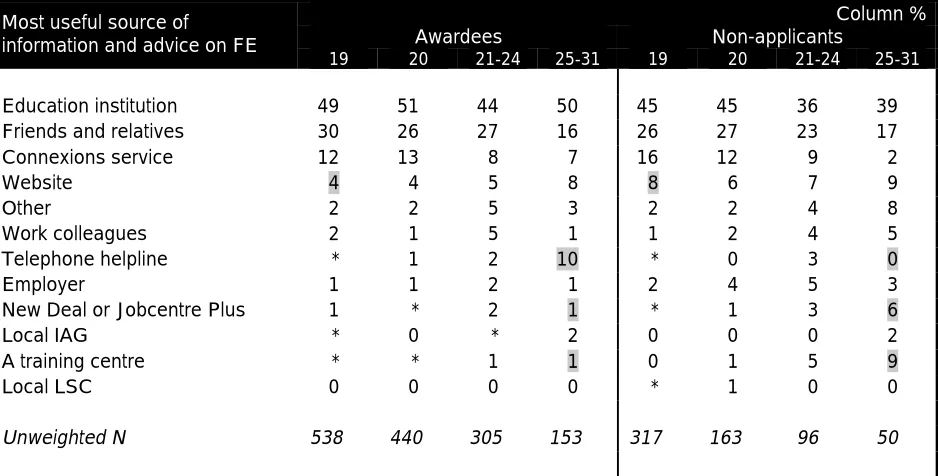
Learners most commonly used an education institution (76%), and family/friends (61%) as sources of information, advice and guidance (IAG) on FE courses. In terms of usefulness of IAG sources, the most useful sources were: education
Nearly all students were enrolled on the course for job-related reasons. Only 4% of students were enrolled on courses related to their current job, but 89% of awardees said their course would help with a job they were thinking of doing in the future. When asked more specifically, the most common reasons for study given by awardees (in old pilot areas) were: to develop a career (93%), to get more
satisfaction from work (70%), to get a new job (58%), and to change to a different career (54%). 95% of awardees said they intended to get a job in the future where they would use some or all of the skills attained on the course.
5.3 Costs and funding of learning
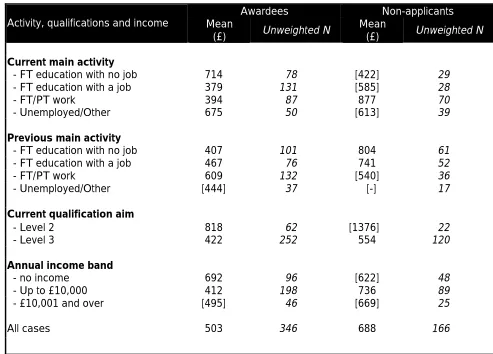
ALG awardees were not automatically entitled to fee remission. Whether or not they received fee remission depended on their personal circumstances and in the policy operated in the local area and college. Around 25% of ALG awardees paid some of their course fees in Bedfordshire, Devon & Cornwall, Leicestershire and London West (which is similar to the percentage of all FE students who pay course fees), whereas less than 12% paid fees in the other six old pilot areas. The pattern of fee remission by area was similar for non-applicants, and was very similar with the pattern observed in 2003/4.
Awardees were more likely to pay tuition fees in new areas than in old areas (28% compared to 16%). Again, some LLSCs only charged fees for a small proportion of students (Tees Valley (6%) and Tyne & Wear (4%), whereas other areas charged much higher fees to their students. Overall, as in 2003/4, learners were more likely to pay tuition fees if they were aged 20 or above.
Awardees who paid fees said they paid an average of £503 compared to an average of £688 for non-applicants. This represents a 40% increase on the amount reported for 2003/4. 20% of awardees paid registration fees and 11% paid exam fees. This was similar to the proportion of non-applicants who paid, and wasn’t significantly different to the 2003/4 situation.
Some of the marketing of ALG was aimed at students who had recently received Education Maintenance Allowance (EMA). 72% of awardees aged 19-21 had heard of EMA (compared to 61% of non-applicants). 25% of awardees (aged 19-21) had applied for EMA and 19% had received it. The corresponding figures for non-applicants were four percentage points lower.
5.4 Applying for ALG, and how ALG was spent
Most ALG applicants said they had obtained an ALG application pack from a college or an education institution (94%). Nearly one-half of awardees in old pilot areas and just over one-third in new areas received no help or advice on their application for ALG, compared to two-thirds of awardees in 2003/4. The most common sources of help for ALG application were student services/advisors (23%), parents (13%), and course tutors or teachers (10%). The vast majority of awardees did not use the ALG telephone helpline (85%) but most of those who did found it very or fairly useful.
equipment; 71% on course-related travel, 40% on bills, 40% on leisure, and 19% on rent or mortgage. The pattern in new pilot areas was similar. Compared to 2003/4, more recipients were spending their grant on rent/mortgage and bills.
Not surprisingly, older learners, and people not living with their parents were more likely to use their grant for paying rent/mortgage and bills. In old pilot areas, recipients of Asian or Asian British ethnic origin were the most likely to report
spending their payments on course books (85%), recipients of Black or Black British ethnic origin were the most likely to say they spent their ALG on travel (87%), and White recipients were the most likely to report spending ALG on rent or mortgage (21%) compared to other ethnic groups.
5.5 What difference does ALG make?
Recipients of ALG were asked whether ALG had influenced their decisions to study, whether to study full - or part-time, and whether they believed they would have dropped out of the course without the grant.
ALG has achieved some additionality as 11% of recipients in old pilot areas said they probably or definitely would not have gone ahead with their course without ALG. In new pilot areas, only 7% said they probably or definitely would not have gone ahead with the course without ALG but this reflects the lower level of marketing in the new areas.
One-third of recipients in old areas and one-quarter in new areas said they would have studied part-time without ALG. In old areas, 38% of recipients studying for qualifications at Level 2 said they would definitely/probably have studied part-time without ALG (compared to 28% for recipients studying at Level 3).
ALG has had considerable impact on student retention. 18% of ALG recipients in old pilot areas said they would definitely/probably have dropped out of the course
without ALG (compared to 16% in new pilot areas). The groups most likely to drop out without ALG included: Level 2 students (25%); recipients aged 21-24 (22%); recipients in full-time education without a job (21%); and recipients with no income (21%). These figures are for recipients in old pilot areas, the pattern was similar in new pilot areas.
5.6 Conclusions
Evidence suggests that ALG continues to be attractive to young learners with few financial responsibilities (i.e. living with parents), and to be more attractive to learners studying at Level 3.
Evidence also suggests that ALG is having a positive effect on learner retention and their decisions to study full-time. A sizeable proportion of recipients said they would have dropped out of their course if they had not received ALG, and that ALG had influenced their decision to study full-time.
1 INTRODUCTION
1.1 The Adult Learning Grant
The Adult Learning Grant (ALG) aims to support adults who have not yet obtained their first Level 2 or first Level 3 qualification. The ALG is intended to help adults with the additional costs of learning (for example, books, travel) through the provision of a means-tested monetary grant. The grant (up to £30 per week paid during term time) is available to learners earning up to £19,000 (or up to £30,000 if the learner cohabits with a partner in paid employment). The grant is subject to strict eligibility criteria and award relies on learners demonstrating that they meet criteria relating to UK residency, age, proposed course of study, level of prior achievement, and that they intend to study at a designated learning provider. The grant is targeted at full-time adult learners studying for their first full Level 2 qualification and aged over 19 years of age, or full-time learners studying for their first full Level 3 qualification and aged between 19 and 30 years of age. The upper age limit will be removed from September 2006. Manchester City Council (MCC) administers the grant. MCC assesses eligibility for the grant and makes weekly term-time payments into learners’ bank accounts, subject to confirmation of full attendance by the relevant learning providers.
The ALG pilot was announced as part of the 2003 Skills Strategy5. In September 2003, ALG was launched in 10 English Learning and Skills Council (LSC) areas: The Black Country, County Durham, Devon and Cornwall, Humberside, Lancashire, Leicestershire, London West, Luton and Bedfordshire, Shropshire, and South
Yorkshire. In 2004/5, two full LSC regions, the North East and South East, were added, so that the ALG now covers 19 local LSC areas. It will be extended into the West Midlands and Yorkshire and Humber regions in 2006/7; and national roll-out is planned for 2008/9.
Table 1.1 Take up of ALG by area for 2004/5
LLSC area Applications Awards applications (%)Success rate of
Old areas
- Bedfordshire and Luton 363 254 70
- The Black Country 514 287 56
- Devon and Cornwall 996 611 61
- Durham 278 211 76
- Humberside 722 438 61
- Lancashire 1400 890 64
- Leicestershire 635 373 59
- London West 630 343 54
- Shropshire 204 134 66
- South Yorkshire 826 475 58
New areas
- Berkshire 72 37 51
- Hampshire and Isle of Wight 339 232 68
- Kent 314 209 67
- Milton Keynes, Oxfordshire and Buckinghamshire
218 126 58
- Surrey 51 33 65
- Sussex 318 192 60
- Northumberland 28 16 57
- Tees valley 237 143 60
- Tyne and Wear 271 171 63
Total 8416 5175 61
1.2 The Evaluation of the Adult Learning Grant
The Centre for Research in Social Policy (CRSP) at Loughborough University and the National Centre for Social Research (NatCen) are evaluating ALG on behalf of the Department for Education and Skills and the National Office of the Learning and Skills Council.
Cohort 1
Cohort 1 comprises learners studying during the 2003/4 academic year in 1 of 10 original pilot areas. Cohort 1 learners were surveyed during the summer of 2004 (Wave 1)6 and again, during the summer of 2005 (Wave 2)7.
Cohort 2
Cohort 2 comprises learners studying during the 2004/5 academic year in 1 of 19 pilot areas – that is, studying during 2004/5 in 1 of the 10 original ALG pilot areas (‘old areas’), or studying during 2004/5 in 1 of the 2004 extended pilot areas (‘new areas’). Learners consist of FE learners applying for ALG for the first time (‘the applicants’), and FE learners screened by age, level and mode of study, and who had not applied for ALG (‘the non-applicants). Cohort 2 learners were surveyed during the summer of 2005 (Wave 1) and will be followed up during the summer of 2006 (Wave 2).
The evaluation has 5 key objectives, to:
1 measure the extent to which ALG improves retention and attainment among the eligible population in pilot areas;
2 determine whether ALG graduates progress to further learning or into
employment and whether there are any associated improvements in their labour market status;
3 examine the effect of ALG on learners’ choices on level of qualification, course, type of learning, and working patterns;
4 determine differences in the performance of ALG between pilot areas, men and women, and young people who are independent and those living with parents; and
5 explore implementation of the ALG at local level and identify good practice.
The report presents findings from Cohort 2 Wave 1, and contributes to objectives 1, 3, and 4.
A second wave survey will report on Cohort 2 learners in 2007, and will present analyses of ALG influence over qualification attainment and transitions in
employment and further learning associated with receipt of ALG (evaluation objectives 1 and 2).
A qualitative study, addressing objective 5, has already been published8.
Surveys were conducted using computer-assisted telephone interviews. The length of interviews averaged 30 minutes.
6 Cohort 1, Wave 1 findings have already been reported to the DfES (see Pound, E., Magadi, M., Michaelson, J., Finch, S., Stafford, B. (2005) Evaluation of the Adult Learning Grant: Cohort 1 Wave 1).
7 Magadi, M. et al., Evaluation of the Adult Learning Grant: Cohort 1 Final Report (forthcoming). 8 Pound, E., Maguire, M., Middleton, S., Ashton-Brooks, K. (2004). ‘A qualitative investigation into the first year (pilot) implementation of the Adult Learning Grant’, Department for Education and Skills Research Brief: RBX12-04, November 2004.
1.3 Cohort 2 Survey Design
This section provides a brief overview of the design of the surveys.
1.3.1 Applicants
‘Applicants’ are a sample of Further Education (FE) learners who had applied for ALG. The sample of ALG applicants was drawn from records held by the
administrative provider, Manchester City Council (MCC). The records contained details of all learners who had applied for ALG as of May 2005.
The sample was grouped according to the eligibility status assigned to each learner by MCC at the time the data were extracted. The eligibility groups are presented in Table 1.2.
Table 1.2 Eligibility groups for ALG
Group Subgroup
1 Eligible for ALG a Approved/eligible waiting approval b Not taken up
c Successful but withdrawn 2 Eligibility not determined/
not known
(included in research)
3 Not eligible a Income too high (included in research) Studying part-time (included in research)
Not studying for first Level 2/3 (included in research) Application refused (excluded from research)
b Studying HE qualification (excluded from research) At college outside pilot areas (excluded from research) Too old (excluded from research)
Too young (excluded from in research) 4 Automatically removed
from sample
Deceased
The learners were then selected with selection probabilities based on eligibility group status. Within each eligibility group, the file was stratified by the local LSC pilot areas, with the same selection probability used for each area. Cohort 2 included learners in the original 10 pilot areas plus an additional 9 local LSC areas.
Table 1.3 Assignment of eligibility groups for Cohort 2 applicant sample
Code Description Eligibility group
APPR Application approved 1a
ELIG Applicant eligible (awaiting approval) 2a
NT Not taken up 1b
WIDR Successful but withdrawn from scheme 1c
ENQ Enquiry on application being made 2b
NOBANK Learner does not have bank account 1a
PEND Application not yet processed 1a
QRY Query on application 2b
QRY2 Query on application 1a
OVER Income too high 3
PTIME Studying part-time 3
QUAL Not studying for first L2/3 3
QUAL2 Not studying for first L2/3 3
QUAL4 Not studying for first L2/3 3
REF Application refused 3
HE Not eligible – studying HE qual 3
NLLSC College outside scheme 3
OAGE Too old 3
UAGE Too young 3
DECD Learner deceased 4
Following the assignment to eligibility groups, the following steps were taken in drawing the applicant sample for Cohort 2:
1 All those within categories 3 (not eligible) and 4 (automatically removed from the sample) – totalling 2,620 cases – were excluded.
2 2 cases were dropped for missing information on LSC area.
3 503 cases were dropped for failing to meet the age criteria of at least 19 on 1st February 2005 and no older than 30 on 31st August 2004.
4 880 cases were dropped for having no phone number.
5 569 cases were dropped because it was not their first year of application for ALG. 6 The 3,637 cases remaining were divided into ‘old’ or ‘new’ area.
7 Within each area, the sample was stratified by qualification level9 within ‘LSC area’. A sample of 2500 was drawn from the ‘old area’ group and all cases (932) were taken from the ‘new area’ group10.
1.3.2 Non-applicants
‘Non-applicants’ are a sample of FE learners in the same pilot areas who had not applied for ALG, but were eligible for the grant based on their learning mode, qualifications and age.
The aim was to draw a sample of learners who had not applied for ALG but who would nevertheless be, as far as could be ascertained, eligible to receive ALG.
(Eligibility on income grounds could not be determined in the sample design). The non-applicant sample was drawn from the Individualised Learner Record (ILR) held by the LSC, from the database with details of all qualifications being studied for by learners within further education (FE). As the records on the database were at the level of individual qualifications, rather than learners, 2 stages of work on the sample were required: first, constructing a sample frame of eligible learners and then
drawing a sample.
Constructing the sample frame
Further work was undertaken on the file:
• Duplicate cases based on learner name, date of birth and qualification were removed.
• The file was ‘flattened’; a process which converted the data from qualification-level to learner-qualification-level.
• Filters were applied for age and mode of study such that learners were only included if they were studying full-time and aged at least 19 by 1 February 2005 and no older than 30 on 31 August 2004.
Records were then removed from the file based on qualification details. The qualification records for each learner were grouped together and a filter applied to learners based on the qualification types they were studying. The filter criteria were as follows. A learner was only included in the file if:
• at least one of the qualifications they were studying was at NVQ Level 2 or 3, • AND one of the following conditions (based on variables imported from the LAD)
applied to the qualification: EITHER
• the qualification had a notional NVQ width of 100, • OR the awarding body was City and Guild,
• OR the Learning Aim Type Code was one of the values listed in Table 1.4 below.
Further records were removed from the file as follows:
• Those identified as ALG applicants (either through a flag on the ILR data or by matching to MCC files) were removed, as were those who appeared in the cohort 1 non-applicant sample.
• Cases were deleted where the postcode was blank, the address was foreign or the phone number was missing.
Table 1.4 Learning Aim Codes of Qualifications at Level 2 or 3 included in the Sample File irrespective of width or awarding body
Learning Aim
Type Code Learning Aim Type Description
0001 GCE AS level
0002 GCE A level
0006 Diploma
0009 Advanced Certificate
0016 Certificate
0024 Higher Diploma
0030 National Certificate
0033 BTEC/EDEXCEL Professional Development Qualification
0035 GNVQ
0036 NVQ
0067 Technicians Certificate 0111 Professional Diploma
0117 Advanced Diploma (also RSA) 0128 Intermediate Certificate
0136 Level 2
0137 Level 3
1413 GCE A2 Level
1414 Conversion from Advanced Subsidiary VCE to Advanced VCE 1415 Conversion from Advanced VCE to Advanced VCE (Double Award) 1416 Advanced Subsidiary VCE
1417 Advanced VCE
1418 Advanced VCE (Double Award) 1421 Edexcel National Award
1423 Edexcel First Diploma (new syllabus) 1424 Edexcel National Certificate (new syllabus) 1425 Edexcel National Diploma (new syllabus)
1429 AES NVQ Equivalents
2006 Intermediate Award
2007 Advanced Award
1.3.3 Response and weighting
Applicants
The total number of full achieved interviews was 2,248, which was a response rate of 66% the issued sample of 3,432. Weights were calculated to correct for unequal probabilities of selection (learners in old LSC areas had a lower chance of being included in the sample) and for potential biases due to non-response – response rates varied by region, age and sex.
Non-applicants
During fieldwork, 132 cases were removed for being duplicates with the applicant sample. The total number of full achieved interviews was 1,004, which is a response rate of 29% of the revised issued sample of 3,440. As with Cohort 1, this low
ALG (3% of the sample) and for qualifications being too high (20% of the sample). The procedure for deriving weights for the Cohort 2 non-applicants mirrored that for the Cohort 2 applicants. The weight derived, therefore, took into account the greater likelihood of learners in old LSC areas being selected and potential biases due to non-response on the basis of region, age and sex.
1.4 Structure of the Report
The report presents findings from Cohort 2 Wave 1.
Where relevant, chapters compare ‘non-applicants’ with sub-groups of the ‘applicant’ sample: ‘Awardees’ (‘applicants’ awarded ALG) and ‘Recipients’ (defined as
awardees who were receiving ALG payments at the time of survey or had received at least 1 payment before they were stopped or withheld). ‘Old’ and ‘new’ areas have been analysed separately to enable comparisons between the areas. In addition, analysing ‘old’ and ‘new’ areas separately enables cohort comparisons in ‘old’ areas only.
There are 6 substantive chapters:
Chapter 2 describes the background characteristics of applicants, awardees and non-applicants, including age, gender and ethnicity, current and previous main activities and courses being studied.
Chapter 3 examines awardees’ and non-applicants’ attitudes towards learning, their experiences of finding information, advice and guidance on further education from various sources, and their reasons for studying.
Chapter 4 reports the costs and funding of learning among awardees and non-applicants.
Chapter 5 reports awardees’ experiences of applying for and receiving ALG, including the ways in which their ALG was spent.
Chapter 6 examines recipients’ perceptions of the influence of ALG on their
decisions to take up study, to study full-time or part-time, and to continue the course.
Chapters 2-6 each provide a summary of key findings.
Chapter 7 presents overall conclusions from the Cohort 2 Wave 1 findings.
1.4.1 Report conventions
a) Throughout the report, percentages based on fewer than 50 cases are enclosed in square brackets, and should be interpreted with caution (those based on fewer than 20 cases are not presented and shown as [-]).
b) All percentages are weighted, while number of cases reflect unweighted base populations.
d) Percentages less than 0.5 are shown as ‘*’ to distinguish them from absolute 0.
e) Since the applicants and non-applicant samples were from different sampling frames and used different survey designs, comparisons between the 2 groups or their sub-groups are based on tests for independent samples.
2 BACKGROUND CHARACTERISTICS OF LEARNERS
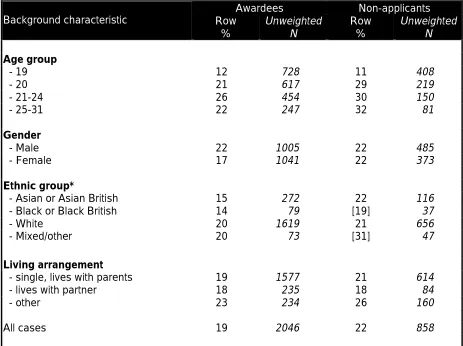
This chapter describes the background characteristics of awardees and non-applicants, including age, gender and ethnicity, living arrangements, current and previous economic activities and courses being studied. Throughout, results are presented for awardees and non-applicants and any significant differences between the profiles of these groups are highlighted. Breakdowns of findings for old and new areas are also shown and significant differences between these areas types are highlighted where relevant. The data are weighted by the separate weights for applicants and non-applicants.
2.1 Definitions of Groups for Analysis
Table 2.1 Breakdown of applicant and awardee samples
Column % Old areas New areas Total
All applicants (excluding those classified by administrator as not eligible)
Awardees 95 95 95
Non-awardees 5 5 5
Unweighted N 1630 618 2248
All awardees
- recipients 87 89 88
- non-recipients 13 11 12
Unweighted N 1546 588 2134
Base: All applicants.
The awardee group was identified by interviewing a sample of ALG applicants which excluded those who were classified by the administrative provider as being not eligible for the grant but included some whose eligibility had not been determined at the time when the sample was drawn. In the interview, 95% of this group of
applicants were found to have been awarded the grant (see Table 2.1). This proportion was the same for both old ALG areas and new areas.
There is no comparable statistic for Cohort 1, for 2 reasons. Firstly, the Cohort 1 study surveyed a wider group of applicants which also included those who had been classified as not eligible for the grant. Second, the Cohort 1 sample included a much higher proportion of cases where eligibility had not yet been determined when the sample was drawn, so comparisons would not be meaningful.
75% of awardees were in old areas and 25% in new areas. This reflects larger numbers of awardees in old areas where the award was more established.
The non-applicant group was made up of learners who were qualification eligible for ALG. 54% of these were from old ALG areas and 46% for new areas.
2.2 General Characteristics
This section describes and compares the socio-demographic characteristics of awardees and non-applicants. Findings for recipients are not shown since these were generally extremely similar to those for awardees. Results are shown
separately for old ALG areas, that is those where the grant was introduced in 2003/4, new ALG areas, where the award was introduced in 2004/5, and total ALG areas.
2.2.1 Age and gender
Table 2.2 Distribution of age at interview of awardees and non-applicants
Column % Age
Awardees Non-applicants
19 37 45
20 26 20
21-24 23 20
25-31 14 15
Unweighted N 2134 930
Base population: All awardees and non-applicants.
The majority of learners in all groups were aged 19 or 20. The age distribution tailed off towards the upper age limit of 31.
Table 2.3 Age groups of awardees and non-applicants by gender and ALG area
Column %
Male Female Total
Age group
Old areas
New
areas Total
Old areas
New
areas Total
Old areas
New
areas Total
Awardees
19 37 29 35 34 29 33 39 32 37
20 34 32 33 26 21 25 27 25 26
21 to 24 22 26 23 23 27 24 21 27 24
25 to 31 7 12 8 18 22 19 13 16 15
Unweighted N 754 292 1046 792 296 1088 1546 588 2134
Non-applicants
19 46 43 45 38 43 40 44 46 45
20 24 28 26 15 23 19 18 22 20
21 to 24 18 19 18 25 21 23 21 19 20
25 to 31 12 10 11 22 14 18 17 12 15
Unweighted N 229 293 522 190 218 408 419 511 930
Base population: All awardees and non-applicants.
The shading refers to significant differences between awardees in old and new areas.
The proportion of awardees aged under 21 was higher in old areas than in new areas (66% compared with 57%). Moreover, the proportion of awardees who were aged under 21 in old areas had increased since the first cohort when 49% of
applicants were aged under 21. This suggests that the age profile of ALG awardees has shifted towards younger adults as the grant has become established.
Female learners comprised just over half of awardees in both old and new areas (53% and 52% respectively). This was in keeping with findings for the first cohort when 54% of the applicants were female.
In old ALG areas, female awardees tended to be slightly older than male awardees (40% of female awardees in old areas were aged 21 or over compared with 29% of male awardees). The same trend was observed in new areas and for the first cohort of applicants in old areas.
2.2.2 Ethnicity
Table 2.4 Ethnicity breakdown of awardees and non-applicants
Column %
Awardees Non-applicants
Ethnicity
Old
areas areasNew Total areasOld areasNew Total
Black 4 2 4 8 2 5
Black of Caribbean origin 2 1 2 3 1 2
Black of African origin 2 1 2 4 2 3
Black of other origin 0 0 0 0 0 0
Asian 16 5 13 19 7 14
Asian of Indian origin 7 1 6 8 2 5
Asian of Pakistani origin 5 2 4 6 3 5
Asian of Bangladeshi origin 1 1 1 1 1 1
Asian of Chinese origin 0 0 0 1 1 1
Asian of other origin 2 0 1 3 1 2
White 76 91 80 66 86 75
Mixed origin 2 1 2 3 2 2
Other origin 1 1 1 4 3 3
Not stated * 0 0 1 0 0
Unweighted N 1546 588 2134 419 511 930
Base population: All awardees and non-applicants.
The ethnic profile of ALG awardees in old areas was comparable with that for the first cohort of learners.
The ethnic profile of awardees in new areas was significantly less diverse: 91% were white, 2% were Black and 5% were Asian. This reflected the different profile of learners in old and new areas as there were also fewer non-white non-applicants in new areas than in old areas.
2.2.3 Family and living arrangements
Table 2.5 Living arrangements of awardees and non-applicants
Column %
Awardees Non-applicants
Living with partner/parents
Old
areas areasNew Total areasOld areasNew Total
Living with partner 11 11 11 13 9 11
Living with parents 76 74 75 61 71 66
Living with both partner and parents 2 1 2 1 1 1
Living with neither partner nor parents 9 9 9 17 14 16
Lives alone 3 4 3 7 5 6
Unknown household * * * 0 * *
Unweighted N 1546 588 2134 419 511 930
Base population: All awardees and non-applicants.
Shading refers to significant differences between awardees and non-applicants.
Three-quarters of awardees lived with their parents (76% in old areas and 74% in new areas). 11% of awardees lived with a partner while 2% lived with both a parent and a partner. 12% lived with neither a parent nor a partner, including 3% who lived alone. This pattern was broadly similar to that observed for awardees in the first cohort of learners.
The proportion of awardees who lived with their parents was significantly higher than that for non-applicants (75% compared with 66%). The difference was greatest in old areas where 76% of awardees lived with their parents compared with only 61% of non-applicants. Awardees were significantly less likely than non-applicants to live with neither a parent nor a partner, including those who lived alone (12% of
Table 2.6 Tenure status of awardees and non-applicants
Column %
Awardees Non-applicants
Tenure
Old areas
New
areas Total
Old areas
New
areas Total
Own or buying the property 6 5 6 5 4 5
Living with parents rent free 56 53 55 48 56 52
Living with parents and paying rent 23 24 24 20 20 20
Renting from council, new town, housing association or privately
11 14 11 21 16 19
Other 1 1 1 3 1 2
Missing 2 3 3 4 1 3
Unweighted N 1546 588 2134 419 511 930
Base population: All awardees and non-applicants.
Shading refers to significant differences between awardees and non-applicants.
When asked about their tenure status, just over half of awardees in old and new areas stated that they were living with their parents rent-free (56% and 53%
respectively), which was comparable with awardees in Cohort 1 (54%). Just under a quarter of awardees in old and new areas (23% and 24% respectively) said they were living with their parents and paying rent, while 11% of awardees in old areas and 14% in new areas stated that they were renting.
Table 2.7 Whether respondents had children aged Under 16 for awardees and non-applicants
Column % Awardees Non-applicants Whether have children under 16
Old areas
New
areas Total
Old areas
New
areas Total
Has a child/children under 16 10 8 10 18 10 14
Has child who lives with respondent 9 8 9 15 9 12 Has child who lives away from respondent 1 * 1 2 1 1 Has both children living with and away from
respondent * 0 * 1 * 1
No children under 16 90 92 90 82 90 86
Missing * * * 0 0 0
Unweighted N 1546 588 2134 419 511 930
Base population: All awardees and non-applicants.
Shading refers to significant differences between awardees and non-applicants.
10% of awardees reported having children aged under 16 and the majority of these lived with their children. The proportion of awardees who had children was similar in old and new areas.
Overall, awardees were significantly less likely than non-applicants to have children aged under 16. This difference was most evident in old areas where 10% of
2.2.4 Parental education level
Table 2.8 Parental education of respondents for awardees and non-applicants
Column % Awardees Non-applicants Level of parental education
Old areas
New
areas Total
Old areas
New
areas Total
Parent who stayed on at school past 16 29 31 30 29 35 32 Parent who stayed at school and got a degree 15 16 15 17 20 18 Parent who stayed at school but got no degree 12 11 12 10 13 11 Parents who stayed on at school – unknown if got
degree
3 4 3 2 3 2
Parents who did not stay on at school 60 58 60 56 52 54
Unknown/Missing 11 11 11 15 13 14
Unweighted N 1546 588 2134 419 511 930
Base population: All awardees and non-applicants.
As was the case for the first cohort of learners, respondents were asked first whether their parents stayed on at school after the age of 16, and those who answered ‘yes’ were then asked whether either of their parents obtained a qualification at degree level or above. The majority of awardees and non-applicants reported that their parents had not stayed on at school. More than 10% of learners were unable to answer the question.
30% of awardees said that they had a parent who had stayed at school past the age of 16, while half of this group (15%) said that a parent had got a degree. There were no significant differences between awardees and non-applicants or between old and new areas for these measures.
2.2.5 Health and disability
In keeping with findings from the first cohort of learners, nearly all awardees in old and new areas (100% and 98% respectively) reported that their health was ‘fair’ to ‘very good’.
13% of awardees in old areas said that they had a disability or long-standing illness and, of these, just under half (47%) felt that it limited their daily activities. Awardees in new areas reported similar levels of disability.
2.2.6 Comparison between survey and administrative data: age, gender, ethnicity
This section compares the profile of ALG awardees who responded to the Wave 1 survey with the group of ALG awardees taken from MCC administrative data used as the sampling frame. This is not the full set of all awardees in the year 2004/05, however this data was received from MCC on 9 May 2005 and would therefore be expected to hold details of the vast majority of ALG applications for the 2004/05 year.
The definition of ‘awardee’ for survey respondents is based on respondents’ answers as to whether or not they had been awarded ALG. The definition for awardees in the administrative data is based on all applicants within the administrative dataset who had been given an ‘eligible’ status (even if they had not yet received payment). This definition for the administrative dataset therefore excludes applicants who were originally included on the sampling frame with an ‘unknown eligibility’ status.
Survey respondent awardees whose awardee status was recorded in the sampling frame are also included in the sample of awardees from the administrative data.
Table 2.9 Gender of ALG awardees, from survey data and administrative data
Column % ALG awardees
Gender
Survey respondents Administrative data
Male 48 47
Female 52 53
Unweighted N 2134 4320
Base: Survey respondent awardees; administrative data awardees.
Table 2.10 Age of ALG awardees, from survey data and administrative data
Column % ALG awardees
Age
Survey respondents Administrative data
19 37 35
20 26 28
21-24 23 24
25-31 14 13
Unweighted N 2134 4230
Base: Survey respondent awardees; administrative data awardees.
The age profiles of survey respondents awardees and administrative data awardees were similar.
Table 2.11 Ethnicity of ALG awardees, from survey data and administrative data
Column % ALG Awardees
Ethnicity
Survey respondents Administrative data
Black 4 3
Black of Caribbean origin 2 1
Black of African origin 2 2
Black of other origin 0 0
Asian 13 11
Asian of Indian origin 6 5
Asian of Pakistani origin 4 4
Asian of Bangladeshi origin 1 1
Asian of Chinese origin 0 0
Asian of other origin 1 1
White 80 67
Mixed origin 2 2
Other origin 1 0
Not stated * 16
Unweighted N 2134 4320
Base: Survey respondent awardees; administrative data awardees.
2.3 Activity Status
2.3.1 Current activity
Table 2.12 Main current activity of awardees and non-applicants, by ALG areas
Column % Awardees Non-applicants Activity status
Old areas
New
areas Total
Old areas
New
areas Total
All in full-time education 58 55 57 30 30 30
Of whom: Full-time education without a job 28 22 26 16 12 14
Of whom: Full-time education with a job 31 33 31 15 17 16
All in part-time education 1 2 1 4 3 3
Of whom: Part-time education without a job * * 0 2 1 2
Of whom: Part-time education with a job 1 2 1 2 1 2
Full-time work 11 12 12 22 24 23
Part-time work 14 18 15 20 23 21
Unemployed and looking for work 9 7 8 13 10 11
Unemployed and not looking for work 1 1 1 1 2 2
Looking after the home or family/taking a holiday
4 3 4 9 7 8
Voluntary work * * 0 1 1 1
Sick or disabled * * 0 1 1 1
Taking a year off/gap year/travelling * * 0 0 * 0
Looking for a place at college * 0 0 * 0 0
Other activity * 0 0 0 0 0
Missing 0 0 0 0 0 0
Unweighted N 1546 588 2134 419 511 930
Base population: All awardees and non-applicants.
Shading refers to significant differences between awardees and non-applicants.
When asked to state their main current activity, the majority of awardees (58% in old areas and 55% in new areas) said they were in full-time education. In old areas this group was fairly evenly divided between those who combined study with a job (31%) and those who had no job (28%). In new areas this group comprised more
awardees who had a job than those who didn’t have 1 (33% compared with 22%).
Just 1% of awardees in old areas and 2% of those in new areas said that their main activity was part-time education (with or without a job).
This activity profile of awardees differed notably from that for non-applicants. Compared to non-applicants, awardees were significantly more likely to be in full-time education (57% compared with 30%). They were significantly less likely than non-applicants to say that their main activity was full-time work, part-time work or looking after the home or family. Overall, 59% of awardees were doing some kind of work, compared to 62% of non-applicants.
Table 2.13 Awardees: activity status by receipt of ALG
Column % Recipients Non-recipients Activity status Currently receives Not yet due Due but delayed Received then withheld or stopped Withheld or stopped from start Decided not to take up Reason for non-receipt not stated Total Full-time education without a job
40 25 [-] 14 17 [24] [33] 26
Full-time education with a job
43 29 [-] 22 12 [26] [33] 31
Part-time education without a job
1 0 [-] 0 0 [0] [0]
Part-time education with a job
1 1 [-] 1 2 [3] [0] 1
Full-time work 4 10 [-] 19 17 [18] [5] 12
Part-time work 5 17 [-] 24 25 [15] [16] 15
Not in education or paid employment
6 18 [-] 21 26 [15] [13] 14
Unweighted N 896 115 15 983 53 34 38 2134
Base population: All awardees.