University of Southern Queensland
Faculty of Engineering & Surveying
Structural Performance of Cross Laminated Timber Panels as
Walls
A dissertation submitted by
Alan Turner
in fulfilment of the requirements of
ENG4112 Research Project
towards the degree of
Bachelor of Civil Engineering
Abstract
Cross Laminated Timber (CLT) is made from dimensional lumber, laminated in layers with the grain in each layer placed orthogonal to the layer before it. The resultant product is not dissimilar to thick plywood.
CLT is made from timber, which is an environmentally attractive option in comparison to the reinforced concrete or steel structures which dominate the multistorey building market sector. Timber is one of the very few sustainable carbon neutral building materials available.
New technology such as advanced Building Information Modeling (BIM) software and high accuracy CNC machinery are giving CLT the advantage over traditional on-site construction methods. Prefabrication is the key to CLT’s improved construction time-frames, far greater quality control, than on-site construction can deliver.
There are no CLT manufacturers currently producing in Australia. Hyne and Son Pty Ltd. is a leading Australian manufacturer and distributor of engineered, structural and decorative softwood products to the building industry. This project forms part of an initial investigation into cross laminated timber wall panels, manufactured from non-structural low grade pine. Initially, the investigations will be directed solely at the low-rise multistorey residential market sector, which Hyne already services with other products.
ii
University of Southern Queensland
Faculty of Engineering and Surveying
ENG4111/2Research Project
Limitations of Use
The Council of the University of Southern Queensland, its Faculty of Engineering and Survey-ing, and the staff of the University of Southern Queensland, do not accept any responsibility for the truth, accuracy or completeness of material contained within or associated with this dissertation.
Persons using all or any part of this material do so at their own risk, and not at the risk of the Council of the University of Southern Queensland, its Faculty of Engineering and Surveying or the staff of the University of Southern Queensland.
This dissertation reports an educational exercise and has no purpose or validity beyond this exercise. The sole purpose of the course pair entitled “Research Project” is to contribute to the overall education within the student’s chosen degree program. This document, the associated hardware, software, drawings, and other material set out in the associated appendices should not be used for any other purpose: if they are so used, it is entirely at the risk of the user.
Prof F Bullen
Dean
Certification of Dissertation
I certify that the ideas, designs and experimental work, results, analyses and conclusions set out in this dissertation are entirely my own effort, except where otherwise indicated and ac-knowledged.
I further certify that the work is original and has not been previously submitted for assessment in any other course or institution, except where specifically stated.
ALAN TURNER
0050063905
Signature
Acknowledgments
I would like to acknowledge Associate Professor Karu Karunasena for his technical support, patience, availability and direction throughout the project. Equally, I would like to acknowl-edge Geoff Stringer, Stephen Bolden and Tony Dakin from Hyne and Son Pty Ltd for the technical support, provision of test materials and valuable time. I am indebted to my family and especially my wife for the tolerance, support and assistance provided.
ALAN TURNER
University of Southern Queensland
Contents
Abstract i
Acknowledgments v
List of Figures x
List of Tables xiii
Chapter 1 Introduction 1
1.1 Outline of the Study . . . 1
1.2 Introduction . . . 2
1.3 Aim and Scope . . . 2
1.4 Research Objectives . . . 3
1.5 Thesis Overview . . . 3
Chapter 2 Literature Review 5 2.1 History of CLT Panels . . . 5
CONTENTS vii
2.3 Timber Properties and Stress Grading . . . 7
2.3.1 Homogenisation and Engineered Wood Products . . . 8
2.3.2 Effects of Moisture . . . 10
2.3.3 Duration of Load (DOL) Effects . . . 11
2.4 Design for Fire . . . 11
2.5 Wall Panel Axial In-Plane Loading . . . 14
2.6 Wall Panel Raking Resistance (In-Plane Shear Capacity) . . . 16
2.7 Accepted Theory - Stability and Buckling . . . 16
Chapter 3 Finite Element Analysis 21 3.1 Introduction . . . 21
3.2 Properties of Dimensional Timber . . . 22
3.3 Calculation of Nominal Wall Loads . . . 27
3.4 Trial CLT Layups . . . 30
3.5 The Finite Element Model . . . 32
3.5.1 Model Geometry and Material Properties . . . 32
3.5.2 Forces and Restraints . . . 36
3.6 Model Sensitivity and Boundary Conditions Check . . . 39
3.7 Results of Finite Element Analysis . . . 40
3.7.1 Trial CLT Finite Element Analysis Results . . . 41
CONTENTS viii
3.8 Summary of FEA and Selection of Trial Experimental CLT Layup . . . 45
Chapter 4 Experimental Design 47 4.1 Introduction . . . 47
4.1.1 Materials . . . 48
4.1.2 Sample Fabrication Procedure . . . 49
4.2 Axial Load Capacity of CLT Wall Panels . . . 51
4.2.1 Introduction . . . 51
4.2.2 Test Procedure . . . 52
4.3 Effective Modulus of Elasticity of CLT Wall Panels . . . 58
4.3.1 Introduction . . . 58
4.3.2 Test Equipment . . . 61
Chapter 5 Results and Discussion 63 5.1 Axial Load Test Results and Discussion . . . 63
5.2 Four Point Bending Test Results and Discussion . . . 69
5.3 AS1720.1 Appendix I - Buckling Strength of Plywood Diaphragms . . . 75
5.4 Development of Load vs Height Charts for the CLT Sample Panel . . . 79
Chapter 6 Conclusions and Further Work 81 6.1 Summary . . . 81
CONTENTS ix
6.3 Conclusion . . . 84
6.4 Recommendations and Further Work . . . 84
References 85
Chapter 7 Project Specification 90
Chapter 8 Moisture Content and Acoustic Modulus of Elasticity 93
Chapter 9 MATLAB Source Code 95
9.1 Load Vs Displacement Experimental Data Plotting Programs . . . 95
9.2 Secant Formula Buckling Linear Load Calculation Program . . . 98
List of Figures
2.1 Stadhaus Building, London 2010 (Tall Timber Buildings The Stradhaus,
Hox-ton, London2010) . . . 6
2.2 Probability Density Functions for Glulam and Solid Timber (Thelandersson & Larsen 2003, p.19) . . . 9
2.3 Glulam Beam . . . 9
2.4 Shrinkage and Distortion Relative to Parent Log (U.S. Department of Agricul-ture, Forest Service, Forest Products Laboratory 2010, p.4-5) . . . 11
2.5 Timber Building of The Era (Robinson 2010) . . . 12
2.6 Stable and Unstable Systems . . . 17
2.7 Stability Factor VS Slenderness Factor (Standards Australia 2010b, p.32) . . . 19
3.1 Nominal Residential Unit Building . . . 28
3.2 Trial CLT Cross Sections . . . 31
3.3 Transformed Material Properties for Vertical CLT Lamella . . . 33
3.4 Transformed Material Properties for Horizontal CLT Lamella . . . 34
LIST OF FIGURES xi
3.6 Strand7 Orthotropic Block Element Material 2 . . . 36
3.7 I-Joist to CLT Wall Panel Connection(Pryda Australia 2009) . . . 37
3.8 Wall Top Edge Local Deflection . . . 37
3.9 Strand7 Rigid Link Example (Strand7 Pty Ltd 2010) . . . 38
3.10 Trial 1 Rigid Links, Node Restraints and Unit Load . . . 39
3.11 Critical Buckling Mode Shapes . . . 42
3.12 Trial 1 CLT Layup Model and Associated Subdivided Model . . . 44
3.13 Trial 1 CLT Layup Model and Associated Boundary Condition Check Model . 45 4.1 Locations of 25 mm×90 mm Boards within Parent Log . . . 48
4.2 Wagner Moisture Meter . . . 49
4.3 Assembly of CLT Panel . . . 50
4.4 CLT Samples Fabricated by Hyne . . . 51
4.5 Axial Load Test, Loads of Interest . . . 52
4.6 Load Application and Vertical Deflection Measurement . . . 54
4.7 Safety Cage, load cell and Sample Panels . . . 55
4.8 Test Equipment Setup . . . 57
4.9 Four Point Bending Test (Standards Australia 2010a) . . . 58
4.10 CLT VS AS4063.1 Sample Cross Section Notation (Standards Australia 2010a, p.5) . . . 59
LIST OF FIGURES xii
4.12 Four Point Bending Test Equipment . . . 62
5.1 Sample 1, Post Ultimate Load Deflection . . . 64
5.2 Sample 2. Photo Sequence . . . 65
5.3 Axial Load VS Vertical Displacement . . . 67
5.4 Axial Load VS Mid-Height Horizontal Displacement . . . 68
5.5 Fracture Path for Samples Two and Three . . . 69
5.6 Sample Three Delaminated Glue Surface . . . 70
5.7 Four Point Bending Test:Elastic Region . . . 71
5.8 Four Point Bending Test: Post Failure . . . 72
5.9 Delamination of CLT Due To Flexural Shear . . . 72
5.10 Shear Force and Bending Moment Diagram (American Forest and Paper Association, Inc., American Wood Council 2007, p.8) . . . 73
5.11 Load VS Displacement Plot: Four Point Bending Test . . . 74
5.12 Plywood Cross Section and Notation(Standards Australia 2010b, p.167) . . . . 77
5.13 Hyne CLT Theoretical Height Vs Lineal Load Plot for Various Eccentricities . 80
List of Tables
3.1 Mechanical Properties of Timber used in Hyne CLT fabrication . . . 24
3.2 Orthotropic Elastic Properties of Slash Pine . . . 26
3.3 Roof Dead Loads . . . 27
3.4 Floor Dead Loads . . . 28
3.5 FEA Material Properties Summary . . . 35
3.6 Node Restraint Conditions (F=Fixed R=Released) . . . 40
3.7 Trial CLT Layup Linear Buckling Capacity Results . . . 41
3.8 Trial CLT Layup Design Buckling Load Capacities . . . 43
Nomenclature
BCA Building Code of Australia CLT Cross Laminated Timber EWP Engineered Wood Product FEA Finite Element Analysis LVL Laminated Veneer Lumber
Chapter 1
Introduction
1.1
Outline of the Study
Cross Laminated Timber (CLT) panels are fabricated from strips of timber, laminated together in layers with the grain direction of each lamella orthogonal to that before.
According to B&K (B & K Cross Laminated Timber2010),existing CLT wall panels currently on the market in Europe range from 57 mm to 300 mm in thickness, and consist of between three and nine laminates. The overall size of each panel is dependent on fabrication facilities and transportable size limitations.
Typically each CLT panel is prefabricated with penetrations for doors and windows already cut, ready for installation by way of simple screwed connections on site.
Prefabrication of wall panels reduces construction time and, therefore, costs in comparison with other commonly used construction materials. Costs may be further reduced by utilising non-structural grade timber in the manufacture of the CLT panels.
1.2 Introduction 2
1.2
Introduction
This project investigates the structural performance of CLT panels manufactured from non-structural grade Hyne timber for use in both internal and external load bearing wall applica-tions. The performance of the CLT panels for wall applications is measured in terms of ultimate strength and serviceability.
External and internal load bearing walls serve to transfer the load from the structure above to the structure below and to resist raking loads from earthquake and wind load actions. Serviceability of CLT panels encompasses the effects of moisture, allowable deflection and fire.
The challenge is to identify firstly an ’optimal’ CLT lay-up for Hyne and Son Pty Ltd in terms of the specific said application, and then fabricate and test samples to ascertain if the selected layup performs as predicted.
Wall loading for strength includes in-plane axial compression, bracing capacity (in-plane shear) and load transfer around penetrations. Serviceability aspects investigated include deflection, fire resistance and the effects of moisture.
1.3
Aim and Scope
Broadly, the aim of this project is to analyse the structural performance of CLT panels manu-factured from non-structural grade timber, for internal and external wall applications in terms of serviceability and strength.
The scope of the project is limited to the application of CLT wall panels for low-rise multi-storey buildings up to three multi-storeys high, and to commercial and industrial buildings, including tilt-slab concrete buildings. Loads applied to the CLT panel will be those applied in the design of a typical three storey residential building in Australia.
1.4 Research Objectives 3
As no Australian Standard existed for the fabrication or use of CLT wall panels, a compari-son between the accepted existing standards for plywood in plane diaphragm loading with the results of the laboratory testing, is included for assessment of implementation using existing standards.
The method of manufacture of CLT wall panels, and fabrication of the sample CLT panels does not form part of the scope for this project, as it is mainly concerned with the structural performance of the CLT panels. Wall raking resistance is specifically excluded from the scope of this project.
1.4
Research Objectives
The specific objectives of the project are to:
1. Research background information relating to the structural performance of cross lami-nated timber for wall applications. The research will include fire resistance, deflection and ultimate strength prediction of CLT panels.
2. Undertake Finite Element Analysis (FEA) to investigate the structural properties of a number of CLT cross sections which Hyne can feasibly produce, followed by a subse-quent evaluation and selection of a CLT panel cross section for fabrication and strength testing.
3. Undertake strength testing and compare theoretical results with actual load test results, and also with accepted formulae from AS1720.1 Appendix I - Buckling Strength of Plywood Diaphragms. For serviceability, the aim is to provide theoretical internal and external CLT wall load charts for various common wall heights and report on the effects of fire.
1.5
Thesis Overview
1.5 Thesis Overview 4 Chapter 2 is an in-depth literature review, which investigates all available literature on the design and serviceability aspects of CLT wall panels. This chapter provides background on existing regulations, timber serviceability with respect to moisture, design for fire, and accepted buckling and stability theory.
Chapter 3 is involved with the selection of a trial CLT layup for experimental testing. Fi-nite Element Analysis (FEA)is used to ascertain the buckling strength of a number of different CLT panel layups, and the results compared.
Chapter 4 describes the experimental designs, how they were selected and developed for use in this project. Experiments were developed to determine the axial strength and section properties of the CLT sample selected in the previous chapter.
Chapter 5 Covers the results and discussion of experiments conducted at the University of Southern Queensland. This chapter also reviews AS1720.1 Appendix I - Buckling Strength of Plywood Diaphragms to see if the accepted formula for the design of plywood di-aphragms can be applied to CLT. A theoretical wall load vs height chart, for various load and material eccentricities is included.
Chapter 6 Concludes the dissertation and suggests areas of further work.
Chapter 2
Literature Review
2.1
History of CLT Panels
Cross Laminated Timber (CLT) panels provide many new possibilities for the efficient and environmentally sustainable construction of houses and buildings. The product has been avail-able overseas since it’s development in the 1970’s (Building with Timber - Nine Storeys and Beyond2010), and is still considered an emerging technology as different construction method-ologies are tested and new capabilities identified.
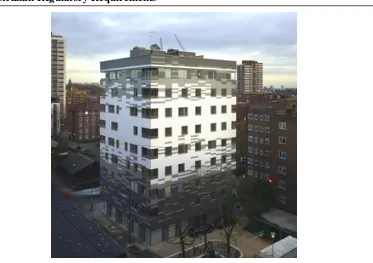
A recent swing away from prescriptive building codes has allowed the introduction of alter-native building materials such as CLT. One example of CLT implementation in the UK is the Stadhaus building, Hoxton London. Standing at nine storeys, and completed in January 2009, it is the tallest pure timber building in the world.The completed Stadhaus building is show in figure 2.1.
Current design practice for CLT, as employed by the engineering group, Techniker, is to pre-fabricate as large as is transportable panels and install on site directly with simple connection details.
2.2 Australian Regulatory Requirements 6
Figure 2.1: Stadhaus Building, London 2010 (Tall Timber Buildings The Stradhaus, Hoxton,
London2010)
mostly of angle cleats and long screws. This type of connection facilitates rapid installation.
2.2
Australian Regulatory Requirements
For implementation in Australia, the material must be designed such that it complies with the Building Code of Australia (BCA), which is the governing regulatory Code to which buildings must be constructed.
2.3 Timber Properties and Stress Grading 7
2.3
Timber Properties and Stress Grading
There are large variations between the structural properties of clear wood and the structural properties of timber. In this paper, timber is the term given to structural elements which in-cludes the irregularities and defects such as knots, zones of compression wood, oblique fibre orientation etc.
For the characteristics of the timber to be determined in a reliable way, multiple samples must be tested in accordance with standardised test procedures, and statistical methods used to de-termine structural properties (Thelandersson & Larsen 2003, p.30). The properties can then be used in the calculation of the moment, tension, compression and shear capacity of the structural element by way of elastic theory.
The theory of elasticity, of course, is only representative if the strength properties used are accurate for the load type applied. This is of particular relevance to timber due to it’s anisotropic and non-homogenized nature, and explains, for example, why the characteristic bending tensile strength is used for bending, and characteristic tensile strength is used for pure axial tensile loading. The influence of the defects within the timber is included in the strength properties used.
Knots are the cause of the largest portion of failures, however other defects such as top rup-ture, compression wood, grain slope, decay, bark and gum pockets, wane, holes and splits or a combination of same also contribute. Determining the modulus of elasticity is the single most effective way of determining the strength characteristics of timber because it includes informa-tion regarding the clear wood properties, knots, slope of grain and other characteristics.
Additional grading information which can be incorporated with the modulus of elasticity to more accurately grade timber includes narrow and wide face knot size and locations, ring width and density among others (Thelandersson & Larsen 2003, p.30).
thick-2.3 Timber Properties and Stress Grading 8
ness of the timber which can be graded because faults or irregularities within the timber are undetectable (Thelandersson & Larsen 2003, p.30).
Typical machine grading usually incorporates a flat-wise bending test to determine the modu-lus of elasticity, and may include density measurement by radiation and/or knot detection by optical detection. The stiffness can then be accurately determined using the following formula:
EI = P ·l
3
48·δ
WherePis the applied load,lis the span between supports andδis the deflection (Thelandersson & Larsen 2003, p.34).
Machine bend testing of CLT wall panels is unrealistic due to the size of prefabricated wall panels. Another method of determining the modulus of elasticity is to measure the natural frequency of the timber, and to this end, a fully automated procedure for determining the global elastic properties of full-scale CLT panels has been developed by Gsell et.al (Gsell, Feltrin, Schubert, Steiger & Motavalli 2007).
2.3.1 Homogenisation and Engineered Wood Products
The term Engineered Wood Product (EWP) is a broad term that includes material typically made from smaller wood elements such as veneers and laminates. Commonly available EWP’s include Laminated Veneer Lumber (LVL), plywood, glue laminated timber and I-beams.
CLT also falls into the category of EWP because it is made from laminations which have been glued together. The advantages of EWP over dimensioned timber are that they are typically dimensionally stable, and can be produced in required dimensions not limited by the individual element sizes.(Thelandersson & Larsen 2003, p.18)
2.3 Timber Properties and Stress Grading 9
Figure 2.2: Probability Density Functions for Glulam and Solid Timber (Thelandersson & Larsen
2003, p.19)
Considering that CLT panels are made from dimensioned timber, it is not unreasonable to assume that there is a relationship between the strength of the individual elements and the effective strength of the CLT panel.
Two options available for predicting the strength properties of CLT panels of various thick-nesses and lamella are firstly to produce sufficient samples such that the properties can be determined statistically, and secondly, to use a method which uses the strength properties of the individual elements to determine the strength characteristics.
2.3 Timber Properties and Stress Grading 10
The second method is more difficult to accurately achieve for CLT panels than, for example, glue laminated (Glulam) beams indicated in figure 2.3, because of the composite nature of the orthogonally placed lamella.
For Glulam beams, the typical failure mode for bending is tensile failure of the outer lami-nate. Laminating increases the bending strength above the pure tensile strength of the lam-inates. The ratio of tensile bending strength to tensile strength is called the laminating fac-tor (Thelandersson & Larsen 2003, p.69).
The Glulam strength increase is attributed to homogenisation of defects, and by reinforcement of defective areas by adjacent laminates. Some CLT panels are constructed in only three layers, and this presents a different case than for Glulam, which typically comprises many more layers.
To substantially increase the bending tensile strength by laminating would require outside lamella thickness to be reduced to less than 10mm (Thelandersson & Larsen 2003, p.71). CLT wall elements effectively load share along the length of the panel when loaded in plane and in bending, however unless more than three laminates are used, it is unlikely that the effective strength will be higher than that of the timber elements from which it is made.
In Australia, Glue Laminated Timber is fabricated to AS/NZS 1328, and establishment of char-acteristic properties of glulam is performed using AS/NZS 4063.
2.3.2 Effects of Moisture
The dimension stability of the timber is relative to the moisture shrinkage. Shrinkage strains are much larger perpendicular to the grain than parallel to the grain, and also much larger tangentially than radially. Characteristic shrinkage and distortion of timber elements in relation to their location in the parent log from which they were sawn are indicated in figure 2.4
2.4 Design for Fire 11
Figure 2.4: Shrinkage and Distortion Relative to Parent Log (U.S. Department of Agriculture,
Forest Service, Forest Products Laboratory 2010, p.4-5)
The CLT samples provided by Hyne and Son Pty Ltd were backsawn, and therefore are subject to cupping due to the moisture gradient between the air and the timber, unless sufficiently sealed against moisture ingress. It is likely that moisture cracks will occur parallel with the grain on the exterior lamella of the CLT wall panels, and therefore the shear capacity should not be relied upon parallel to the grain.
2.3.3 Duration of Load (DOL) Effects
The strength of timber also depends on the duration and rate of loading. AS1720.1 1997 defines duration load factors for five seconds, five minutes, five weeks, five months and fifty years, with load factors ranging from 1.0 for five second wind gusts to 0.57 for permanent loads. The long term load factor is a result of the significant loss of strength timber undergoes when subject to load for long periods of time.
2.4
Design for Fire
2.4 Design for Fire 12
people were left homeless in a dreadful and uncontrollable fire (Robinson 2010). Prior to that time, most of the buildings in Europe were of timber construction.
After the fire, new legislation was enacted (The Rebuilding Act 1667), which prescribed that the outsides of all buildings should be made of bricks or stone (Museum of London 2010)
Figure 2.5: Timber Building of The Era (Robinson 2010)
It should be noted that there were a number of contributing factors to the disaster, apart from the use of timber in the building structure, which the Rebuilding Act 1667 recognises. Houses prior to the great fire encouraged the spread of fire by close placement of dwellings, having disorderly design with no partitions between dwellings, overhangs out over the small lane-ways and overhangs over other properties. A typical Low-rise multistorey dwelling which was claimed by the great fire is shown in figure 2.5.
The main points of the Act called for wider roads and lane-ways, fire separating brick walls around properties with minimum separation distances specified, no overhangs or balconies outside the boundary of the property unless protruding over a street, and construction of the boundary walls to be made from stone or masonry.
2.4 Design for Fire 13
then it has met the requirements of the Act. The Building Code of Australia (BCA) is a non-prescriptive code, which shares a remarkable resemblance to the Rebuilding Act 1667, in that it recognises classes of buildings and contains similar requirements which limit the spread of fire.
The BCA requires that compliance of the Fire Resistance Level (FRL) be provided in either a report from a Registered Testing Authority, stating that the material complies with the standard fire test, or alternatively is designed in accordance with AS1720.4 if it is a solid or glued-laminated timber structure (Australian Building Codes Board 2010, p.25).
Much published research is already available on the effects of fire to exposed CLT. In na-ture, large trees and logs can resist the effects of fire by charring. Pyrolysis is a chemical decomposition reaction timber undergoes when exposed to temperatures around 150◦deg C to 200◦ deg C. The gases produced by the pyrolysis reaction are combustible. The char-layers which form once the timber is ignited have excellent insulating properties which protect the timber.
Designing for fire typically involves adding a redundant thickness to the CLT wall panel. The additional thickness of material required is dependant on the required FRL.
A charring rate is the rate at which char is formed and is proportional to the temperature. Ac-cording to AS1720.4 (Standards Australia 2010c, p.8), the notional charring rate for untreated timber exposed to fire is:
c= 0.4 +280
δ
2
(2.1)
and
dc =ct+ 7.5 (2.2)
where:
2.5 Wall Panel Axial In-Plane Loading 14
δ= timber density at 12% moisture content
dc= effective depth of charring
t= time period in minutes
It should be noted that AS1720.4 only applies to Glued Laminated Timber fabricated with phenol, resorcinol, phenol resorcinol or poly-phenolic glues.
Results from a recent study by Wilinder (Wilinder 2009, p.38) indicate that the charring rate of CLT is similar to that of solid wood as calculated by EN1995 1-2 for a solid beam burning on one side only.
It follows that for CLT constructed of Pine, with a density of 600 kg/m3, the charring ratec
is approximately 0.61 millimeters per minute. Further, for a nominal building constructed of CLT requiring a 30 min fire resistance level, a 26 mm additional thickness is required.
2.5
Wall Panel Axial In-Plane Loading
Timber framed wall elements of buildings are typically between 2.7m and 3.0m tall for single and multistorey construction alike, and so depending on the CLT geometry, the panel may be considered slender in some circumstances.
For low-rise multistorey construction, the floor is typically placed directly over the timber walls beneath (platform construction), to ensure in-plane loading is achieved(Tall Timber Buildings The Stradhaus, Hoxton, London2010). The top and bottom restraint conditions of the panel can be modeled as being restrained at each end in position only (i.e pin end top and bottom).
According to R.H. Leicester of the CSIRO, Victoria (Leicester 2009), two parameters are used in the calculation of the buckling strength of dimensioned timber structures when designing to Australian Standard - Timber Structures Part 1: Design methods (AS1720.1).
2.5 Wall Panel Axial In-Plane Loading 15
One of the objectives of this project is to identify if the formula in Appendix I of AS1720.1 is applicable to CLT wall panels. Formulae are provided for diaphragms with lateral edges free and subjected to uniformly loaded edge forces. This is appropriate as the ends of the CLT wall sections will not necessarily have lateral support, as is the case for a wall section between two wall openings.
Ing, Blass and Fellmoser (Blass, Fellmoser & Ingenieurholzbau 2004) identify the composite theory as the current design method for calculating plywood properties. They describe the composite theory as only taking the modulus of elasticity of elements of the plies acting parallel to the load into consideration. This leads to inaccuracies because plies perpendicular to the load contribute to the bending rigidity of CLT panels.
Contrary to Ing, Blass and Fellmoser, AS1720.1 (Standards Australia 2010b, Appendix I) takes into consideration a small (3%) contribution for the plies acting perpendicular to the load, when determining the bending rigidity.
Unfortunately, however the equation for calculating the buckling strength of plywood is inde-pendent of the bending rigidity of the section. The slenderness coefficient is based on the ply lay-up and the stability parameter used is similar to that for solid timber.
Further, Ing, Blass and Fellmoser (Blass et al. 2004) note that when taking the plies in the X-axis direction into consideration, rolling shear of the laminate will detract from the panel stiffness, i.e. the thicker the laminate running in the X-direction, the higher will be the shear deformation.
2.6 Wall Panel Raking Resistance (In-Plane Shear Capacity) 16
2.6
Wall Panel Raking Resistance (In-Plane Shear Capacity)
Besides axial loading, walls are also used to transfer shear forces from wind loads to the ground. Vessby et al. (Vessby, Enquist, Petersson & Alsmarker 2009) recommend CLT panels as an alternative to timber framing for narrow tall houses. This recommendation is because narrow tall houses require a lot of bracing capacity, and often there is insufficient wall length for the placement of bracing plywood. CLT panels are similar to plywood panels in that they have lamella with grain direction in both axis, which allows them to function as a wall panel in compression as well as a bracing wall in shear.
2.7
Accepted Theory - Stability and Buckling
The theoretical buckling load capacity can be determined linearly using Eulers formula. Three defined states of loading for a system are when the system is stable, in neutral equilibrium and unstable. An axially loaded system is considered in neutral equilibrium when the applied load can be removed, and the system returns to it’s original position. Euler’s formula for the critical buckling load is. . .
Pcr = π2EI
L2
where. . .
Pcr = critical buckling load E= modulus of elasticity
I= second moment of area
L= height of column or wall
When the restoring force of a column or wall is less than the applied loadF as indicated in figure 2.6, the system is termed unstable and will collapse.
2.7 Accepted Theory - Stability and Buckling 17
Where: P = Axial load R = Restoring force of Column
F = Destabilizing force
P P
R
F F R
Stable System Unstable System
Figure 2.6: Stable and Unstable Systems
equation. . .
σ= P
A
whereσ is the stress in the column or wall cross section, P is the applied load andAis the cross sectional area.
CLT load bearing panels can be described as slender columns with pin ends. Lateral support is only provided to the CLT wall panels at locations where a wall intersects. The trend in recent years is for large open span type living areas, and lateral support, therefore, cannot be assumed.
The important thing to note about the critical buckling load is that the material characteristic which alters the critical load is the stiffness, and not the strength of the material. Thus the modulus of elasticity and second moment of inertia are material variables which will determine the critical buckling load. Obviously the height of the wall is the most critical factor.
2.7 Accepted Theory - Stability and Buckling 18
It must be assumed that the CLT wall is going to be subjected to eccentric axial loads, due to material eccentricities within the wall because timber is an inhomogeneous material.
Deflection of an eccentrically loaded wall increases proportionally to the applied load. Bending stresses or deflection limits for serviceability may define the allowable load, as opposed to the critical load. According to Gere and Timoshenko (Timoshenko 1991, p.596), the following formula is used to calculate the maximum compressive stress on the inside face of a column. . .
σmax=
P
A +
Mmax
S (2.3)
Where
σmax= maximum stress on the compressive face p= axial compressive load
M = moment induced by the load eccentricity
e= load eccentricity
S= section modulus.
The moment induced by the axial compressive load on an eccentric column is related to the induced curvature of the beam-column. The mid-height deflection of a beam-column of certain eccentricity can be calculated using the following formula. . .
δ=e
secKL
2 −1
(2.4)
Combining equations (2.3) and (2.4), the following equation is formed, which is termed the se-cant equation and can be used to calculate the maximum compressive stress on the compressive face of a beam column. . .
σmax=
P A
"
1 +ec
r2sec
L 2r r P EA !#
2.7 Accepted Theory - Stability and Buckling 19
when Hooke’s Law holds.
Although Gere and Timoshenko specifically investigate compressive failure of the outermost fibre of the inner face, and derive the secant formula on this basis, it should be noted that other flexure failures need also be considered.
Australian Standards for design of Compressive Members - Design for strength AS1720.1 presents a formula similar to that presented by Timoshenko. The following formula is the design compressive strength capacity parallel to the grain. . .
Nd,c=σk1k4k6k12fc0Ac
Wherek1is the Duration of Load (DOL) factor,k4is a factor relating to moisture content and
k6relates to temperature. The remaining factork12is the stability factor.
Figure 2.7: Stability Factor VS Slenderness Factor (Standards Australia 2010b, p.32)
2.7 Accepted Theory - Stability and Buckling 20
Having ak12value which falls within the first area of plot 2.7, indicates column fails will be due to pure axial compression as opposed to buckling. In this range the compressive strength capacity is not dependant on the material stiffness, or the slenderness ratio.
In the second area of plot 2.7, the strength of the outer compressive fibre on the inner face is dominant because the slenderness ratio is not high enough for the column to fail by buckling within the proportional limit.
Chapter 3
Finite Element Analysis
3.1
Introduction
This chapter outlines the technical details and processes of Finite Element Analysis (FEA) to determine which CLT panel layup best suits the requirements of the low-rise multistorey residential building sector, and which can be economically produced by Hyne. A CLT panel layup refers to the number, thickness and direction of each lamella within the CLT panel.
Instead of fabricating and testing many different CLT panel layup samples, an FEA was con-ducted to predict a single suitable CLT Panel layup. The layup was selected based on a number of considerations including strength, available dimensional timber sizes which could be eco-nomically used in the CLT fabrication, and available test equipment capacities.
A nominal load case was developed for a low-rise multistorey residential building. The nomi-nal building wall height is also identified. Further considerations such as available dimensionomi-nal timber sizes are developed. This forms a criteria for selecting the CLT panel Layup for experi-mental analysis.
3.2 Properties of Dimensional Timber 22
testing were limited to a width of 300 mm due to the machine axial load capacity.
Density and acoustic modulus of elasticity of the timber were provided by Hyne prior to fabri-cation of the sample panels, and the remainder were taken from published data. Orientation of the orthotropic elastic properties for each lamella was undertaken graphically.
Actual restraint conditions at the top and bottom of a building vary between construction meth-ods. Restraint and loading conditions applied to the modeled wall sections are modeled as being a pin connection at the top and bottom of the wall. The walls were modeled using quad eight brick elements, and analysed using the linear buckling solver.
In summary, the following steps were required to select a suitable layup for experimental test-ing. . .
1. Determine the material properties of the dimensional timber used to fabricate the CLT panels
2. Define a nominal load case applicable to the low rise multistorey residential building sector
3. Identify a number of CLT layups which Hyne could economically produce
4. Undertake Finite Element Analysis (FEA) for all six of the identified CLT layups
5. Rationalise the results and select a suitable layup to fabricate samples
3.2
Properties of Dimensional Timber
The CLT sample panels were fabricated from a mixture of non-structural grade Slash Pine (Pi-nus Elliottii)and Caribbean Pine (Pi(Pi-nus Caribaea) dimensional timber. Mechanical properties, including orthotropic elastic properties of the timber elements were required to fully describe the behavior of the CLT trial panels by FEA modeling.
3.2 Properties of Dimensional Timber 23
species, and also within species due to discontinuities such as knots and sloping grain etc., a grading system was developed.
For Slash and Caribbean pine, grading systems could be either by Machine Grade Pine (MGP) stress grading or grading under the general F grade system. The MGP grading system for structural pine is a result of the ’in-grade testing program of Australian Pine (radiata pine, pinaster pine, slash pine and Caribbean pine), undertaken by CSIRO and State Forests of NSW’ in 1996 (Education Resources Structural Gradingn.d.). The program aimed to achieve a better yield of pine timber with a higher stress grade by implementing more rigorous machine testing techniques.
The properties refered to in the Australian Standards for timber design are fifth percentile characteristic mechanical properties as opposed to mean mechanical properties, which may be significantly higher. If fifth percentile characteristic strengths were used, then the resulting FEA model would not be comparable with the laboratory test results.
Hyne provided mean density and acoustic modulus of elasticity properties for the dimensional timber as measured prior to fabrication refer to Appendix 8. Where published mean mechanical properties for Australian grown Slash and Caribbean Pine could not be found, properties for American Slash and Caribbean Pine were substituted where required, on the basis that the modulus of elasticity and density of the American variety was similar to those measured by Hyne.
Because the test data received from Hyne was not specific as to the species of pine, the me-chanical properties of Slash Pine were used where no other data existed. According to the United States Department of Agrictulture (USDA), ’the mechanical properties of Slash Pine and Caribbean pine are rather similar’ (U.S. Department of Agriculture, Forest Service, Forest Products Laboratory 2010, p.2-39).
The mechanical properties for Slash Pine and Caribbean Pine from the USDA Forest Products Laboratory Wood Handbook, Hyne test data, and the MGP15 strength group are summarised on Table 3.1. The properties which were adopted for this project are also identified.
3.2 Properties of Dimensional Timber 25
because it has different elastic properties in different orthogonal directions.
Twelve constants describe the elastic properties of an orthotropic material, including three elastic moduli,E, three moduli of rigidityG, and six Poisson’s ratiosv(U.S. Department of Agriculture, Forest Service, Forest Products Laboratory 2010, p.5-2). Three of the Poisson ratios are dependant, and related via the following equation. . .
vij Ei
= vji
Ej
, i6=j i, j=L, R, T (3.1)
Orthotropic elastic properties of timber are approximately related to the longitudinal modulus of elasticity, and were therefore published as ratios to the longitudinal modulus of elastic-ity (U.S. Department of Agriculture, Forest Service, Forest Products Laboratory 2010, p.5-2).
The calculated orthotropic elastic properties for Slash Pine are provided in Table 3.2. No orthotropic data could be found for Caribbean Pine, however as previously stated, the material properties of Slash and Caribbean Pine are similar, and Slash Pine properties will therefore be substituted.
According to the Strand7 online manual (Strand7 Pty Ltd 2010), the compliance matrix for an orthotropic material is defined as . . .
C= 1 E1
−v21
E2
−v31
E3 0 0 0
−v12
E1 1
E2
−v32
E3 0 0 0
−v13
E1
−v23
E2 1
E3 0 0 0
−v13
E1
−v23
E2 1
E3 0 0 0
0 0 0 G1
12 0 0
0 0 0 0 G1
23 0
0 0 0 0 0 G1
31
3.2 Properties of Dimensional Timber 26
Table 3.2: Orthotropic Elastic Properties of Slash Pine
USDA Material Material Property Property Notation Value
Modulus of Elasticity (Mpa)
EL 17000
ET 1258
ER 935
Shear Modulus (Mpa)
GLT 901
GTR 170
GRL 935
Poisson’s Ratio
vLT 0.444
vTR 0.387
vRL 0.02
A discrepancy between the relationship of the six Poisson’s Ratios published in the Strand7 Online Manual (Strand7 Pty Ltd 2010) and Equation 3.1 was identified. The Strand7 Online Manual identifies one of the Poisson’s Ratio relationships as being. . .
v23E3 =v23E2 (3.2)
however, according to the USDA formula 3.1, the equation should read· · ·
v23E3 =v32E2 (3.3)
The USDA published formula is adopted for this thesis, and according to the Strand7 Manual,
3.3 Calculation of Nominal Wall Loads 27
Table 3.3: Roof Dead Loads
Roof Dead Loads Mass (kN/m2) Terracotta tiles (french pattern) 0.12
Timber trussed metal roof 0.12 Gypsum plaster (13 mm) 0.13
Total 0.37
3.3
Calculation of Nominal Wall Loads
Three storey low-rise apartments constructed in brick, rendered masonry and framed timber are popular in Australia. Hyne already services the low-rise residential market with other timber products and so, in the short term, this market presents a logical entry point for CLT wall products.
In the late 1970’s, a standardised three storey brick block of flats emerged which was very economical to build and popular with investors. Three storey residential units are economical for developers because in general, they do not require the additional expense of services such as pressure boost water pumps and elevators, which are required by medium rise buildings.
In more recent times, architectural flare has seen a trend toward more complex and aesthetically pleasing buildings. As architectural flare is difficult to predict, a standardised rectangular build-ing of similar proportions to the three storey brick block of flats will be used for the purposes of this project.
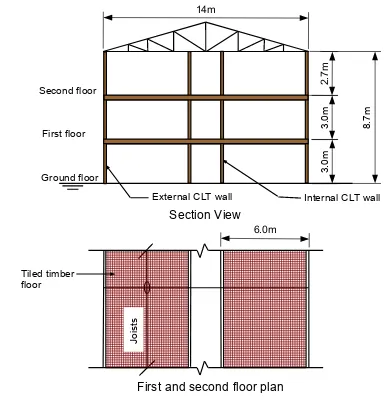
A cross section of the nominal unit block is indicated in figure 3.1. The CLT wall under consideration will be the external wall on the ground floor. This wall supports floor load widths and half of the roof span.
Standard construction systems producing the highest axial in-plane wall loading case are as-sumed. The floor is therefore a 300 mm thick tiled timber floor system, consisting of Hyne timber I-Beams, 15 mm thick cement fibre board and tiles over, which is the industry standard for bathrooms on timber framed floors.
3.3 Calculation of Nominal Wall Loads 28
First and second floor plan
Section View
14m
8.
7
m
3
.0
m
6.0m
3.
0m
2.
7m
Jo
is
ts
Tiled timber floor
Ground floor First floor Second floor
Internal CLT wall External CLT wall
[image:43.595.114.499.111.517.2]Figure 3.1: Nominal Residential Unit Building
Table 3.4: Floor Dead Loads
Floor Dead Loads Mass (kN/m2)
Tiles 0.27
Fibre cement sheet (15 mm) 0.23 Hyne I-beam joists at 450 mm crs. 0.18
3.3 Calculation of Nominal Wall Loads 29
on each level. The roof system is a timber trussed roof spanning between external walls, with terracotta tiles. Roof and floor dead loads used in the following calculation were taken from AS/NZS 1170.1 Structural Design Actions Part 1: permanent, imposed and other actions (Standards Australia 2002). Dead loads are summarised in tables 3.3 and 3.4.
As the load case considered is for a wall, a universally distributed load (UDL)is appropriate. The following equations 3.4 to 3.6 yield the required axial in plane ultimate load.
Dead Load. . .
G= (MRoof×RLW) + (MFloor×F LW) + (MWall×HWall)
= 0.37×7.0 + 0.68×6 + 0.63×5.7
= 10.26 kN/m (3.4)
WhereGis the dead load,RLW is the roof load width,F LW is the floor load width,HWallis the wall height andM is the mass of the associated element. The mass of the wall assumes a 100 mm thick CLT wall section.
Live Load. . .
Q= (QRoof×RLW) + (QFloor×F LW)
= 0.25×7 + 1.50×6.0
= 10.75 kN/m (3.5)
Where Q is the uniformly distributed live load on the wall. Applied live loads QRoof =
0.25 kPa and QFloor = 1.5 kPa were taken from Table 3.2 of AS/NZS 1170.1 Structural Design Actions Part 1 (Standards Australia 2003, pg.506).
Ultimate Axial Load. . .
N∗ = 1.2G+ 1.5Q
= 1.2×10.26 + 1.5×10.75
3.4 Trial CLT Layups 30
whereN∗is the ultimate axial compressive wall load.
According to AS1720.1-1997 (Standards Australia 2003, pg307), the required design com-pressive capacity of timber parallel to the grain (Nc) can be calculated from the following
equation. . .
Nc=
N∗
φ
= 28.44 0.65
= 43.7 kN/m (3.7)
Whereφis the capacity factor for compressively loaded timber for the nominal building.
There is no suggested serviceability limit in AS/NZS 1170.2 for timber walls, however as the walls would likely be lined with plaster or gypsum board, Table C1 specifies an appropriate element response of wall height/300.
3.4
Trial CLT Layups
Apart from strength and serviceability, a number of considerations were taken into account when deciding the most suitable CLT layup including:
• Available timber sizes produced at the Hyne timber mill
• Complexity of CLT panel manufacture
• Capacity of the University of Southern Queensland axial load test rig
3.4 Trial CLT Layups 31
is required prior to bonding to ensure an even surface, an allowance of between two and four millimeters was provided for all bonded surfaces.
The preferred layup is three layers, because this reduces manufacturing costs. The advantages of additional layers is increased dimensional stability and homogenisation. To what extent the disadvantages outweigh the advantages or vice-versa is difficult to determine due to the complexity of modeling timber discontinuities using FEA.
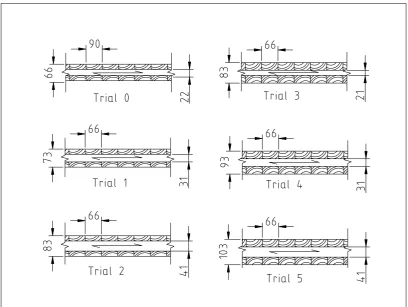
[image:46.595.116.525.324.631.2]Due to the technical difficulties of gluing and applying bonding pressure for curing, Hyne specified that short edges would not be bonded. Applying the required 1 MPa of pressure to the short edge of the boards, as well as the long edge, requires a specialist CLT press, not available at the time of manufacture.
Figure 3.2: Trial CLT Cross Sections
3.5 The Finite Element Model 32
Six trial CLT layups were identified for FEA modeling, and a cross section of each is indicated in figure 3.2.
3.5
The Finite Element Model
Strand7 is a general purpose finite element analysis package developed by G+D Computing, and offered by Strand7 Pty Ltd. The software has the capacity to analyse beam, plate and brick elements using a variety of solvers. The two solvers used for analysis in this project are linear static solver and the Linear buckling analysis solver.
The following steps were undertaken for each trial layup. . .
1. Create the geometric model
2. Apply material properties
3. Apply restraint conditions
4. Apply loads
5. Solve for linear static and linear buckling analysis
6. Check model quality
3.5.1 Model Geometry and Material Properties
Each geometric model was constructed of quad eight brick elements. If smaller than necessary element sizes are used, the model becomes inefficient to solve, and if the elements are too coarse, then the results may be inaccurate.
For simplicity, all quad-eight block elements were modeled with overall dimensions 100 mm×
3.5 The Finite Element Model 33
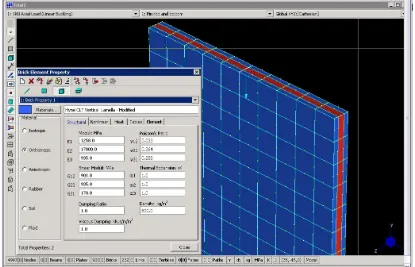
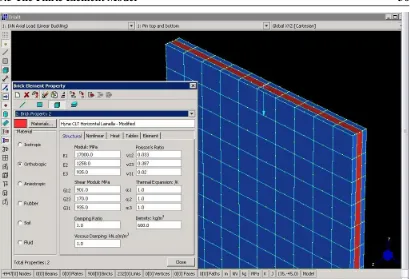
The model was created by firstly using the grid command to create a quad eight plate element with the same overall dimensions as the wall panel. The plate was then extruded into brick elements. As there are three lamella, the brick element material properties were incremented such that the outside lamella had the same material property and the central lamella had a different material property.
A single material property could have been assigned to brick elements on a local axis basis, however this would have resulted in a complex FEA model, and differentiation between hori-zontal and vertical lamella in the Strand7 graphical environment would have been difficult.
For simplicity, two material properties were used, one for each lamella grain direction. The first material property (Material Property 1) was applied to lamella with a vertical (global Y-Axis) grain direction, and the second material property (Material Property 2) was applied to lamella with a horizontal (global X-Axis) grain direction. In Strand7, if no local axis are assigned, material property directions 1,2 and 3 correspond to global directions X,Y and Z respectively.
G ra in d ir ec tio n
Longitudinal to log (L), Strand 7 global direction (2)
Radial to log (R), Strand 7 global direction (3)
Tangential to log (T), Strand 7 global direction (1)
Figure 3.3: Transformed Material Properties for Vertical CLT Lamella
Instead of using a transformation tensor to re-orient the elastic material properties provided in section 3.2, the transformation of axis for material properties was done graphically as shown in figures 3.3 and 3.4.
3.5 The Finite Element Model 34
Longitudinal to log (L), Strand 7 global direction (1)
Radial to log (R), Strand 7 global direction (3) Tangential to log (T),
Strand 7 global direction (2)
Grain dire
[image:49.595.112.527.415.682.2]ction
Figure 3.4: Transformed Material Properties for Horizontal CLT Lamella
3.5 The Finite Element Model 35
Table 3.5: FEA Material Properties Summary
USDA Material Strand7 Material Strand7 Material Material Property Notation Property 1 Property 2 Property Value
Modulus of Elasticity (Mpa)
EL E2 E1 17000
ET E1 E2 1258
ER E3 E3 935
Shear Moduli (Mpa)
GLT G21 G12 901
GTR G13 G23 170
GRL G32 G31 935
Poissons Ratio
vLT v21 v12 0.444
vTR v13 v23 0.387
vRL v32 v31 0.020
vTL v12 v21 0.033
vRT v31 v32 0.288
3.5 The Finite Element Model 36
Figure 3.6: Strand7 Orthotropic Block Element Material 2
3.5.2 Forces and Restraints
Understanding the restraint conditions to apply to the wall requires knowledge of the construc-tion method to be used. In general, low-rise multistorey CLT buildings are constructed using the platform method. By definition, walls of buildings constructed using the platform method are discontinuous between levels. Manufacturing, transporting and handling walls taller than three meters is not practical.
The flooring system adopted for the nominal building structure is the Hyne I-Beam floor joist product. I-beams are engineered beams consisting of a top and bottom chord connected with a shear web. Given the depth of the nominated floor joists (300 mm), it is not realistic that the floor joists bear directly on top of the walls. In this situation, the connection detail should have the floor joists supported on joist hangers to the side of the wall as shown in Figure 3.7.
3.5 The Finite Element Model 37
Figure 3.7: I-Joist to CLT Wall Panel Connection(Pryda Australia 2009)
The sides of the walls were modeled as being unrestrained, and no global restraints were ap-plied. Obviously for a continuous wall, there would be some interaction with the continuing wall, and a check of the model quality is discussed in subsequent sections.
Globally applied vertical load D iff er en tia l de fle ct io n o f ce nt ra l la m el la
Gap in horizontal lamella
Figure 3.8: Wall Top Edge Local Deflection
3.5 The Finite Element Model 38
modulus of elasticity of timber parallel to the grain is much lower than that perpendicular to the grain.
Applying a global pressure to the top of the wall is inaccurate for two reasons, firstly because the central lamella cannot displace further than the exterior lamella due to the joist attachment geometry, and secondly, the central horizontal lamella was not pressed along the short edge dur-ing fabrication and therefore, may not effectively transfer the applied load between horizontal dimensional timber elements.
Figure 3.9: Strand7 Rigid Link Example (Strand7 Pty Ltd 2010)
A better method of applying the load to the top of the wall was to rigidly link all of the nodes to a master node in the center of the wall at the top. This is akin to placing an infinitely rigid top and bottom plate to the wall.The concept of applying rigid links is best demonstrated in figure 3.9. Applying rigid links to the top and bottom edges also simplifies the model because node restraints other than the two master nodes were not required.
The rigid links, master node, and applied loads for the top of Trial 1 CLT layup are shown in figure 3.10. The bottom of the wall is similar except that instead of a load being applied to the node, the node is restrained in the global Y-Axis. A summary of node restraints is provided in Table 3.6, where Node 1 refers to the Node located at the bottom of the wall, and Node 2 refers to the node at the top of the wall.
3.6 Model Sensitivity and Boundary Conditions Check 39
Figure 3.10: Trial 1 Rigid Links, Node Restraints and Unit Load
calculate the element geometric stiffness (Strand7 Pty Ltd 2010). The linear static analysis was undertaken with an applied load of -1 kN in the Y axis direction. This load was applied for the linear static analysis because the output from the linear buckling solver is a single buckling load factor for each buckling mode, which can then be multiplied by the applied load to determine the critical bucking load.
3.6
Model Sensitivity and Boundary Conditions Check
A simple check to identify if the element sizes are sufficiently small, is to subdivide all of the brick elements and re-run analysis. When subdivided, each brick element is divided into four new brick elements.
If the difference between the buckling capacities is insignificant, say less than 1% for example, then element size is assumed to be suitable. If the resulting difference in buckling capacities is large, then the wall needs to be broken down into additional elements.
3.7 Results of Finite Element Analysis 40
Global Axis Restraint Lateral Rotational Node 1
X F R
Y F F
Z F F
Node 2
X F R
Y R F
Z F F
Table 3.6: Node Restraint Conditions (F=Fixed R=Released)
which require a higher resolution of elements.
One further quality check was undertaken regarding boundary conditions at the sides of the 1m wall section. The Strand7 model of the wall is 1m long, however in reality, the wall could be as long as the building.
To check the assumption that the linear buckling load of the modeled 1m wall is accurate to be used as a unit length buckling load, and that the boundary conditions on the side of the 1m wall have little effect, the wall was modeled as being two meters long, and the buckling load results compared.
Load comparison is only for the first buckling mode because modes above the first mode are not physically possible for the vertically discontinuous CLT wall section modeled with pin ends. The boundary condition check was only undertaken for the Trial 1 CLT layup.
3.7
Results of Finite Element Analysis
3.7 Results of Finite Element Analysis 41
3.7.1 Trial CLT Finite Element Analysis Results
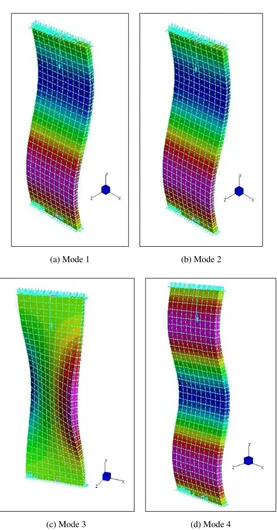
The linear buckling solver calculated four modes of buckling failure. Though the graphical output indicates displacement and strain, only the critical buckling loads and associated modes of failure are obtained from the linear static buckling analysis.
Deflection and stress data is not attainable unless a linear analysis is conducted. A non-linear analysis involves applying loads at load intervals until convergence cannot be obtained. At this point the wall would be said to have buckled.
All of the CLT trial samples produced similar buckling mode shapes. The buckling mode shapes provide an insight into possible failure modes which would need to be considered if the walls were continuous over two or more levels. They also provide insight into the effects of the boundary conditions. The four modes of failure for Trial Layup 2 are shown in figure 4.10.
As an example of how the boundary conditions effect the buckling mode, if the wall was mod-eled as being longer, or the nodes on the sides of the wall were restrained from lateral movement in the Z-direction, the buckling mode shape of figure 3.13b, and the associated critical buckling load would be significantly different.
Table 3.7: Trial CLT Layup Linear Buckling Capacity Results
CLT Layup
Linear Static Buckling Loads (kN) Buckling Mode
1 2 3 4
Trial 0 367.8 1373.01 2119.71 2777.58 Trial 1 545.28 1974.33 3056.93 3838.1 Trial 2 758.49 2666.64 4153.66 49998.97 Trial 3 845.78 3057.44 4638.57 5930.67 Trial 4 1150.12 3998.16 6037.28 7401.39 Trial 5 1501.5 5026.91 7576.37 8925.38
3.7 Results of Finite Element Analysis 42
(a) Mode 1 (b) Mode 2
[image:57.595.183.460.143.673.2](c) Mode 3 (d) Mode 4
3.7 Results of Finite Element Analysis 43
buckling analysis for each of the five trial Layups are provided in Table 3.7.
In addition to the capacity factor applied to the design action effect, modification factors apply, specificallyk1, k4, k6, k11, which are for the effects of duration of load, moisture condition, temperature, and size respectively.
Table 3.8: Trial CLT Layup Design Buckling Load Capacities
CLT Layup CLT Critical Buckling CLT Design Buckling Load (kN) Capacity, (φN) (kN)
Trial 0 367.8 209.65
Trial 1 545.28 310.81
Trial 2 758.49 432.34
Trial 3 845.78 482.09
Trial 4 1150.12 655.57
Trial 5 1501.5 855.86
Assuming that the building has a design life of 50 years, and is built in normal conditions of temperature and humidity, all of the modification factors are unity, apart from k1. k1 is the duration of load factor and is equal to 0.57. The calculated design compressive buckling capacity of the CLT panels is summarised in table3.8.
3.7.2 Sensitivity Analysis and Boundary Condition Check Results
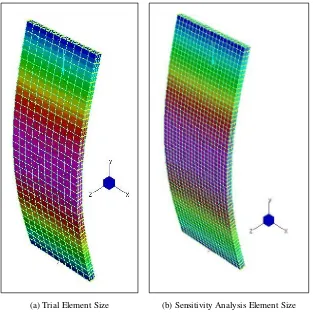
The first mode critical buckling load for the Trial 1 CLT layup is 545.28 kN. Subdividing the model resulted in an increase in the number of brick elements from 300 to 3600. The model was then re-solved, and the resulting critical buckling load decreased to 545.13 kN, which is a net percentage decrease of 0.03 %.
This result indicates that the model has a sufficient element resolution to provide consistent results regardless of increasing the number of brick elements. The Trial 1 CLT layup first mode buckling shape for the normal and subdivided models are shown in figure 3.12.
3.7 Results of Finite Element Analysis 44
[image:59.595.165.478.257.570.2](a) Trial Element Size (b) Sensitivity Analysis Element Size
3.8 Summary of FEA and Selection of Trial Experimental CLT Layup 45
[image:60.595.151.511.78.413.2](a) One Meter Wall (b) Two Meter Wall
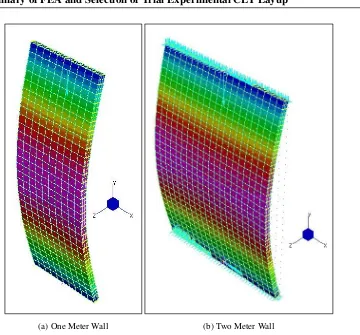
Figure 3.13: Trial 1 CLT Layup Model and Associated Boundary Condition Check Model
at the edge of the wall are made insignificant. To check the boundary condition, the the length of the Trial 1 CLT wall model was increased from 1 m to 2 m, and the results compared.
Boundary condition check results indicate that increasing the length of the Trial 1 CLT wall from 1 m to 2 m increases the critical buckling load from 545.13 kN to 546.58 kN. This increase represents a net percentage increase of 0.26%, which is insignificant. The Trial 1 CLT wall layup 1m and 2m long wall models are shown in figure 3.13.
3.8
Summary of FEA and Selection of Trial Experimental CLT
Layup
3.8 Summary of FEA and Selection of Trial Experimental CLT Layup 46
Results of the FEA indicate that the trial CLT layups have a much higher design buckling capacity (φN) than is required for the nominal load case (N∗). The thinnest of the six CLT layups, which comprises of three lamella, all 21 mm thick, has a design buckling capacity of 209.65 kN/m, whilst the design action effect for the nominal load case requires a load bearing capacity of only 43.7 kN/m. This represents a safety factor of 4.78.
The design buckling capacity (φN), has been modified to include the effects of moisture, tem-perature and duration of load in accordance with AS1720.1-1997,Timber structures, Part 1: Design Methods. It should be noted that the design buckling capacity derived from the FEA analysis does not take into account inhomogeneities in timber such as knots and sloping grain, and therefore is not conservative.
The CLT layup which best fits the criteria for experimental testing in terms of meeting the requirements of the intended market, being constructed of dimensional timber sizes currently being produced by Hyne and which can be tested on available test equipment, is the layup which consists of three lamella, each 22 mm thick (22/22/22).
Chapter 4
Experimental Design
4.1
Introduction
In order to meet the requirements of the project specification, two experiments were required to be conducted, those being the in-plane load capacity and a bending test to determine the modulus of elasticity of the CLT panel. This chapter is intended to provide details of the two test procedures developed to determine the required properties.
Sample preparation for axial load testing at the University of Southern Queensland involved trimming three samples provided by Hyne to 2.7 m long so that they would fit between the load plates of the axial load test rig. No further preparation of the samples was required for either of the tests.
4.1 Introduction 48
4.1.1 Materials
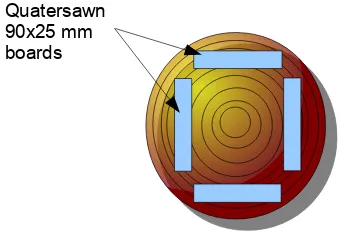
Machine grading equipment at the Hyne & Son Tuan Mill in Maryborough, QLD, optimizes the yield of high grade timber by detecting and removing sections of lower grade timber, such as knots and timber with sloping grain, from otherwise high grade stock. The 25 mm×90 mm boards used to fabricate the CLT samples were tested, but not graded, during milling.
[image:63.595.214.384.246.363.2]Quatersawn 90x25 mm boards
Figure 4.1: Locations of 25 mm×90 mm Boards within Parent Log
Typical commercial application of the 25 mm×90 mm timber boards produced by Hyne is for use as fence posts and other similar non-structural applications. The boards are quartersawn from the outside of the parent log as shown indicatively in figure 4.1. For Australian Slash and Caribbean Pine, boards cut from positions close to the outside of the log typically have a higher modulus of elasticity than timber from the rest of the log.
4.1 Introduction 49
Figure 4.2: Wagner Moisture Meter
4.1.2 Sample Fabrication Procedure
The sample width was dictated by the requirement for handling during testing at the University, and also dimensions of the boards used in the sample fabrication. The dimensions of the boards were 22 mm×90 mm. The samples were fabricated three boards wide (270 mm) for simplicity of fabrication, and to reduce boundary condition effects on the sides of the wall samples.
The process of fabricating the CLT samples panels is as follows. . .
• The boards for the first CLT lamella were assembled on an LVL platen press
• Glue was evenly applied to the exposed upper surface of the first lamella
• The second lamella was placed over the first lamella noting orthogonal grain orientation
• Glue was evenly applied to the exposed upper surface of the second lamella
• A final check that all of the boards were assembled as closely as possible was undertaken
4.1 Introduction 50
• After a curing time of 25 min, the sample was removed from the press
Figure 4.3: Assembly of CLT Panel
During production of the first sample CLT panel, a load was applied to the sides in order to compress the individual timber elements together on their short edge, however, this resulted in the upper lamella arching up in the center. Subsequent samples were produced without any side loads. An exploded view of the CLT sample in the LVL platen press is provided in figure 4.3.
The glue used in the production of the CLT panels was Purbond HB S109, which is a new generation single component isocyanate adhesive developed by Purbond. The adhesive has an open time (or working time) of 10 min, and a press time of 25 min before curing. A chemical reaction between moisture in the atmosphere and the glue causes the glue to cure (Purbond 2010).
Given the short time frame for assembly of the dimensional timber elements, it was possible that some areas of glue on the first laminate tacked-off prior to pressing. KLH Massivholz GmbH, a recognised CLT fabricator in Europe, recommends pressing laminates with a pressure of 60 kPa to achieve a high quality adhesion (KLH Massivholz GmbH 2010). The LVL press used to fabricate the samples could achieve a maximum pressure of 0.5 MPa.
4.2 Axial Load Capacity of CLT Wall Panels 51
Figure 4.4: CLT Samples Fabricated by Hyne
4.2
Axial Load Capacity of CLT Wall Panels
4.2.1 Introduction
This section provides an overview of the experimental design of the axial load test. A review of the technical aspects of the experiment followed by development of detailed experimental procedures is undertaken.
A number of samples fabricated by Hyne to the same specification were tested. Ideally the samples would have been tested to the full 3.0 m wall height as defined by the nominal resi-dential building case, however the maximum height which could be tested in the axial load test rig at the University of Southern Queensland was 2.7 m.
When timber is loaded axially, typical failure modes are normal compressive failure, beam-column failure and buckling failure, depending on the geometry of the sample and applied load conditions. Other failure modes may result from flexure of the wall.
4.2 Axial Load Capacity of CLT Wall Panels 52
the material.
The test setup was chosen to provide an indication of the wall’s load capacity in terms of ser-viceability and ultimate strength. The serviceable limit for mid-height deflection as defined for the nominal residential multistorey building is 300h , wherehis the height of the wall. There-fore, the mid height deflection of the CLT wall panel was measured and logged in relation to the applied load.
2
.7
m
9mm P= Maximum
service load P= Ultimate buckling load
Y
-A
xi
s
de
fl
ec
ti
on
[image:67.595.232.406.237.399.2]P= 0 (initial conditions)
Figure 4.5: Axial Load Test, Loads of Interest
Axial deflection, though not specifically defined in AS1170.2 as a serviceability criterion for walls, was measured and logged in relation to the ap